. 2019 May 20:2:186.
doi: 10.1038/s42003-019-0430-6. eCollection 2019.

Genetic analyses of human fetal retinal pigment epithelium gene expression suggest ocular disease mechanisms

Affiliations

Genetic analyses of human fetal retinal pigment epithelium gene expression suggest ocular disease mechanisms

Boxiang Liu et al. Commun Biol. .

Abstract

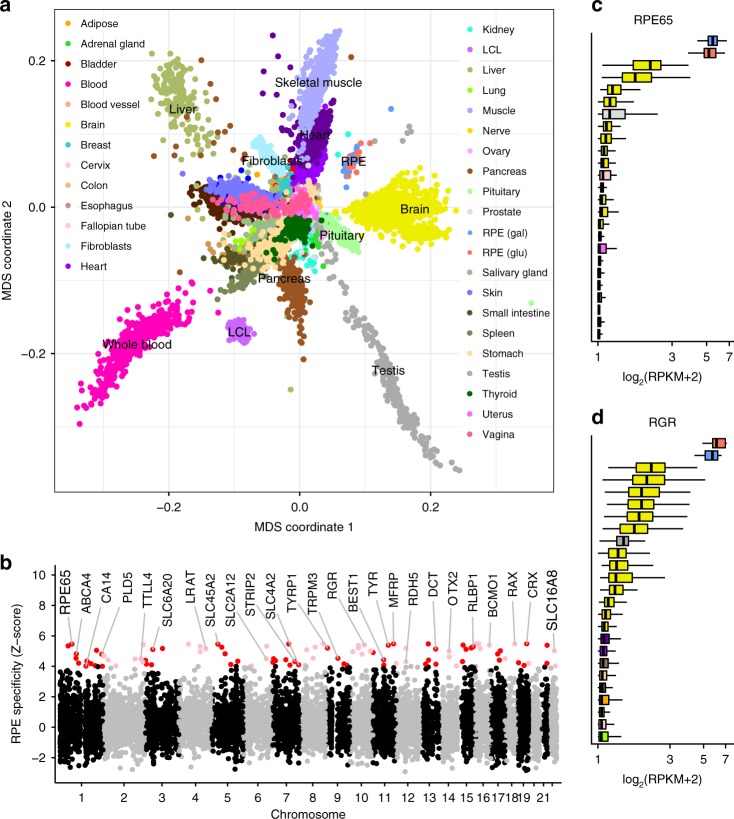
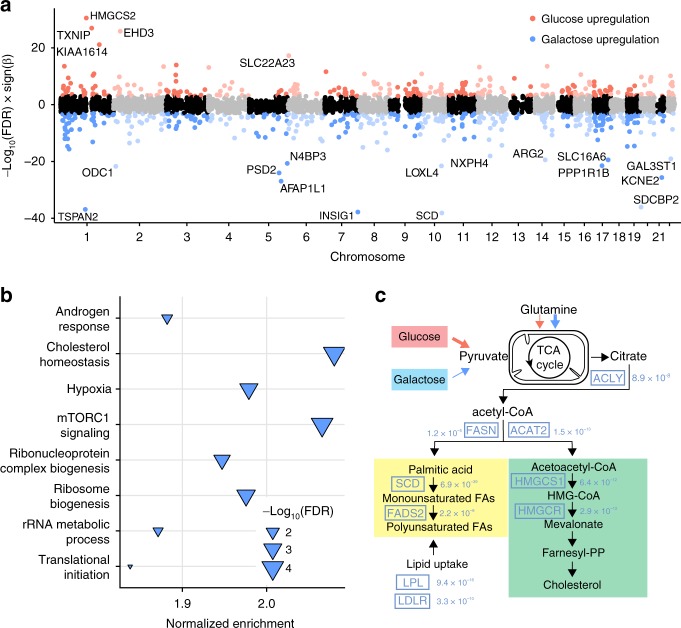
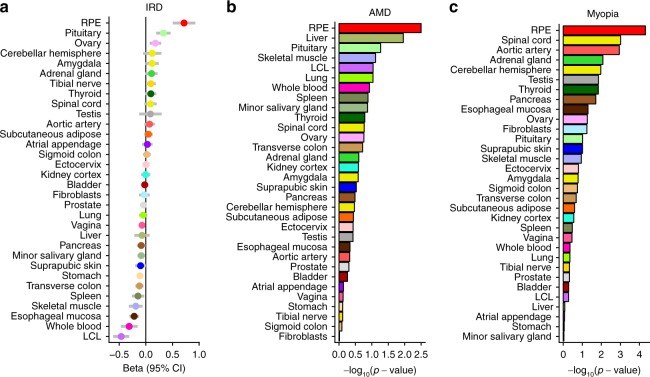
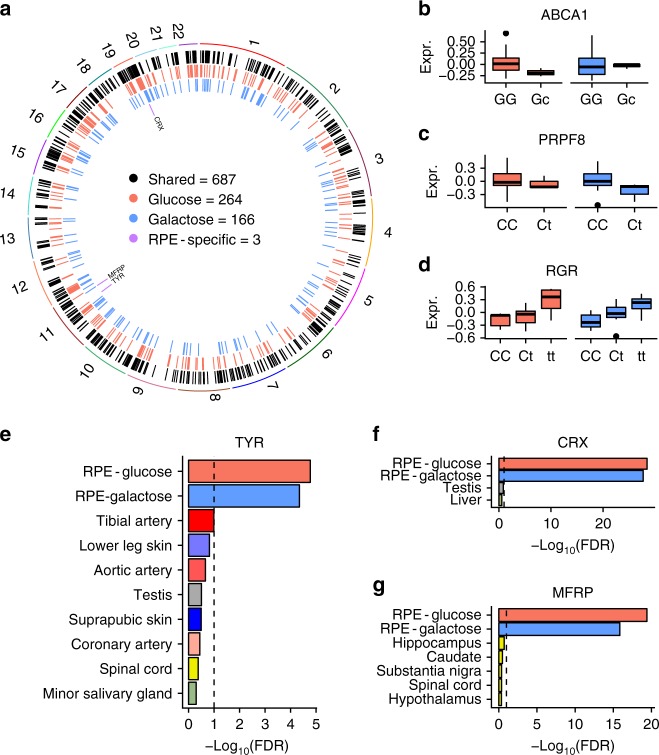
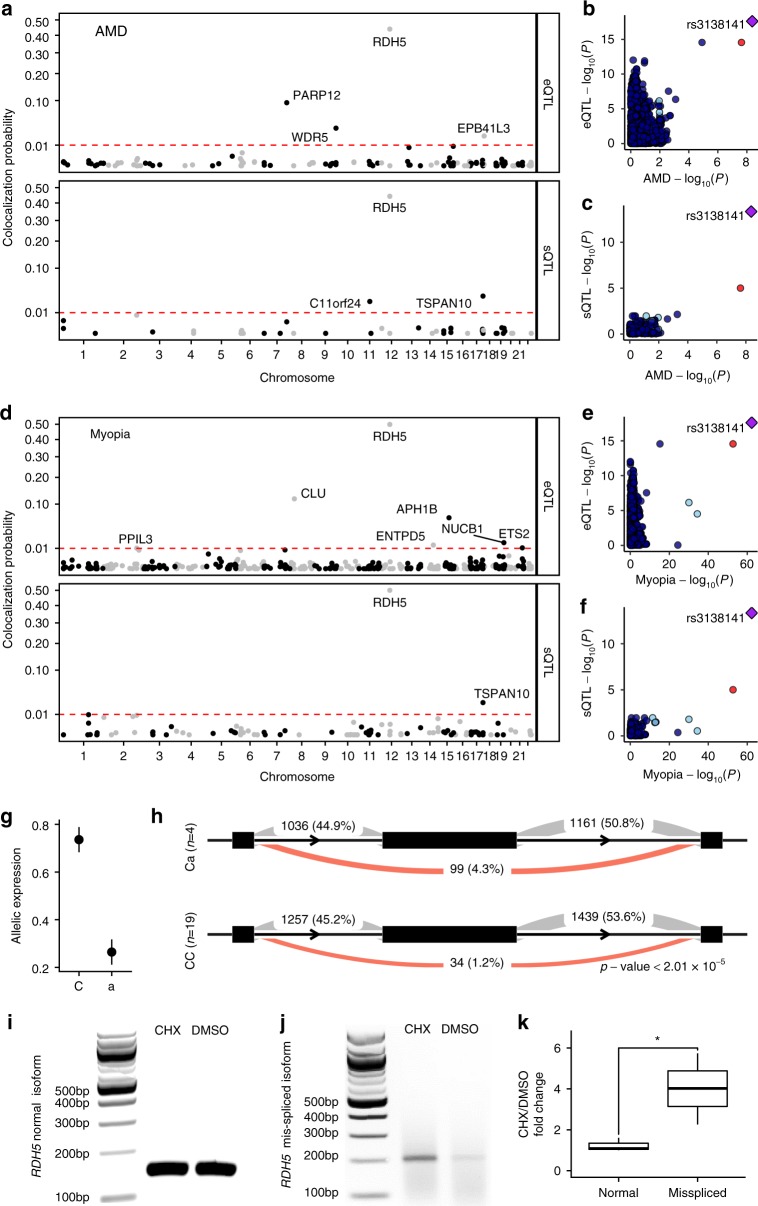
The retinal pigment epithelium (RPE) serves vital roles in ocular development and retinal homeostasis but has limited representation in large-scale functional genomics datasets. Understanding how common human genetic variants affect RPE gene expression could elucidate the sources of phenotypic variability in selected monogenic ocular diseases and pinpoint causal genes at genome-wide association study (GWAS) loci. We interrogated the genetics of gene expression of cultured human fetal RPE (fRPE) cells under two metabolic conditions and discovered hundreds of shared or condition-specific expression or splice quantitative trait loci (e/sQTLs). Co-localizations of fRPE e/sQTLs with age-related macular degeneration (AMD) and myopia GWAS data suggest new candidate genes, and mechanisms by which a common RDH5 allele contributes to both increased AMD risk and decreased myopia risk. Our study highlights the unique transcriptomic characteristics of fRPE and provides a resource to connect e/sQTLs in a critical ocular cell type to monogenic and complex eye disorders.

Keywords: Computational biology and bioinformatics; Gene expression; Macular degeneration.


Conflict of interest statement

Competing interestsStephen Montgomery is on the Scientific Advisory Board of Prime Genomics. The remaining authors declare no competing interests.

Figures

Fig. 1
Fig. 1
Characteristics of the fRPE transcriptome. a Multidimensional scaling against GTEx tissues locates fRPE near heart, skeletal muscle, and brain samples. b A subset of the fRPE-selective gene set defined by z-score >4 is shown including RPE signature genes such as RPE65 and new genes such as TYR. Red/pink dots indicate fRPE-selective genes with z-score >4 in both glucose and galactose conditions. c, d Two examples of the expression levels of fRPE-selective genes in various GTEx tissues. Only the top 25 tissues are plotted for visual clarity. For a, c, and d, red indicates fRPE glucose condition and blue indicates fRPE galactose condition. For c and d, each element of the boxplot is defined as follows: centerline, median; box limits, upper and lower quartiles; whiskers, 1.5× interquartile range
Fig. 2
Fig. 2
Differential expression across two metabolic conditions. a Transcriptome-wide differential expression patterns: red indicates upregulated in glucose, blue indicates upregulated in galactose. b Gene set enrichment analysis of differentially expressed genes. The pathway most enriched is cholesterol homeostasis (upregulated in galactose condition). c Key genes involved in cholesterol biosynthesis and import are upregulated in response to the increased oxidation of glutamine that occurs in the galactose condition. Estimated FDR values are shown next to the gene names
Fig. 3
Fig. 3
fRPE-selective genes are enriched in monogenic and polygenic diseases. a Genes causal for inherited retinal disorders (IRD) have elevated expression in fRPE. b, c Variants near RPE-selective genes explain a larger proportion of AMD (b) and myopia (c) risk than those near GTEx tissue-selective genes. The red bar represents the top 500 fRPE-selective genes
Fig. 4
Fig. 4
Landscape of genetic regulation of RPE gene expression. a We discovered 687, 264, and 166 eQTLs that are shared, glucose-specific, and galactose-specific, respectively. Comparison with GTEx eGenes revealed three shared eGenes that are currently unique to fRPE. b A glucose-specific eQTL in ABCA1. c A galactose-specific eQTL in PRPF8. d A shared eQTL in RGR. The y-axis of panels bd denotes normalized expression values. eg Evidence for fRPE-specificity for three eQTLs compared to GTEx. Black dashed lines indicate FDR = 0.1. Minor alleles are indicated by lowercase. For b, c, and d, each element of the boxplot is defined as follows: centerline, median; box limits, upper and lower quartiles; whiskers, 1.5× interquartile range
Fig. 5
Fig. 5
Fine mapping of disease-associated variants using fRPE gene regulation. a Colocalization posterior probability for fRPE e/sQTLs with AMD. b, c Scatter plots demonstrate clear colocalization between AMD GWAS signal at rs3138141 and RDH5 eQTL (b) and sQTL (c). d Colocalization posterior probability for fRPE e/sQTLs with myopia. e, f Scatter plots demonstrate clear colocalization between myopia GWAS signal at rs3138141, the same variant identified for AMD, and RDH5 eQTL (e) and sQTL (f). af Colocalization results are with glucose QTLs. Galactose QTL colocalizations can be found in Figs. S18–19. g Relative allelic expression estimated by RASQUAL with 95% confidence intervals is shown. h Increased skipping of RDH5 exon 3 (middle black rectangle) is associated with the minor allele at rs3138141. The average read counts are shown for three splice junctions in groups of fRPE cells with different genotypes. The proportion of counts for all three sites for a given junction and genotype is shown in parenthesis. Exon and intron lengths are not drawn to scale. Minor alleles are indicated by lowercase. i Gel image showing RHD5 normal isoform amplified from CHX or DMSO treated ARPE-19 cells. j Gel image showing RHD5 mis-spliced isoform amplified from CHX or DMSO treated ARPE-19 cells. k Relative fold change between CHX and DMSO treatments for normal and mis-spliced RNA isoforms. Error bars indicate standard error of the mean for n = 3 independent experiments. *p < 0.05

Similar articles

Cited by

References

    1. McKusick VA. Mendelian inheritance in man and its online version, OMIM. Am. J. Hum. Genet. 2007;80:588–604. - PMC - PubMed
    1. Boon CJF, et al. The spectrum of retinal dystrophies caused by mutations in the peripherin/RDS gene. Prog. Retin. Eye Res. 2008;27:213–235. - PubMed
    1. Nash BM, Wright DC, Grigg JR, Bennetts B, Jamieson RV. Retinal dystrophies, genomic applications in diagnosis and prospects for therapy. Transl. Pediatr. 2015;4:139–163. - PMC - PubMed
    1. Paunescu K, Preising MN, Janke B, Wissinger B, Lorenz B. Genotype–phenotype correlation in a German family with a novel complex CRX mutation extending the open reading frame. Ophthalmology. 2007;114:1348–1357.e1341. - PubMed
    1. Sundin OH, et al. Extreme hyperopia is the result of null mutations in MFRP, which encodes a Frizzled-related protein. Proc. Natl Acad. Sci. 2005;102:9553–9558. - PMC - PubMed

Publication types

Substances