. 2019 May 20:2:190.
doi: 10.1038/s42003-019-0443-1. eCollection 2019.

Constitutive alterations in vesicular trafficking increase the sensitivity of cells from celiac disease patients to gliadin

Affiliations

Constitutive alterations in vesicular trafficking increase the sensitivity of cells from celiac disease patients to gliadin

Giuliana Lania et al. Commun Biol. .

Erratum in

Abstract

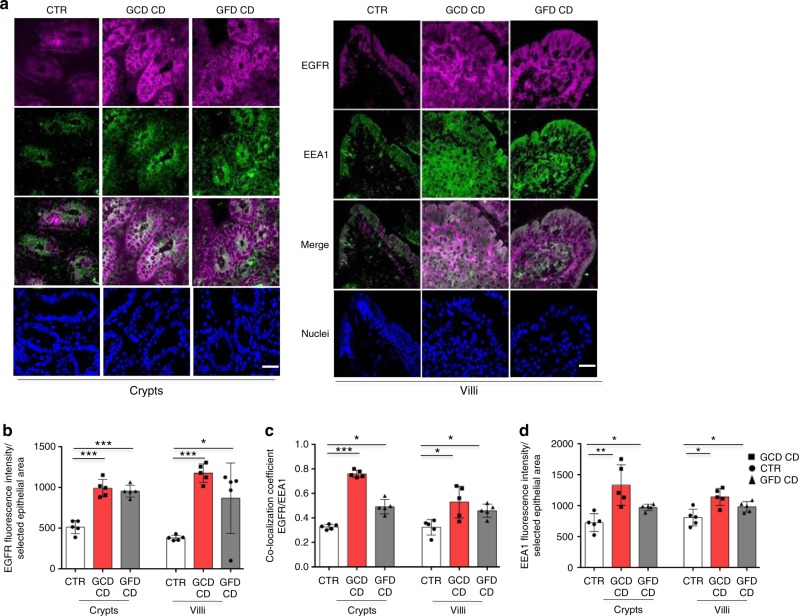
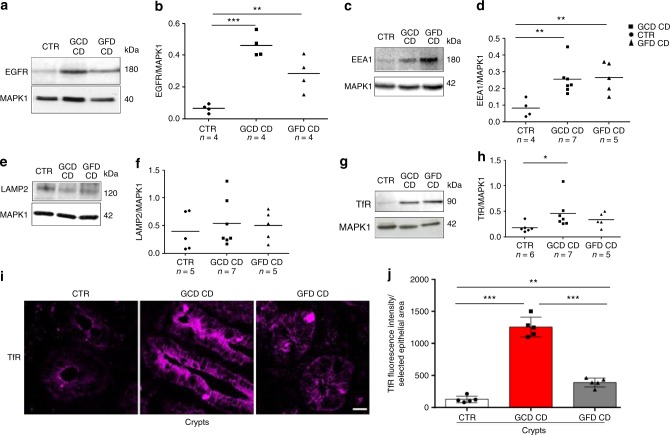
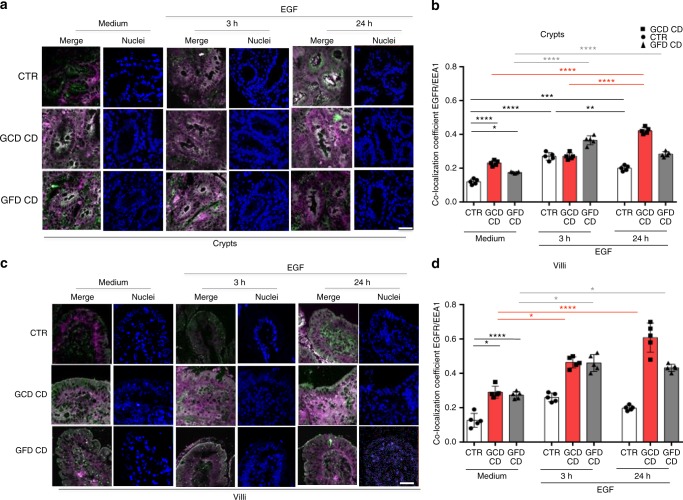
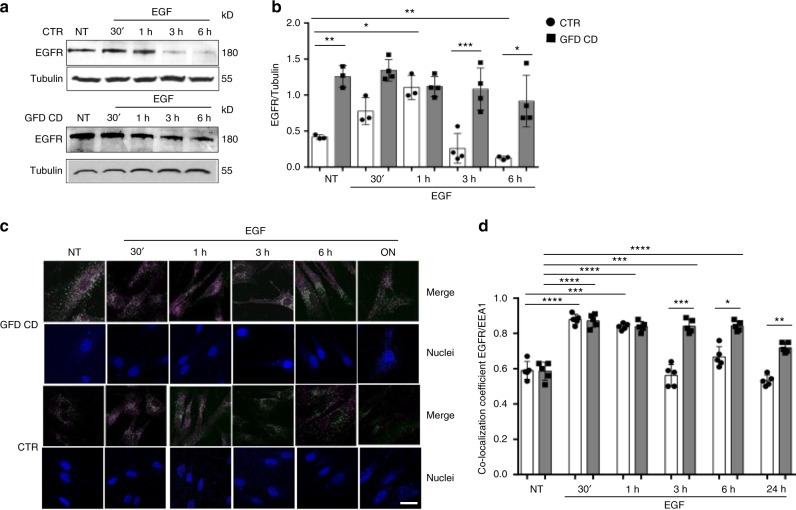
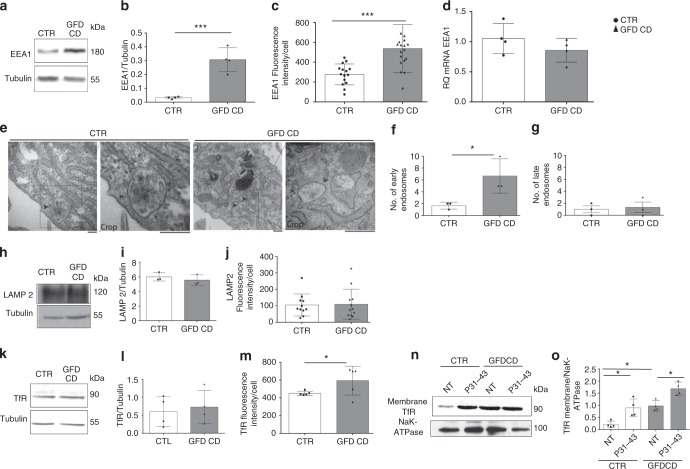
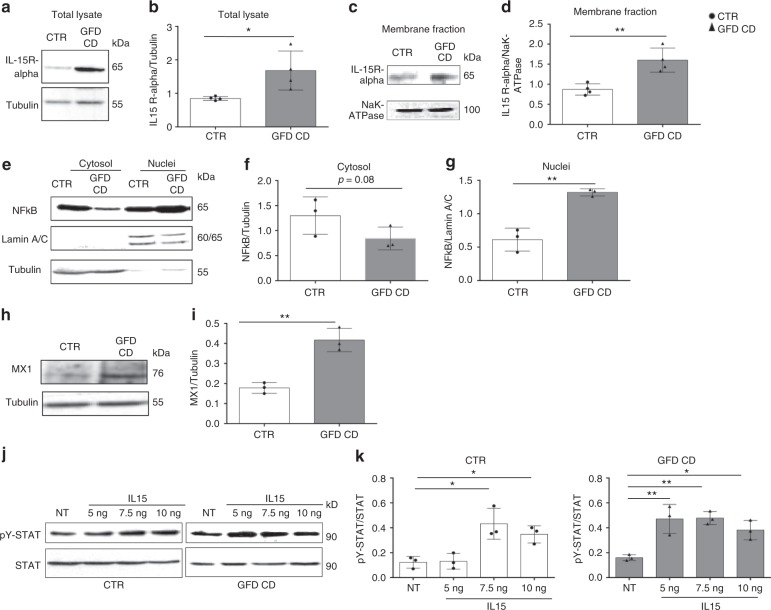
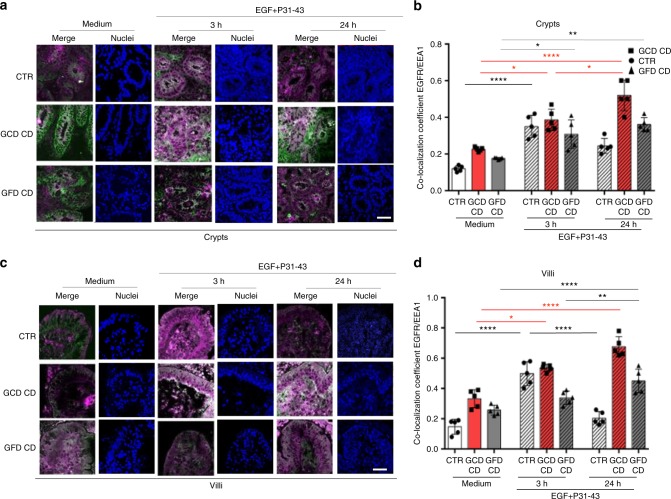
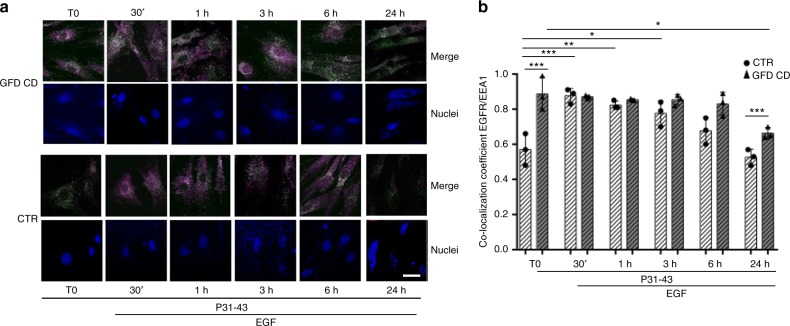
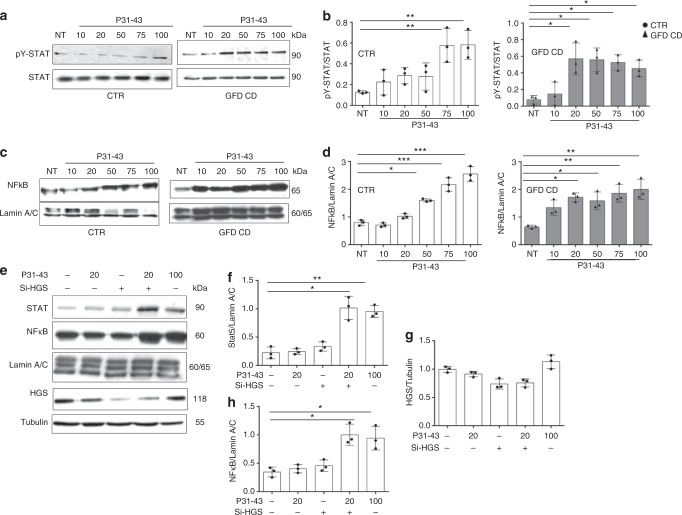
Celiac Disease (CD) is an autoimmune disease characterized by inflammation of the intestinal mucosa due to an immune response to wheat gliadins. Some gliadin peptides (e.g., A-gliadin P57-68) induce an adaptive Th1 pro-inflammatory response. Other gliadin peptides (e.g., A-gliadin P31-43) induce a stress/innate immune response involving interleukin 15 (IL15) and interferon α (IFN-α). In the present study, we describe a stressed/inflamed celiac cellular phenotype in enterocytes and fibroblasts probably due to an alteration in the early-recycling endosomal system. Celiac cells are more sensitive to the gliadin peptide P31-43 and IL15 than controls. This phenotype is reproduced in control cells by inducing a delay in early vesicular trafficking. This constitutive lesion might mediate the stress/innate immune response to gliadin, which can be one of the triggers of the gliadin-specific T-cell response.

Keywords: Coeliac disease; Endosomes.


Conflict of interest statement

Competing interestsThe authors declare no competing interests.

Figures

Fig. 1
Fig. 1
EGFR was localized more in the early vesicular compartment of enterocytes from patients with CD respect to controls. a Images of immunofluorescence staining for EGFR (magenta), EEA1 (green), and nuclei (blue) in crypts and villi of intestinal biopsies from patients with CD (GCD, gluten-containing diet; GFD, gluten-free diet) and controls (CTR). The white color in the merge panels indicates co-localization of EGFR and EEA1. Representative fields. Scale bar = 20 µm. b Statistical analysis of EGFR fluorescence intensity in selected epithelial areas. c Statistical analysis of the co-localization coefficients of EGFR with EEA1 staining. d Statistical analysis of fluorescence intensity of EEA1 staining in selected areas of crypt and villi enterocytes. One-way ANOVA Bonferroni corrected. *p < 0.05, **p < 0.01, ***p < 0.001
Fig. 2
Fig. 2
Levels of the EGFR, EEA1, LAMP, and TfR proteins in biopsies from patients with CD (GCD CD and GFD CD) and controls (CTR). Western blot (WB) of protein lysates and densitometry analysis of intestinal biopsies from several patients and controls, as indicated, blotted with anti-EGFR (a, b), anti-EEA1 (c, d), anti-LAMP2 (e, f), anti-TfR (g, h), and anti-MAPK1 antibodies used as a loading control. i Images of immunofluorescence staining for TfR in crypts in intestinal biopsies from patients with CD and controls. Representative fields. Scale bar = 20 µm. j Statistical analysis of fluorescence intensity of TfR-positive vesicles in crypts in selected epithelial areas. Samples from five patients and 5 controls were examined. Columns represent the means, and bars represent standard deviations; Student’s t-test, *p < 0.05, **p < 0.01, ***p < 0.001
Fig. 3
Fig. 3
EGFR was localized more in the early vesicular compartment of enterocytes from patients with CD respect to controls after culture of small intestinal biopsies with EGF. Biopsies from patients with CD and controls were cultured in the presence of EGF to monitor the degradation of the EGF/EGFR complex. a Images of immunofluorescence staining of crypts from biopsies of patients and controls cultured in medium alone (Medium) for 24 h or in the presence of EGF for 3 or 24 h. The white color in the merge panels indicates co-localization of EGFR (magenta) and EEA1 (green). Representative fields. Scale bar = 20 µm. b Statistical analysis of the co-localization coefficient of EGFR with EEA1 in crypts as indicated. c Images of immunofluorescence staining of villi from biopsies of patients and controls cultured in medium alone (medium) for 24 h or in the presence of EGF for 3 or 24 h. The white color in the merge panels indicates co-localization of EGFR (magenta) and EEA1 (green). Representative fields. Scale bar = 20 µm. d Statistical analysis of the co-localization coefficient of EGFR with EEA1 in villi as indicated. In all experiments, five subjects in each group of patients, GCD CD, GFD CD and CTR, were examined. Three independent experiments were performed on samples from each group. Columns represent the means and bars represent standard deviations. One-way ANOVA Bonferroni corrected. *p < 0.05, **p < 0.01, ***p < 0.001
Fig. 4
Fig. 4
In CD skin fibroblasts EGFR was delayed in the early vesicular compartment. Levels of the EGFR protein and co-localization of EGFR/EEA1 in CD fibroblasts compared to control fibroblasts both before treatment (NT) and after EGF treatment at the indicated times. a WBs of protein lysates from NT fibroblasts and cells treated with EGF for 30′, 1, 3, or 6 h blotted with anti-EGFR and anti-tubulin antibodies, as loading control. Representative blots. b Densitometry analysis. One-way ANOVA Bonferroni corrected. *p < 0.05, **p < 0.01, ***p < 0.001. c Images of immunofluorescence staining. The white color in the merge panels indicates co-localization of EGFR (magenta) and EEA1 (green) and nuclei are blue. Representative fields. Scale bar = 20 µm. d Statistical analysis of the co-localization coefficient of EGFR with EEA1 staining. Greater amount of EGFR co-localized with EEA1-positive vesicles in CD fibroblasts compared to controls at 3, 6, and 24 h after EGF treatment. In all experiments, samples from 5 patients and 5 controls were tested. Columns represent the means, and bars represent standard deviations. One-way ANOVA Bonferroni corrected. *p< 0.05, **p < 0.01, ***p < 0.001
Fig. 5
Fig. 5
Early, late, and recycling vesicular compartments in CD and CTR skin fibroblasts. a, b Levels of the EEA1 protein in CD and CTR fibroblasts. Representative WB (a) and densitometry analysis (b) of protein lysates from fibroblasts obtained from patients with CD and controls blotted with anti-EEA1 and anti-tubulin, as a loading control. c Statistical analysis of the fluorescence intensity of EEA1 staining/cell. d Quantitative PCR analysis of the EEA1 mRNA in CD fibroblasts compared to controls. Columns represent the means and bars represent the standard deviations of a representative experiment performed in triplicate. Similar results were obtained from 4 patients and 4 controls. eg Electron microscopy analysis of fibroblasts from controls and CD patients. Representative images and statistical analysis of fibroblasts from 3 patients and 3 controls. Arrows indicate early endosomes in controls and CD biopsies. Scale bars = 100 nm. h, i Levels of the LAMP2 protein in CD and CTR fibroblasts. Representative WB (h) and densitometry analysis (i) of protein lysates from fibroblasts obtained from patients with CD and controls blotted with anti-LAMP2 antibodies, and anti-tubulin antibodies, as a loading control. j Statistical analysis of fluorescence intensity of LAMP2 staining/cell. k, l Levels of the TfR protein in CD and CTR fibroblasts. Representative WB (k) and densitometry analysis (l) of protein lysates from fibroblasts obtained from patients with CD and controls blotted with anti-TfR antibodies, and anti-tubulin antibodies, as a loading control. m Statistical analysis of fluorescence intensity of TfR staining/cell. Samples from five patients and 5 controls were analyzed in all experiments, unless stated otherwise. Columns represent the means, and bars represent the standard deviations. Student’s t-test, *p < 0.05, ***p < 0.001. n, o TfR levels in the membrane fraction of CD fibroblasts compared with CTR samples with and without P31-43 treatment for 3 h. n WB analysis of proteins from membrane fractions of CTR and CD fibroblasts blotted with anti-TfR and NaK-ATPase antibodies. Representative blots. o Densitometry analysis of WB of samples from 4 patients and 4 controls. Columns represent the means, and bars represent the standard deviations. One-way ANOVA Bonferroni corrected. *p < 0.05
Fig. 6
Fig. 6
Levels of the innate immunity markers IL15R-α and MX1 and the inflammation marker nuclear NFκB are increased in CD skin fibroblasts. a, b Levels of IL15R-α in the total lysates. WB analysis of proteins from total lysates of CTR and CD fibroblasts blotted with anti-IL15R-α and anti-tubulin antibodies, as indicated. Representative blots (a) and densitometry analysis (b) of WBs of samples from 4 patients and 4 controls. c, d Levels of IL15R-α in the membrane fractions. WB analysis of proteins from membrane fractions of CTR and CD fibroblasts blotted with anti-IL15R-α and anti-NaK-ATPase antibodies, as indicated. Representative blots (c) and densitometry analysis (d) of WBs of samples from 4 patients and 4 controls. eg WB analysis of protein lysates from the nuclei and cytosol of CTR and CD fibroblasts blotted with anti-NFκB, anti-lamin A/C (nuclei loading control), and anti-tubulin (cytosol loading control) antibodies, as indicated. Representative blots (e) and densitometry analysis (f, g) of WBs of samples from 3 patients and 3 controls. h WB analysis of proteins from total lysates from CTR and CD fibroblasts blotted with anti-MX1 and anti-tubulin antibodies, as indicated. Representative blots. i Densitometry analysis of WBs of samples from 3 patients and 3 controls. Student’s t-test compared to the control (CTR) sample, *p < 0.05, **p < 0.01, ***p < 0.001. j, k Dose response curve of STAT 5 phosphorylation in response to treatment with increasing IL15 concentrations (5, 7.5, or 10 ng/ml) for 30 min. j WB analysis of proteins from total lysates of CTR and CD fibroblasts blotted with anti-STAT 5 and anti-pY STAT 5 antibodies, as indicated. Representative blots. k Densitometry analysis of WBs of samples from 3 patients and 3 controls. Columns represent the means and bars represent standard deviations. One-way ANOVA Bonferroni corrected. *p < 0.05, **p < 0.01
Fig. 7
Fig. 7
Treatment with P31-43 induced in enterocytes a transient delay of the EGF/EGFR trafficking in controls and a prolonged delay in CD patients. EGF/EGFR trafficking after P31-43 in controls and CD biopsies. a Images of immunofluorescence staining of crypts in biopsies from patients and controls that had been cultured in medium alone for 24 h (medium) or in the presence of EGF and P31-43 for 3 or 24 h. The white color in the merge panels indicates co-localization of EGFR (magenta) and EEA1 (green). Nuclei are in blue. Representative fields. Scale bar = 20 µm. b Statistical analysis of the co-localization coefficient of EGFR with EEA1. c Images of immunofluorescence staining of villi in biopsies from patients and controls that had been cultured in medium alone for 24 h (medium) or in the presence of EGF and P31-43 for 3 or 24 h. The white color in the merge panels indicates co-localization of EGFR (magenta) and EEA1 (green). Nuclei are in blue. Representative fields. Scale bar = 20 µm. d Statistical analysis of the co-localization coefficient of EGFR with EEA1. In all experiments, five subjects from each group of patients (GCD CD and GFD CD) and controls (CTR) were examined. Three independent experiments were performed on samples from each group. Columns represent the means, and bars represent standard deviations; hatched columns indicate P31-43 treatment. One-way ANOVA Bonferroni corrected. *p < 0.05, **p < 0.01, ***p < 0.001
Fig. 8
Fig. 8
Treatment with P31-43 induced in skin fibroblasts a transient delay of the EGF/EGFR trafficking in controls and a prolonged delay in CD patients. EGF/EGFR trafficking after P31-43 in control and CD fibroblasts. a Images of immunofluorescence staining for EGFR and EEA1 in skin fibroblasts from patients and controls treated with P31-43 for 10′ (T0) and then with both EGF and P31-43 for 30 min, 1, 3, 6, or 24 h. The white color in the merge panels indicates co-localization of EGFR (magenta) and EEA1 (green), nuclei are in blue. Representative fields. Scale bar = 20 µm. b Statistical analysis of the co-localization coefficient of EGFR with EEA1. In all experiments, samples from five subjects from each group of patients (GCD CD and GFD CD) and controls (CTR) were examined. Three independent experiments were performed using samples from each group. Columns represent the means, and bars represent standard deviations; hatched columns indicate P31-43 treatment. One-way ANOVA Bonferroni corrected. *p < 0.05, **p < 0.01, ***p < 0.001
Fig. 9
Fig. 9
Celiac fibroblasts and siHGS control fibroblasts were more sensitive to the P31-43 treatment than control cells. a, b Dose response curve of STAT 5 phosphorylation in response to treatment with increasing P31-43 concentrations (10, 20, 50, 75, or 100 µg/ml) for 30 min. a WB analysis of proteins from total lysates from CTR and CD fibroblasts blotted with anti-STAT 5 and anti-pY STAT 5 antibodies, as indicated. Representative blots. b Densitometry analysis of WBs of samples from 3 patients and 3 controls. Columns represent the means and bars represent standard deviations. c, d Dose response curve of nuclear NFκB in response to treatment with increasing P31-43 concentrations (10, 20, 50, 75, or 100 µg/ml) for 30 min. c WB analysis of proteins from nuclear fraction, from CTR and CD fibroblasts blotted with antibodies anti-NFκB and anti-lamin A/C, used as nuclear proteins loading control, as indicated. Representative blots. d Densitometry analysis of WBs of samples from 3 patients and 3 controls. Columns represent the means, and bars represent standard deviations. eh Cooperation of low doses of siHGS and P31-43 on STAT 5 and NFκB activation in control cells. STAT 5 and NFκB nuclear fraction in response to treatment with inactive (20 µg/ml) or active (100 µg/ml) doses of P31-43 in CTR fibroblasts before and after silencing HGS (25 ng siHGS). e WB analysis of proteins from cytosol fraction blotted with antibodies anti-HGS, anti-tubulin (citosol loading control), and of proteins from nuclear fraction blotted with antibodies anti-STAT 5 and anti-NFκB and anti-lamin A/C (nuclear loading control), as indicated. Representative blots are shown. fh Densitometry analysis of WBs of samples from 3 controls. Columns represent the means, and bars represent standard deviations. One-way ANOVA Bonferroni corrected. *p < 0.05, **p < 0.01, ***p < 0.001

References

    1. Sollid LM. Molecular basis of celiac disease. Ann. Rev. Immunol. 2000;18:53–81. doi: 10.1146/annurev.immunol.18.1.53. - DOI - PubMed
    1. Maiuri L, et al. Association between innate response to gliadin and activation of pathogenic T cells in celiac disease. Lancet. 2003;362:30–37. doi: 10.1016/S0140-6736(03)13803-2. - DOI - PubMed
    1. Zimmer KP, et al. Endocytotic segregation of gliadin peptide 31–49 in enterocytes. Gut. 2010;59:300–301. doi: 10.1136/gut.2008.169656. - DOI - PubMed
    1. Shan L, et al. Structural basis for gluten intolerance in celiac sprue. Science. 2002;297:2275–2279. doi: 10.1126/science.1074129. - DOI - PubMed
    1. Comino I, et al. Monitoring of gluten-free diet compliance in celiac patients by assessment of gliadin 33-mer equivalent epitopes in feces. Am. J. Clin. Nutr. 2012;95:670. doi: 10.3945/ajcn.111.026708. - DOI - PMC - PubMed

Publication types

MeSH terms