

Hybrid breeding of rice via genomic selection
- PMID: 31124256
- PMCID: PMC6920338
- DOI: 10.1111/pbi.13170
Hybrid breeding of rice via genomic selection
Abstract
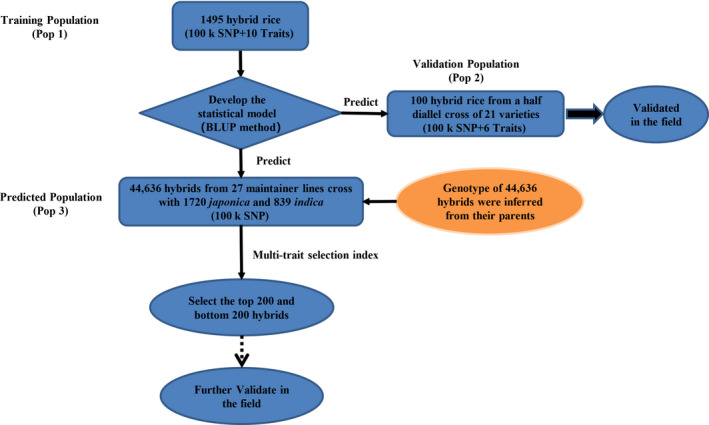
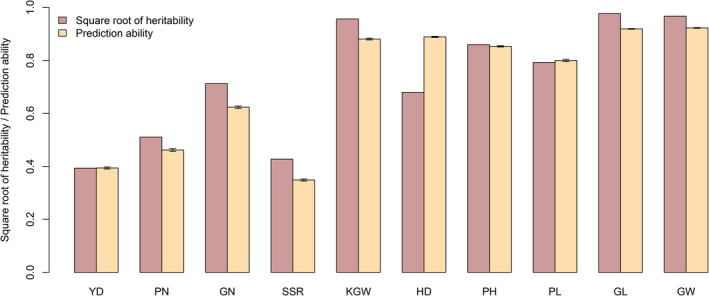
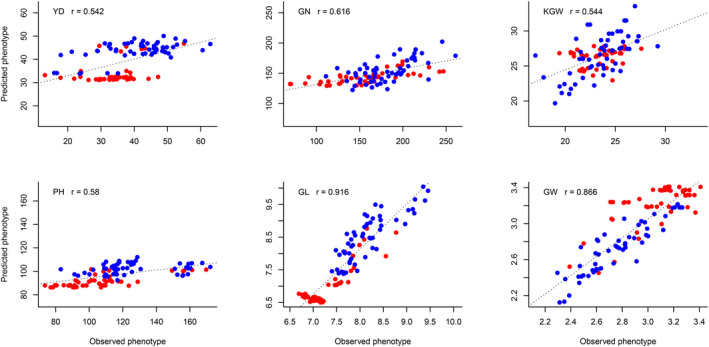
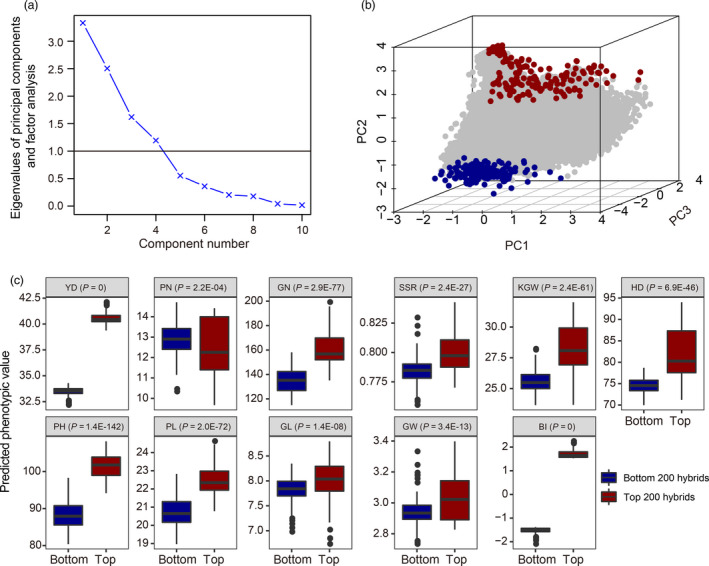
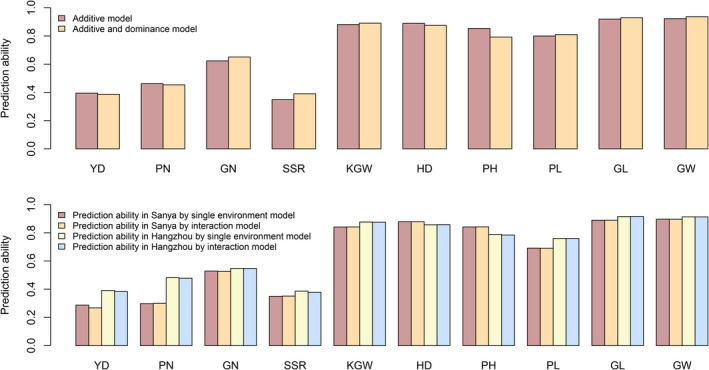
Hybrid breeding is the main strategy for improving productivity in many crops, especially in rice and maize. Genomic hybrid breeding is a technology that uses whole-genome markers to predict future hybrids. Predicted superior hybrids are then field evaluated and released as new hybrid cultivars after their superior performances are confirmed. This will increase the opportunity of selecting true superior hybrids with minimum costs. Here, we used genomic best linear unbiased prediction to perform hybrid performance prediction using an existing rice population of 1495 hybrids. Replicated 10-fold cross-validations showed that the prediction abilities on ten agronomic traits ranged from 0.35 to 0.92. Using the 1495 rice hybrids as a training sample, we predicted six agronomic traits of 100 hybrids derived from half diallel crosses involving 21 parents that are different from the parents of the hybrids in the training sample. The prediction abilities were relatively high, varying from 0.54 (yield) to 0.92 (grain length). We concluded that the current population of 1495 hybrids can be used to predict hybrids from seemingly unrelated parents. Eventually, we used this training population to predict all potential hybrids of cytoplasm male sterile lines from 3000 rice varieties from the 3K Rice Genome Project. Using a breeding index combining 10 traits, we identified the top and bottom 200 predicted hybrids. SNP genotypes of the training population and parameters estimated from this training population are available for general uses and further validation in genomic hybrid prediction of all potential hybrids generated from all varieties of rice.
Keywords: best linear unbiased prediction; cross-validation; cytoplasm male sterile system; genomic prediction; hybrid rice.
© 2019 The Authors. Plant Biotechnology Journal published by Society for Experimental Biology and The Association of Applied Biologists and John Wiley & Sons Ltd.
Conflict of interest statement
The authors declare no conflict of interest.
Figures
Similar articles
-
Predicting hybrid performance in rice using genomic best linear unbiased prediction.Proc Natl Acad Sci U S A. 2014 Aug 26;111(34):12456-61. doi: 10.1073/pnas.1413750111. Epub 2014 Aug 11. Proc Natl Acad Sci U S A. 2014. PMID: 25114224 Free PMC article.
-
Metabolic prediction of important agronomic traits in hybrid rice (Oryza sativa L.).Sci Rep. 2016 Feb 24;6:21732. doi: 10.1038/srep21732. Sci Rep. 2016. PMID: 26907211 Free PMC article.
-
Cytoplasmic and nuclear genome variations of rice hybrids and their parents inform the trajectory and strategy of hybrid rice breeding.Mol Plant. 2021 Dec 6;14(12):2056-2071. doi: 10.1016/j.molp.2021.08.007. Epub 2021 Aug 11. Mol Plant. 2021. PMID: 34390871
-
Progress in research and development on hybrid rice: a super-domesticate in China.Ann Bot. 2007 Nov;100(5):959-66. doi: 10.1093/aob/mcm121. Epub 2007 Aug 18. Ann Bot. 2007. PMID: 17704538 Free PMC article. Review.
-
Advances and Challenges in Genomic Selection for Disease Resistance.Annu Rev Phytopathol. 2016 Aug 4;54:79-98. doi: 10.1146/annurev-phyto-080615-100056. Annu Rev Phytopathol. 2016. PMID: 27491433 Review.
Cited by
-
Balancing selection and candidate loci for survival and growth during larval development in the Mediterranean mussel, Mytilus galloprovincialis.G3 (Bethesda). 2023 Jul 5;13(7):jkad103. doi: 10.1093/g3journal/jkad103. G3 (Bethesda). 2023. PMID: 37178422 Free PMC article.
-
Genome-wide association study and genomic prediction for yield and grain quality traits of hybrid rice.Mol Breed. 2022 Mar 18;42(4):16. doi: 10.1007/s11032-022-01289-6. eCollection 2022 Apr. Mol Breed. 2022. PMID: 37309463 Free PMC article.
-
Exploiting Genic Male Sterility in Rice: From Molecular Dissection to Breeding Applications.Front Plant Sci. 2021 Mar 2;12:629314. doi: 10.3389/fpls.2021.629314. eCollection 2021. Front Plant Sci. 2021. PMID: 33763090 Free PMC article. Review.
-
Production of grains with ultra-low heavy metal accumulation by pyramiding novel Alleles of OsNramp5 and OsLsi2 in two-line hybrid rice.Plant Biotechnol J. 2024 Oct;22(10):2921-2931. doi: 10.1111/pbi.14414. Epub 2024 Jun 19. Plant Biotechnol J. 2024. PMID: 38898780 Free PMC article.
-
High-quality genome assembly enables prediction of allele-specific gene expression in hybrid poplar.Plant Physiol. 2024 Apr 30;195(1):652-670. doi: 10.1093/plphys/kiae078. Plant Physiol. 2024. PMID: 38412470 Free PMC article.
References
-
- Akagi, H. , Nakamura, A. , Yokozeki‐Misono, Y. , Inagaki, A. , Takahashi, H. , Mori, K. and Fujimura, T. (2004) Positional cloning of the rice Rf‐1 gene, a restorer of BT‐type cytoplasmic male sterility that encodes a mitochondria‐targeting PPR protein. Theor. Appl. Genet. 108, 1449–1457. - PubMed
-
- Bernardo, R. (1996a) Best linear unbiased prediction of maize single‐cross performance. Crop Sci. 36, 50–56. - PubMed
-
- Bernardo, R. (1996b) Testcross additive and dominance effects in best linear unbiased prediction of maize single‐cross performance. Theor. Appl. Genet. 93, 1098–1102. - PubMed
-
- Bernardo, R. (2008) Molecular markers and selection for complex traits in plants: learning from the last 20 years. Crop Sci. 48, 1649–1664.
Publication types
MeSH terms
Grants and funding
LinkOut - more resources
Full Text Sources
