. 2020 Jan;26(1):76-89.
doi: 10.1111/cns.13154. Epub 2019 May 23.

Effect of Fasudil on remyelination following cuprizone-induced demyelination

Affiliations

Effect of Fasudil on remyelination following cuprizone-induced demyelination

Jing Wang et al. CNS Neurosci Ther. 2020 Jan.

Retraction in

Abstract

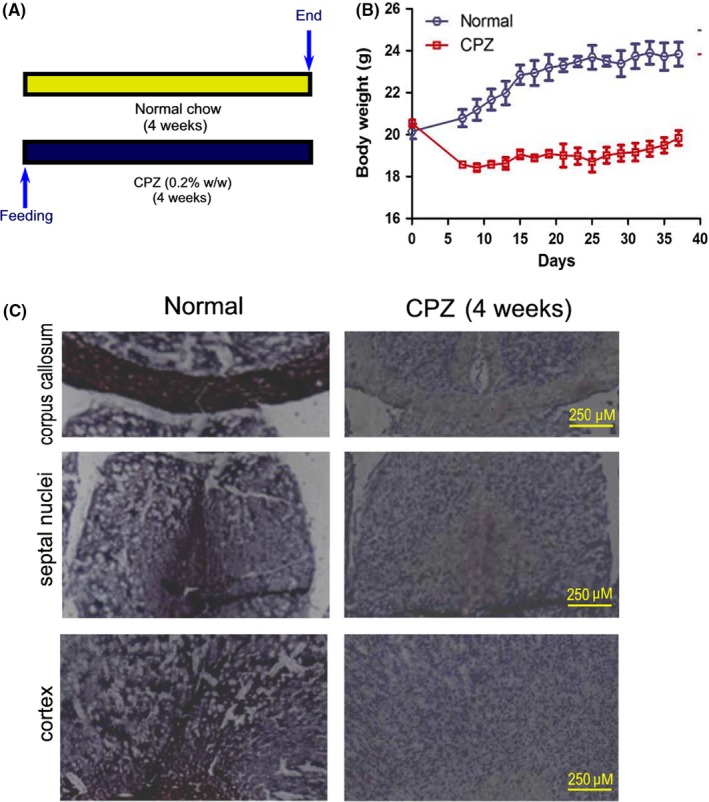
Background: Multiple sclerosis is characterized by demyelination/remyelination, neuroinflammation, and neurodegeneration. Cuprizone (CPZ)-induced toxic demyelination is an experimental animal model commonly used to study demyelination and remyelination in the central nervous system. Fasudil is one of the most thoroughly studied Rho kinase inhibitors.

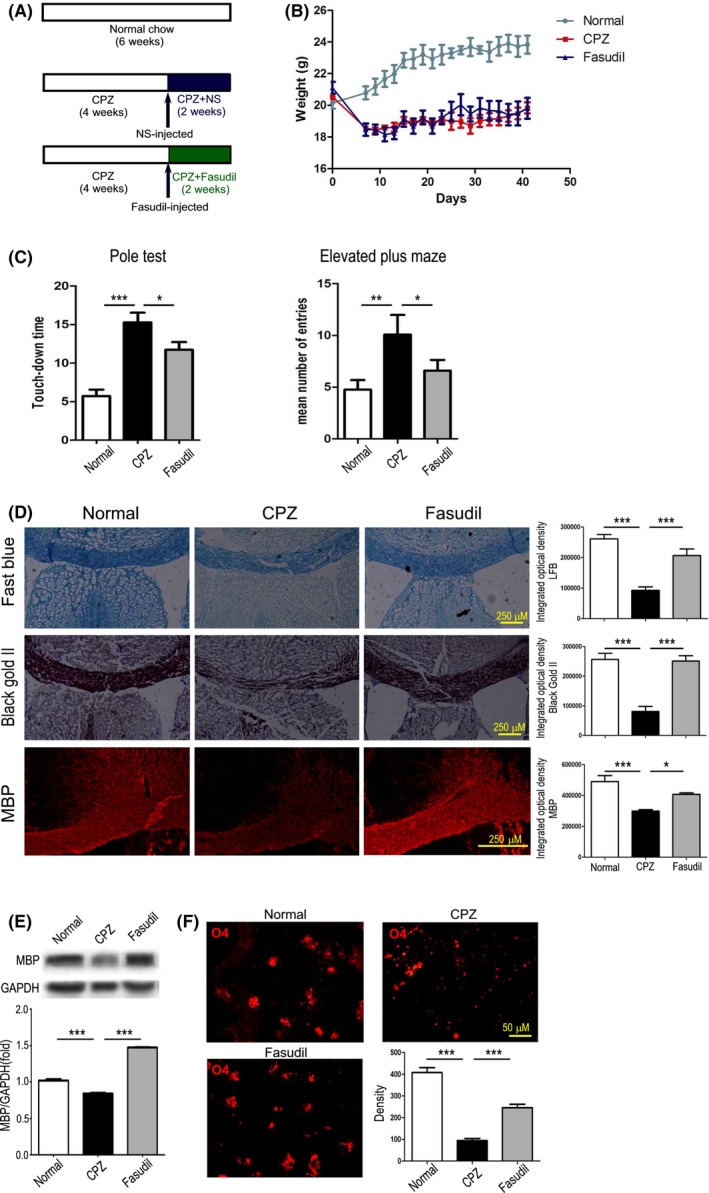
Methods: Following CPZ exposure, the degree of demyelination in the brain of male C57BL/6 mice was assessed by Luxol fast blue, Black Gold II, myelin basic protein immunofluorescent staining, and Western blot. The effect of Fasudil on behavioral change was determined using elevated plus maze test and pole test. The possible mechanisms of Fasudil action were examined by immunohistochemistry, flow cytometry, ELISA, and dot blot.

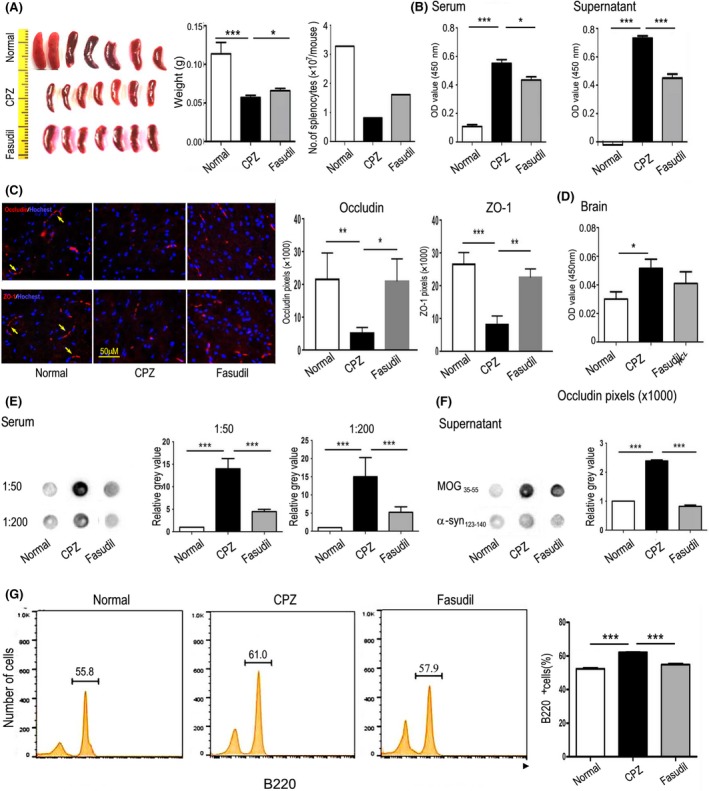
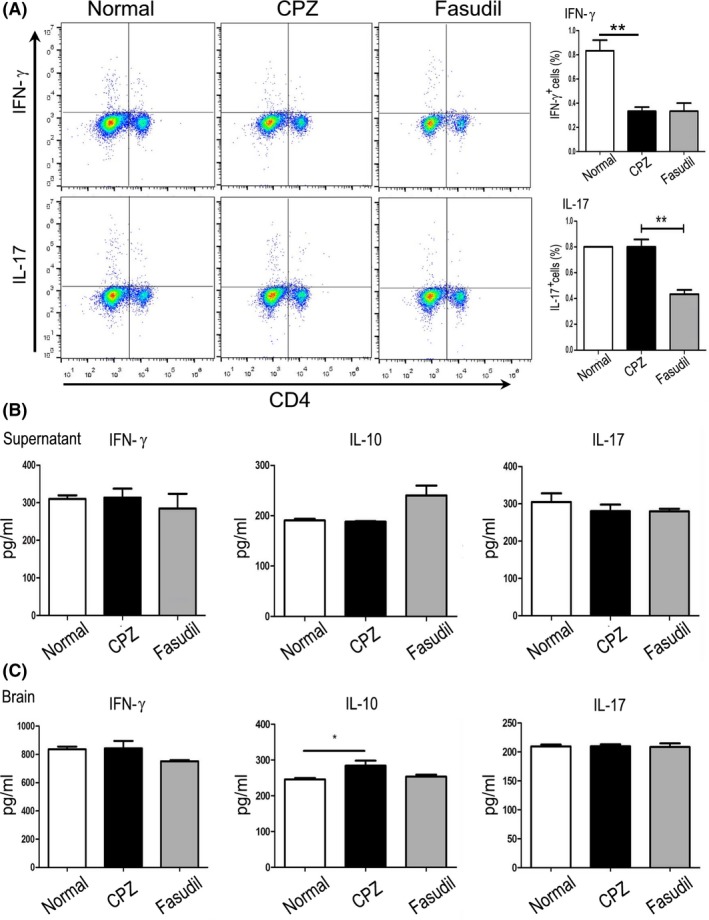
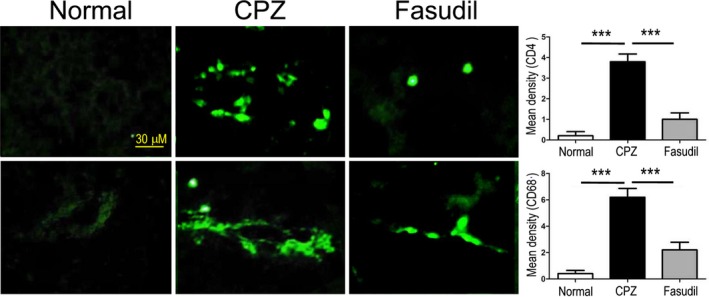
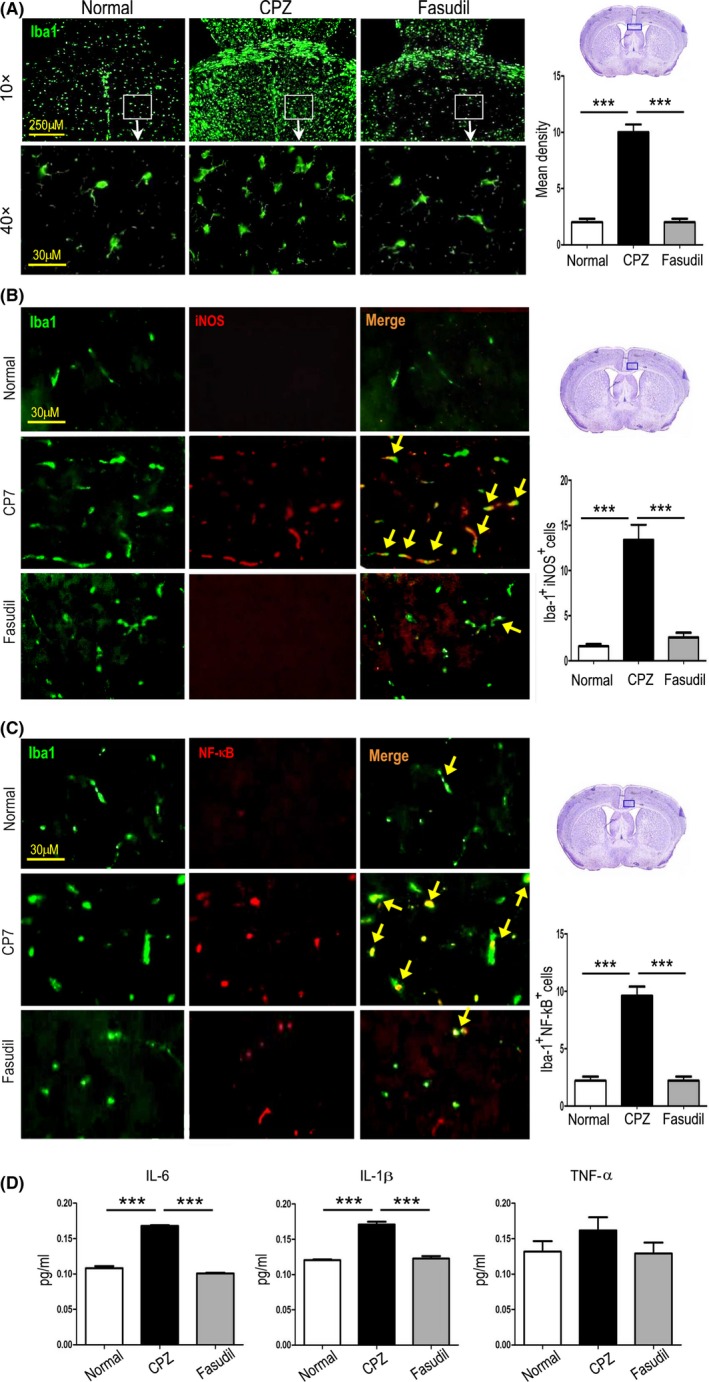
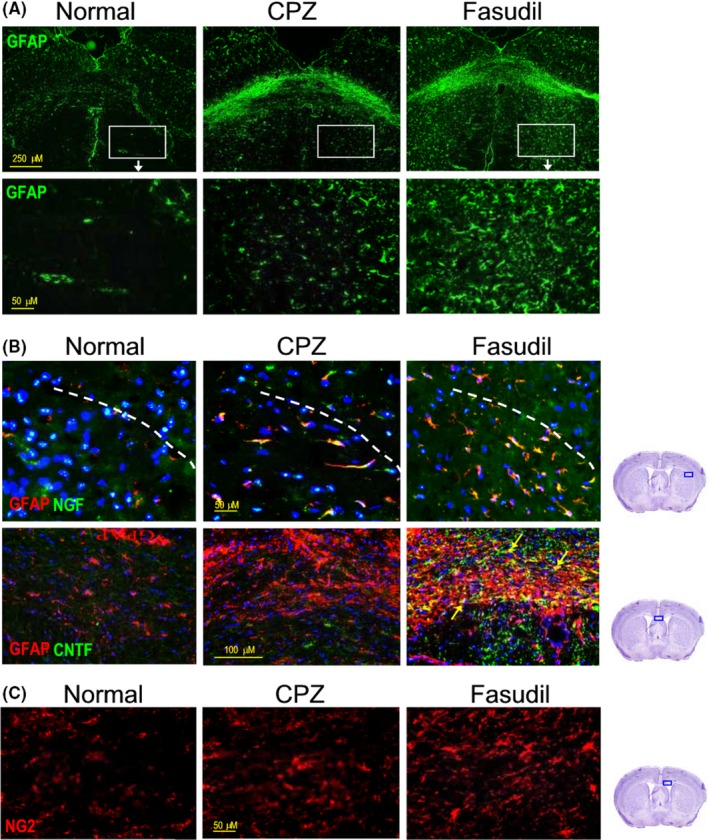
Results: Fasudil improved behavioral abnormalities, inhibited microglia-mediated neuroinflammation, and promoted astrocyte-derived nerve growth factor and ciliary neurotrophic factor, which should contribute to protection and regeneration of oligodendrocytes. In addition, Fasudil inhibited the production of myelin oligodendrocyte glycoprotein antibody and the infiltration of peripheral CD4+ T cells and CD68+ macrophages, which appears to be related to the integrity of the blood-brain barrier.

Conclusion: These results provide evidence for the therapeutic potential of Fasudil in CPZ-induced demyelination. However, how Fasudil acts on microglia, astrocytes, and immune cells remains to be further explored.

Keywords: Fasudil; Rho kinase; cuprizone-induced demyelination; remyelination.


Conflict of interest statement

The authors declare no financial or commercial conflict of interest.

Figures

Figure 1
Figure 1
Scheme of the experimental protocol and histopathology of myelin sheath before Fasudil treatment. Mice were fed with normal chow and diet supplemented with 0.2% (w/w) CPZ for 4 wk (n = 8). A, Scheme of the experimental protocol. B, Body weight of mice. C, After 4 wk of CPZ feeding, histological staining of myelin sheaths in the corpus callosum, septal nuclei, and cortex of the brain by Black Gold II. Mice appeared histological evidence of demyelination
Figure 2
Figure 2
Fasudil ameliorated the behavioral changes and promoted the myelin protection/regeneration. A, Scheme of the experimental protocol of Fasudil treatment. B, The change of body weight. C, The behavioral tests, left = pole test and right = elevated plus maze. D, Histological changes in the corpus callosum and cingulum of brain by Luxol fast blue, Black Gold II, and MBP. Scale bar = 250 μm. E, The expression of MBP in the extract of corpus callosum by western blot. F, O4+ Oligodendrocyte immunoreactivity in the striatum of brain by immunohistochemistry. Scale bar = 250 μm and 50 μm. Quantitative data are mean ± SEM and analyzed for four mice in each group. Photographs are representative maps of mice brain from different groups. *P < 0.05, **P < 0.01, ***P < 0.001
Figure 3
Figure 3
Fasudil inhibited MOG antibody and improved the integrity of BBB. A, Planar map of spleen size (middle). Left side = ruler and right = weight and number of splenocytes. B, The concentration of MOG antibody in serum and supernatants of cultured splenocytes by ELISA. C, Expression of occludin and ZO‐1 (yellow arrow) in the brain by immunohistochemistry. Scale bar = 50 μm. D, The concentration of MOG antibody in extract of brain by ELISA. E, The concentration of MOG antibody in serum (1:50 and 1:200) by dot blot. F, The specificity of the MOG antibody, with MOG35‐55 and α‐synuclein124‐140 for coating antigen by dot blot. G, The population of B220+ B cells in splenocytes by flow cytometry. Quantitative data are mean ± SEM and analyzed for four mice in each group. Photographs are representative maps of mice brain from different groups. *P < 0.05, **P < 0.01, ***P < 0.001
Figure 4
Figure 4
Fasudil basically did not affect the T cell responses. A, The population of CD4+IFN‐γ+ and CD4+IL‐17+ T cells in splenocytes by flow cytometry. B, The level of cytokine IFN‐γ, IL‐10, and IL‐17 in supernatant of cultured splenocytes by ELISA. C, The level of cytokine IFN‐γ, IL‐10, and IL‐17 in extract of brain by ELISA. Results are expressed as pg/mL. Quantitative data are mean ± SEM and analyzed for four mice in each group. *P < 0.05, **P < 0.01
Figure 5
Figure 5
Fasudil inhibited the infiltration of CD4+ T cells and CD68+ macrophages in the brain. CD4+ T cells and CD68+ macrophages were stained by immunohistochemistry and detected around the cerebrovascular. Scale bar = 50 μm. Quantitative data are mean ± SEM and analyzed for four mice in each group. Photographs are representative maps of mice brain from different groups. ***P < 0.001
Figure 6
Figure 6
Fasudil inhibited the microglia‐mediated neuroinflammation in the brain. A, Iba1+ microglia in the corpus callosum and striatum of brain by immunohistochemistry. Scale bar = 250 μm and 30 μm, respectively. B, Iba1+iNOS+ microglia (yellow arrow) in the striatum of brain by double immunofluorescent staining. Scale bar = 30 μm. C, Iba1+NF‐κB+ microglia (yellow arrow) in the striatum of brain by double immunofluorescent staining. Scale bar = 30 μm. D, The level of inflammatory cytokine IL‐1β, IL‐6, and TNF‐α in extract of brain by ELISA. Quantitative data are mean ± SEM and analyzed for four mice in each group. Photographs are representative maps of mice brain from different groups. ***P < 0.001
Figure 7
Figure 7
Fasudil induced the production of astrocyte‐derived NGF and CNTF in the brain. A, GFAP+ astrocytes in the corpus callosum and striatum of brain by immunohistochemistry. Scale bar = 250 μm and 50 μm respectively. B, GFAP+NGF+ astrocytes in the striatum of brain by double immunofluorescent staining. Scale bar = 50 μm. C, GFAP+CNTF+ astrocytes (yellow arrow) in the striatum of brain by double immunofluorescent staining. Scale bar = 100 μm. D, NG2+ oligodendrocytes in the striatum of brain by immunohistochemistry. Scale bar = 50 μm. Photographs are representative maps of mice brain from different groups

Similar articles

Cited by

References

    1. Bauer J, Rauschka H, Lassmann H. Inflammation in the nervous system: the human perspective. Glia. 2001;36(2):235‐243. - PubMed
    1. Benn T, Halfpenny C, Scolding N. Glial cells as targets for cytotoxic immune mediators. Glia. 2001;36(2):200‐211. - PubMed
    1. Mahurkar S, Suppiah V, O'Doherty C. Pharmacogenomics of interferon beta and glatiramer acetate response: a review of the literature. Autoimmun Rev. 2014;13(2):178‐186. - PubMed
    1. Roser AE, Tönges L, Lingor P. Modulation of microglial activity by rho‐kinase (ROCK) inhibition as therapeutic strategy in Parkinson's disease and amyotrophic lateral sclerosis. Front Aging Neurosci. 2017;9:94. - PMC - PubMed
    1. Koch JC, Tatenhorst L, Roser AE, Saal KA, Tonges L, Lingor P. ROCK inhibition in models of neurodegeneration and its potential for clinical translation. Pharmacol Ther. 2018;189:1‐21. - PubMed

Publication types