Review
. 2019 May;7(10):e14098.
doi: 10.14814/phy2.14098.

The maximal metabolic steady state: redefining the 'gold standard'

Affiliations
Review

The maximal metabolic steady state: redefining the 'gold standard'

Andrew M Jones et al. Physiol Rep. 2019 May.

Abstract

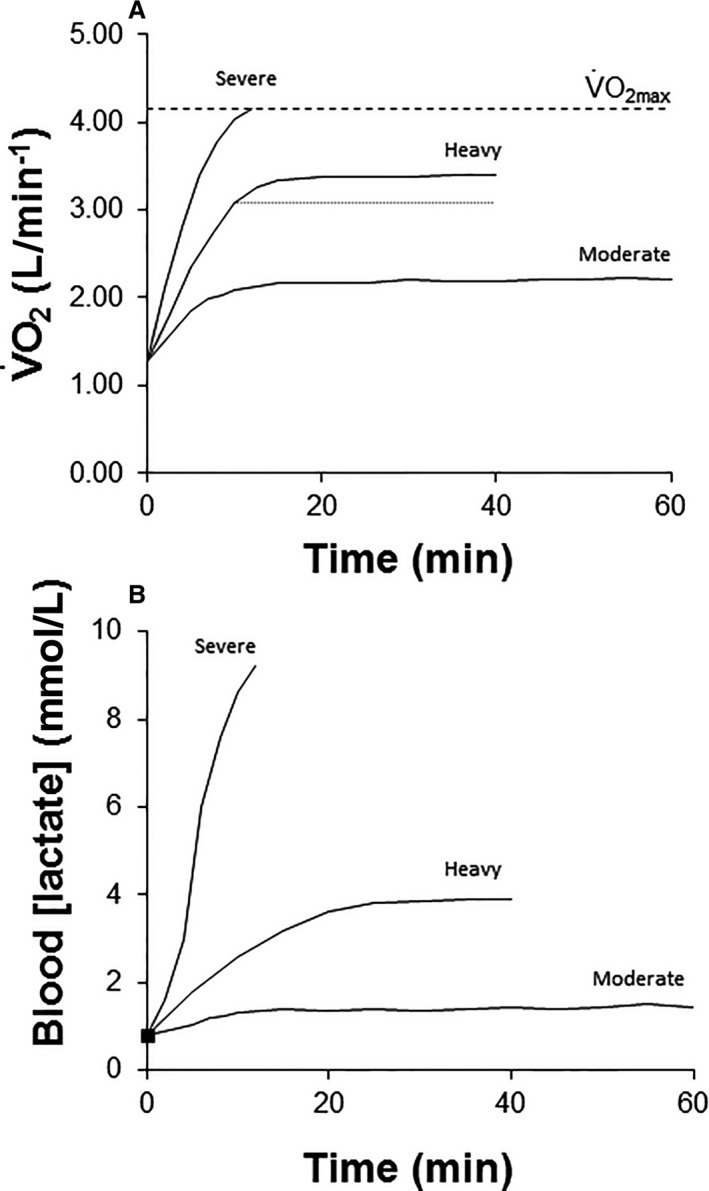
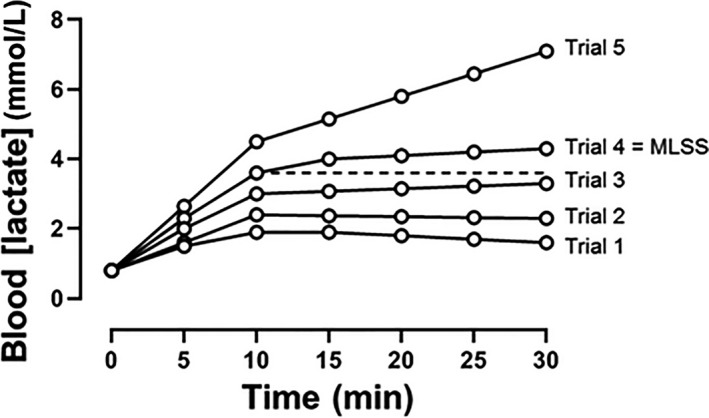
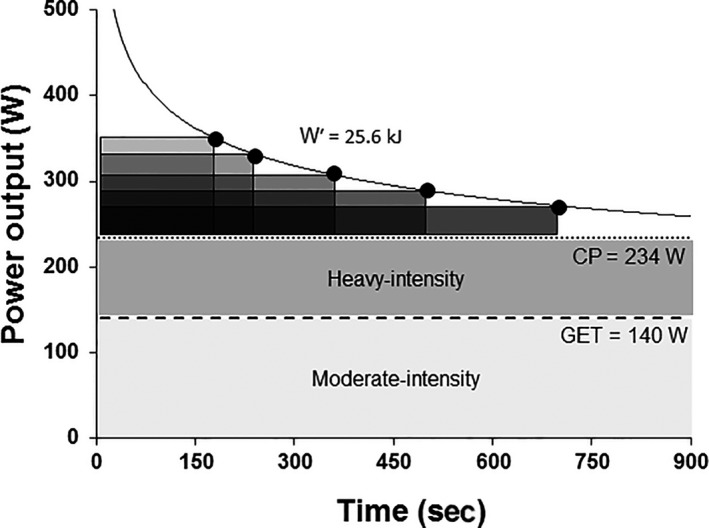
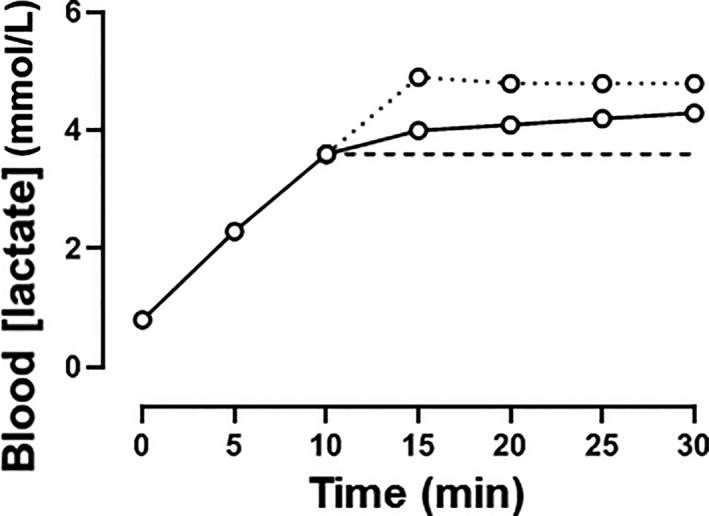
The maximal lactate steady state (MLSS) and the critical power (CP) are two widely used indices of the highest oxidative metabolic rate that can be sustained during continuous exercise and are often considered to be synonymous. However, while perhaps having similarities in principle, methodological differences in the assessment of these parameters typically result in MLSS occurring at a somewhat lower power output or running speed and exercise at CP being sustainable for no more than approximately 20-30 min. This has led to the view that CP overestimates the 'actual' maximal metabolic steady state and that MLSS should be considered the 'gold standard' metric for the evaluation of endurance exercise capacity. In this article we will present evidence consistent with the contrary conclusion: i.e., that (1) as presently defined, MLSS naturally underestimates the actual maximal metabolic steady state; and (2) CP alone represents the boundary between discrete exercise intensity domains within which the dynamic cardiorespiratory and muscle metabolic responses to exercise differ profoundly. While both MLSS and CP may have relevance for athletic training and performance, we urge that the distinction between the two concepts/metrics be better appreciated and that comparisons between MLSS and CP, undertaken in the mistaken belief that they are theoretically synonymous, is discontinued. CP represents the genuine boundary separating exercise in which physiological homeostasis can be maintained from exercise in which it cannot, and should be considered the gold standard when the goal is to determine the maximal metabolic steady state.

Keywords: Fatigue; metabolism; performance.


Conflict of interest statement

None declared.

Figures

Figure 1
Figure 1
Schematic representation of the pulmonary oxygen uptake (V˙O2) (panel A) and blood [lactate] responses (panel B) during moderate‐intensity, heavy‐intensity, and severe‐intensity exercise. During moderate‐intensity exercise, V˙O2 and blood [lactate] reach steady‐state values rapidly. During heavy‐ and severe‐intensity exercise, there is an additional oxygen cost (termed V˙O2 slow component) above that expected from the extrapolation of the moderate‐intensity V˙O2‐power output relationship. During heavy‐intensity exercise, the attainment of (higher amplitude) steady‐state values for V˙O2 and blood [lactate] is delayed. The magnitude of the V˙O2 slow component during heavy‐intensity exercise is illustrated by the dotted line provided in panel A. During severe‐intensity exercise, V˙O2 and blood [lactate] continue to rise until V˙O2max (panel A, dashed line) is attained with the limit of tolerance occurring shortly thereafter.
Figure 2
Figure 2
Schematic representation of the blood [lactate] response to a series of constant running speed tests performed on separate days for the determination of MLSS. Trial 1 is representative of the lowest running speed chosen and each trial is indicative of an increment in speed until trial 5 (the highest running speed applied). During trials 1, 2, 3, and 4, blood [lactate] does not increase by more than 1 mmol/L between minutes 10 and 30. However, during trial 5, blood [lactate] is 4.5 mmol/L at 10 min and 7.1 mmol/L at 30 min (Δ2.6 mmol/L). Therefore, in spite of a gradual increase (Δ0.7 mM) in blood [lactate] between minutes 10 and 30, trial 4 represents the highest running speed at which blood [lactate] did not rise by more than 1 mM ‐ and it would therefore be defined as MLSS. Note therefore that the actual MLSS, according to the accepted definition, lies at a speed somewhere between trial 4 and trial 5, such that the MLSS selected (trial 4) will necessarily be an underestimate. The dashed line is indicative of the blood [lactate] attained at 10 min during trial 4, and is projected to the end of the exercise trial.
Figure 3
Figure 3
Schematic representation of the power‐duration relationship with reference to the moderate‐intensity (light gray shaded area), and heavy‐intensity (dark gray shaded area) exercise intensity domains. The boundary between the moderate‐ and heavy‐intensity domains is given by the lactate or gas exchange threshold (GET), and the boundary between the heavy‐ and severe‐intensity domains is given by the critical power (CP). The CP and the work capacity available above CP (termed Wʹ) can be determined using a series of constant power output trials performed to the limit of tolerance within the severe‐intensity domain (i.e., >CP). The CP is defined as the power asymptote (234 W in this example), and Wʹ is characterized by the curvature constant (25.6 kJ in this example), of this hyperbolic relationship between power output and time. The Wʹ is capacity‐, but not rate‐, limited and therefore its contribution (in kJ) to severe‐intensity exercise is constant irrespective of exercise duration in the severe‐intensity domain. The greater the difference between the power output being sustained and CP, the more rapidly W′ will be utilized, with the limit of tolerance coinciding with the exhaustion of W′. The hyperbolic relationship between power and time can be linearized by plotting work done against time, in which case the slope of the line represents CP and the intercept represents W′, or power against 1/time, in which case the slope of the line represents W′ and the intercept represents CP.
Figure 4
Figure 4
The blood [lactate] response to a constant power output test indicative of MLSS (solid black line) versus a blood [lactate] response which would be, according to the strict definition of MLSS which considers only the absolute blood [lactate] values at 10 and 30 min, defined as being above MLSS (dotted line). Note, however, that despite being supposedly above MLSS (dotted line), blood [lactate] stabilized between 15 and 30 min. This highlights one of the potential sources of error in defining MLSS from just two data points and applying a rather arbitrary tolerance limit (Δ1.0 mmol/L) for the increase in blood [lactate] between them.
Figure 5
Figure 5
Panel A shows the hyperbolic running speed–time relationship plotted for the current (as of March 2019) world records from 1500 m to 5000 m (in blue, records held by different athletes) and the personal best times over the same distances run by an individual elite distance runner (Eliud Kipchoge, EK, in red). Panel B shows that the hyperbolic curve constructed for the world records from 1500 m to 5000 m (in blue, same data as in Panel A) does not provide a good fit to world record performances over shorter (100 m to 800 m) or longer (10,000 m to the marathon) distances. Thus, the hyperbolic relationship is valid for events which take between ~2 min and perhaps 15–20 min to complete. The linear transformation of the hyperbolic relationship is shown in Panel C (distance–time plot where the slope of the linear regression line gives critical speed, CS, and the intercept gives the curvature constant, D′) and Panel D (speed‐1/time plot where the slope gives D′ and the intercept gives CS). The CS and D′ estimates from the three equations, with the associated standard errors of the estimate, are shown at the foot of the figure.
Figure 6
Figure 6
Mean ± SD muscle blood flow (panel A; Copp et al. 2010), muscle metabolic perturbation (pH, panel B; lactate, panel C; Black et al. 2017), and the rates of change in muscle [PCr] (panel D; Black et al. 2017), neuromuscular excitability (panel E; Burnley et al. 2012), and pulmonary V˙O2 (panel F; Black et al. 2017) following moderate‐intensity (triangles), heavy‐intensity (squares), and severe‐intensity (circles) exercise. The dotted vertical line indicates CP, and a line of best fit has been drawn for all trials performed below CP (i.e., moderate‐ and heavy‐intensity exercise; dashed line). Note the disproportionate changes in all variables during severe‐intensity exercise (i.e., above CP) relative to exercise performed below CP. These data delineate CP as a bioenergetic threshold above which fatigue development is expedited and muscle and systemic homeostasis is precluded.
Figure 7
Figure 7
Participants performing severe‐intensity exercise attain the same “critical” muscle metabolic milieu ([PCr] panel A; pH panel B; [lactate] panel C); have similar blood [lactate] values (panel D); experience equivalent decrements in neuromuscular excitability (panel E); and achieve pulmonary V˙O2max (panel F), at the limit of tolerance irrespective of task duration. These responses are observed following cycling (black bars, Black et al. 2017) and knee‐extension exercise performed in normoxia (white bars, Burnley et al. 2012; light gray bars, Vanhatalo et al. 2010) and hyperoxia (70% O2, dark gray bars, Vanhatalo et al. 2010). Group mean ± SD values are displayed. Panel F, solid line indicates V˙O2max determined from ramp incremental test. S1 = severe‐intensity exercise bout 1, et seq.

Comment in

References

    1. Barker, T. , Poole D. C., Noble M. L., and Barstow T. J.. 2006. Human critical power‐oxygen uptake relationship at different pedalling frequencies. Exp. Physiol. 91:621–632. - PubMed
    1. Barker, A. R. , Bond B., Toman C., Williams C. A., and Armstrong N.. 2012. Critical power in adolescents: physiological bases and assessment using all‐out exercise. Eur. J. Appl. Physiol. 112:1359–1370. - PubMed
    1. Beneke, R. 1995. Anaerobic threshold, individual anaerobic threshold, and maximal lactate steady state in rowing. Med. Sci. Sports Exerc. 27:863–867. - PubMed
    1. Beneke, R. 2003. Methodological aspects of maximal lactate steady state‐implications for performance testing. Eur. J. Appl. Physiol. 89:95–99. - PubMed
    1. Beneke, R. , and von Duvillard S. P.. 1996. Determination of maximal lactate steady state response in selected sports events. Med. Sci. Sports Exerc. 28:241–246. - PubMed

LinkOut - more resources