. 2019 Jun 18;58(24):2730-2739.
doi: 10.1021/acs.biochem.9b00096. Epub 2019 Jun 4.

Non-Additive Effects of Binding Site Mutations in Calmodulin

Affiliations

Non-Additive Effects of Binding Site Mutations in Calmodulin

Sean C Edington et al. Biochemistry. .

Abstract

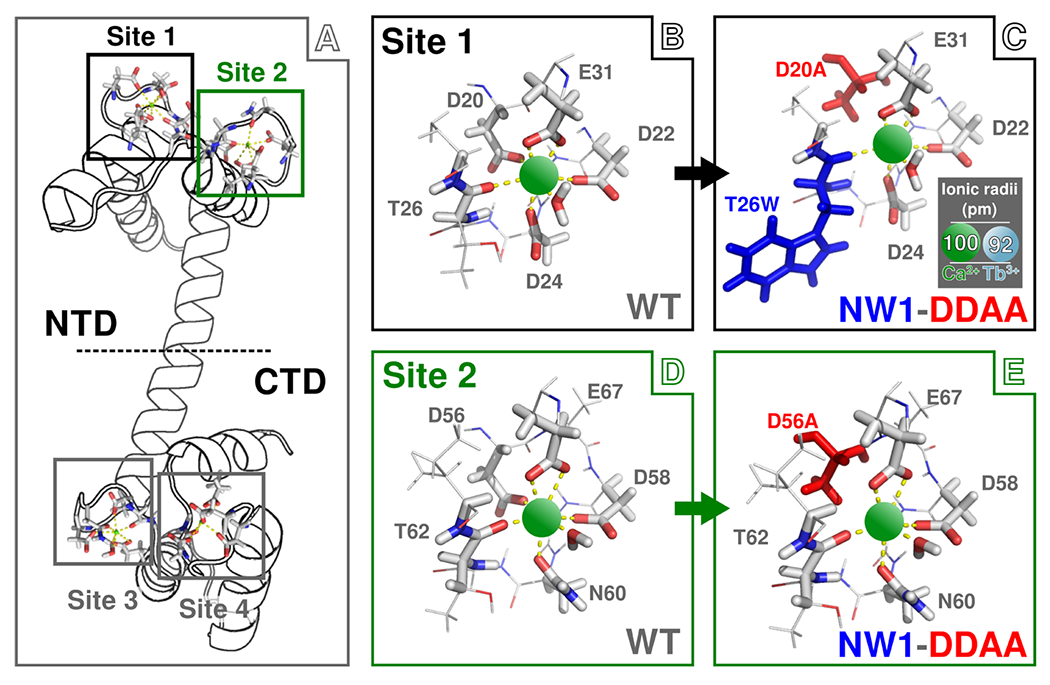
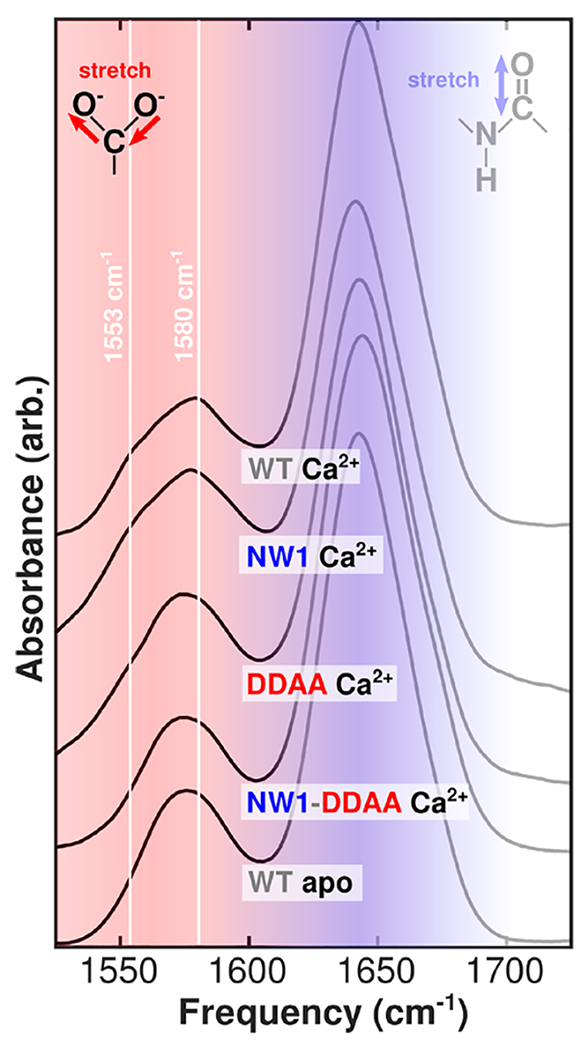
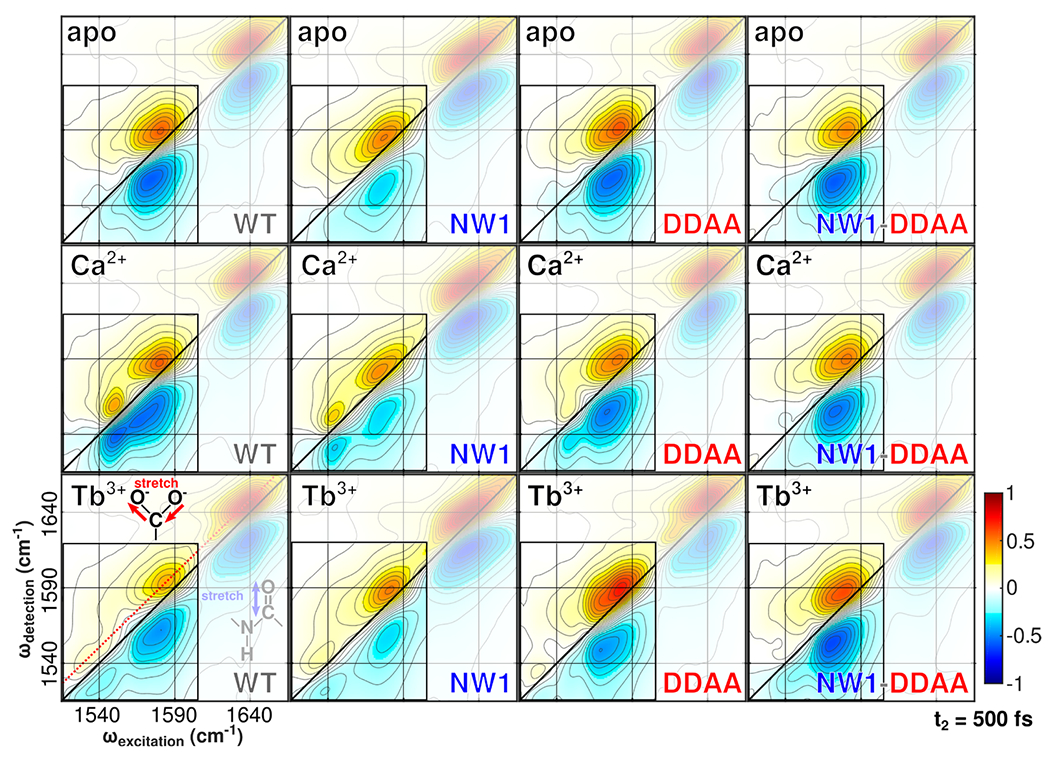
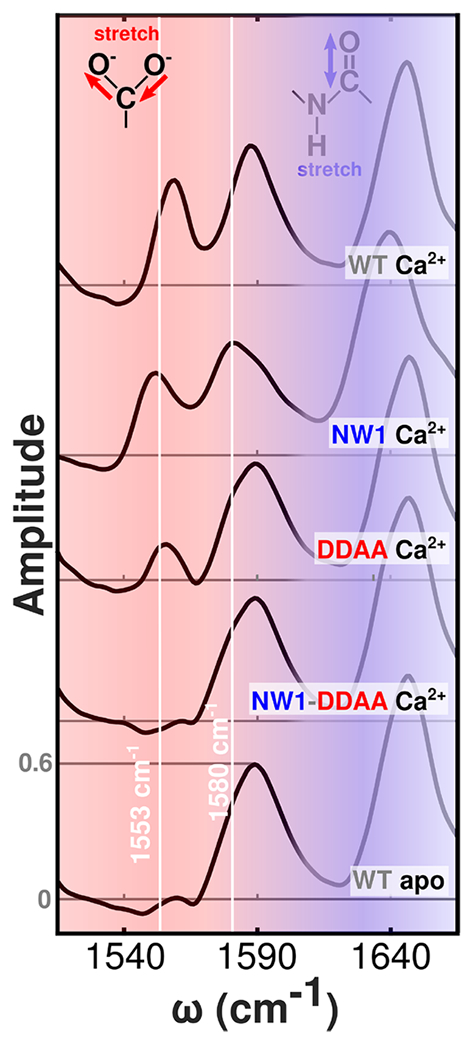
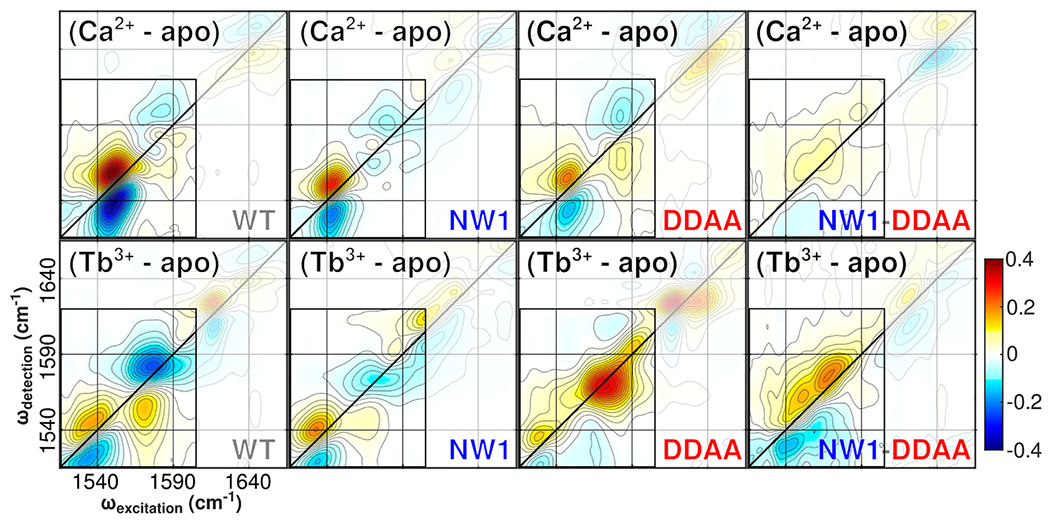
Despite decades of research on ion-sensing proteins, gaps persist in the understanding of ion binding affinity and selectivity even in well-studied proteins such as calmodulin. Site-directed mutagenesis is a powerful and popular tool for addressing outstanding questions about biological ion binding and is employed to selectively deactivate binding sites and insert chromophores at advantageous positions within ion binding structures. However, even apparently nonperturbative mutations can distort the binding dynamics they are employed to measure. We use Fourier transform infrared (FTIR) and ultrafast two-dimensional infrared (2D IR) spectroscopy of the carboxylate asymmetric stretching mode in calmodulin as a mutation- and label-independent probe of the conformational perturbations induced in calmodulin's binding sites by two classes of mutation, tryptophan insertion and carboxylate side-chain deletion, commonly used to study ion binding in proteins. Our results show that these mutations not only affect ion binding but also induce changes in calmodulin's conformational landscape along coordinates not probed by vibrational spectroscopy, remaining invisible without additional perturbation of binding site structure. Comparison of FTIR line shapes with 2D IR diagonal slices provides a clear example of how nonlinear spectroscopy produces well-resolved line shapes, refining otherwise featureless spectral envelopes into more informative vibrational spectra of proteins.


Conflict of interest statement

The authors declare no competing financial interest.

Figures

Figure 1.
Figure 1.
Schematic representation of the wild-type (WT) and mutant N-CaMs used in this study bound to Ca2+. (A) Structure of full-length WT CaM. Binding site (BS) locations are highlighted by black (BS 1), green (BS 2), and gray (BS 3 and BS 4) boxes. For this work, we use only the sequence of N-terminal domain (NTD) CaM, which contains BS 1 and BS 2 and appears above the dashed horizontal line. (B) Structure of WT BS 1. Ca2+ ions are shown as green spheres connected by yellow dashed lines to carboxylate and carbonyl groups responsible for coordination within the binding site. (C) Structure of BS 1 with both NW1 (colored blue) and DDAA (colored red) mutations. (D) Structure of WT BS 2. (E) Structure of BS 2 with both the NW1 and DDAA mutations. Note that the NW1 mutation affects only BS 1; thus, BS 2 of the NW1 mutant is the same as WT. The DDAA mutant involves mutation of both aspartate 20 in BS 1 and aspartate 56 in BS 2 to alanine; thus, the DDAA mutant involves aspartate-to-alanine mutations in both BS but no insertion of tryptophan in either site. The NW1-DDAA mutant combines both the NW1 and DDAA mutations. The inset in panel C shows the relative sizes of the Ca2+ and Tb3+ to scale with the BS structure. Note that these structures are shown only for illustration of point mutation; actual binding site structures differ and are both sequence-and ion-dependent.
Figure 2.
Figure 2.
Selected FTIR spectra of N-CaM bound to Ca2+ and Tb3+. Spectra for all structures are included in Figure S1, and corresponding second-derivative spectra are included in Figure S2. Solid white lines highlight peaks corresponding to different modes of carboxylate ion coordination in Ca2+-N-CaM. The bidentate glutamate peak is visible in the Ca2+-bound spectrum at 1553 cm−1, while the monodentate peak is visible at 1580 cm−1. Large, broad absorptions around 1640 cm−1 (shaded blue) are amide I modes in the protein backbone, which report on global structure. The carboxylate region centered around 1575 cm−1 (shaded red) reports on local structure in the ion binding sites and is highlighted as the focus of our study.
Figure 3.
Figure 3.
2D IR spectra of WT and mutant N-CaM bound to Ca2+ and Tb3+ taken with a pump–probe delay time (t2) of 500 fs. The dashed red line in the bottom left panel highlights the location of the diagonal slices shown in Figure 4. The bidentate glutamate peak is visible in the Ca2+-bound spectrum near 1553 cm−1, while the monodentate peak is visible near 1580 cm−1. Absorptions around 1640 cm−1 are amide I modes in the protein backbone. The carboxylate region centered around 1575 cm−1 is highlighted as the focus of our study and reports on local structure in the binding sites. The amide I region contains information about protein secondary structure but is not interpreted in this work. Intensities are normalized to the strongest feature in each spectrum, which is the amide I peak in all cases.
Figure 4.
Figure 4.
Selected 2D IR diagonal slices of WT and mutant N-CaM bound to Ca2+ and Tb3+. These slices are extracted from the 2D IR data shown in Figure 3. The complete set of slices is included in Figure S3. To facilitate comparison with FTIR spectra, shading, frequency guide lines, and ordering of spectra are the same as in Figure 2. Note that the frequency axis is narrower than in Figure 2 due to the frequency range of the 2D IR measurements.
Figure 5.
Figure 5.
2D IR difference spectra extracted from the 2D IR data shown in Figure 3. Difference spectra are calculated by subtracting the apo spectrum from the Ca2+ and Tb3+ spectra for each mutant. The difference spectra thus highlight the specific spectral signatures of Ca2+ and Tb3+ binding relative to the unbound protein. Note that the color scale covers a narrower range than in Figure 3 to highlight weaker features.

References

    1. Forsen S, and Lindman B (1981) In Ion binding in biological systems as studied by NMR spectroscopy (Glick D, Ed.) Chapter 5, pp 289–486, John Wiley & Sons. - PubMed
    1. Petukh M, and Alexov E (2014) Ion binding to biological macromolecules. Asian J. Phys 23, 735. - PMC - PubMed
    1. Roux B, Allen T, Berneche S, and Im W (2004) Theoretical and computational models of biological ion channels. Q. Rev. Biophys 37, 15–103. - PubMed
    1. Middendorf TR, and Aldrich RW (2017) Structural identifiability of equilibrium ligand-binding parameters. J. Gen. Physiol 149, 105–119. - PMC - PubMed
    1. Kilhoffer MC, Kubina M, Travers F, and Haiech J (1992) Use of engineered proteins with internal tryptophan reporter groups and perturbation techniques to probe the mechanism of ligand-protein interactions: investigation of the mechanism of calcium binding to calmodulin. Biochemistry 31, 8098–8106. - PubMed

Publication types