. 2019 May 24:8:e41769.
doi: 10.7554/eLife.41769.

Live-cell imaging reveals enhancer-dependent Sox2 transcription in the absence of enhancer proximity

Affiliations

Live-cell imaging reveals enhancer-dependent Sox2 transcription in the absence of enhancer proximity

Jeffrey M Alexander et al. Elife. .

Abstract

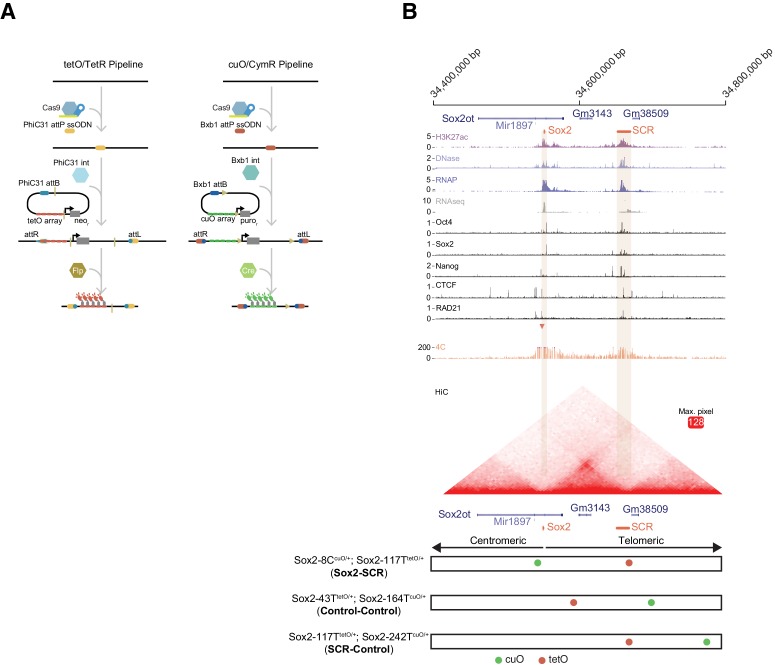
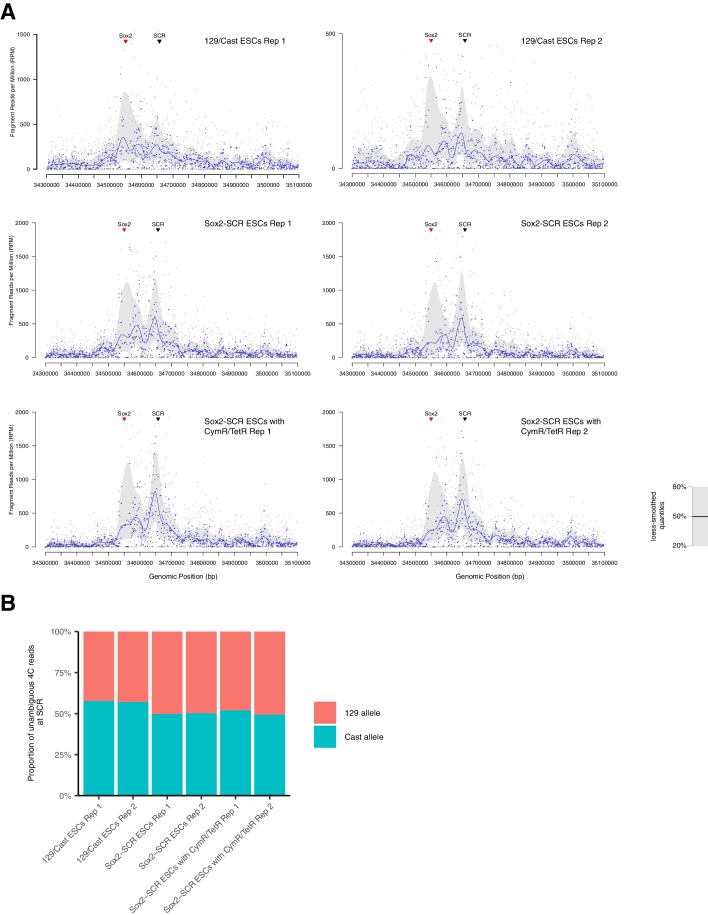
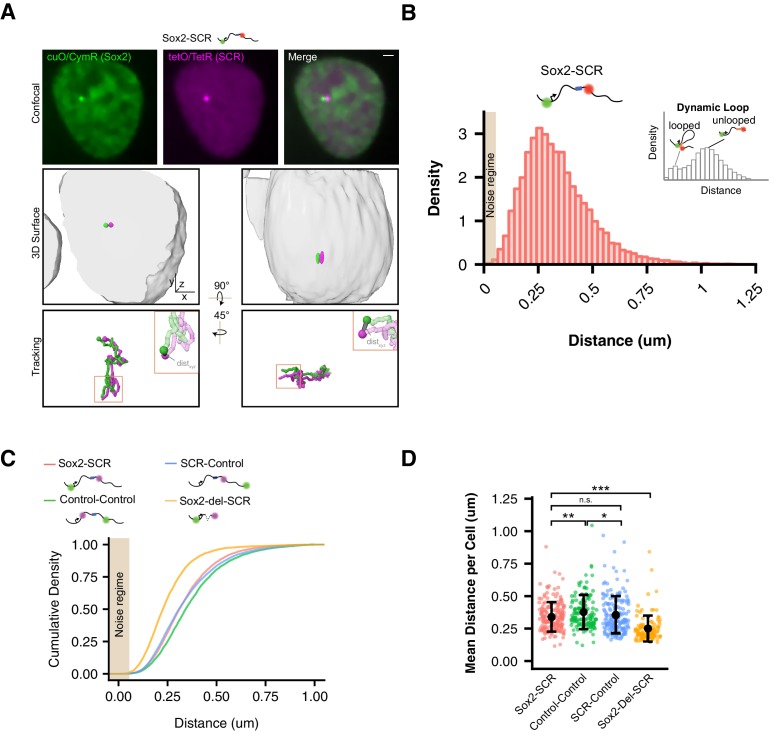
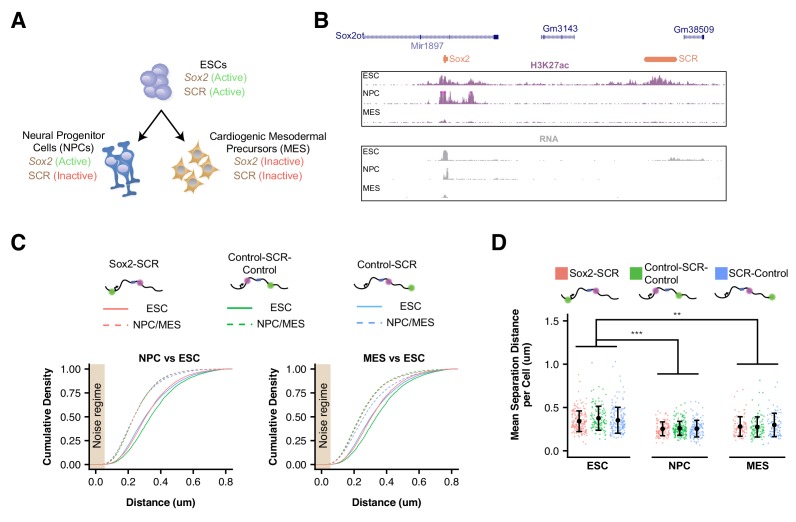
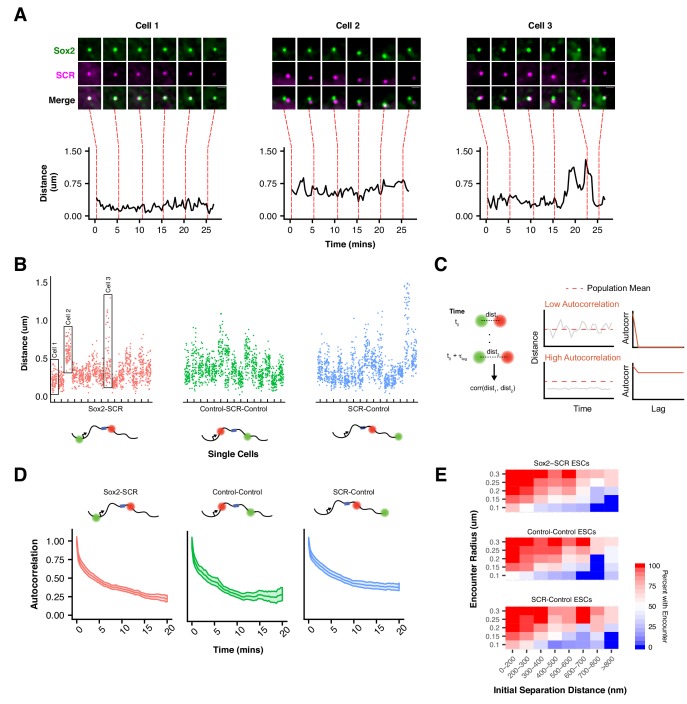
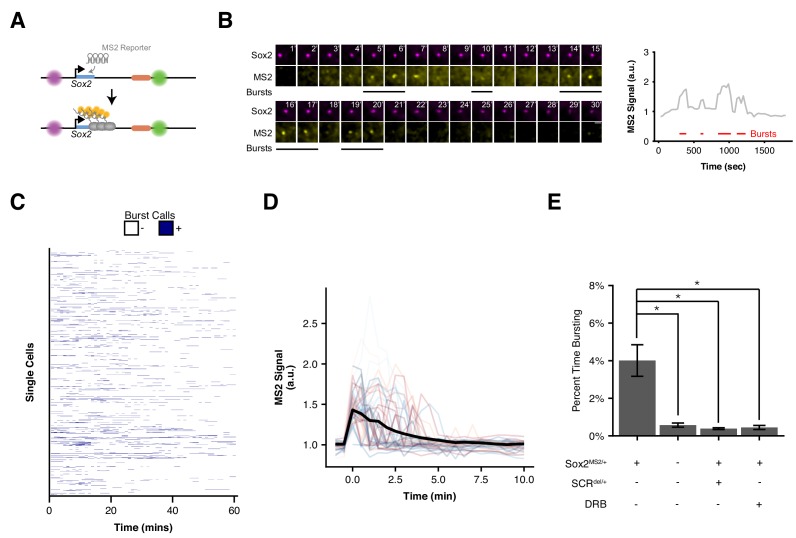
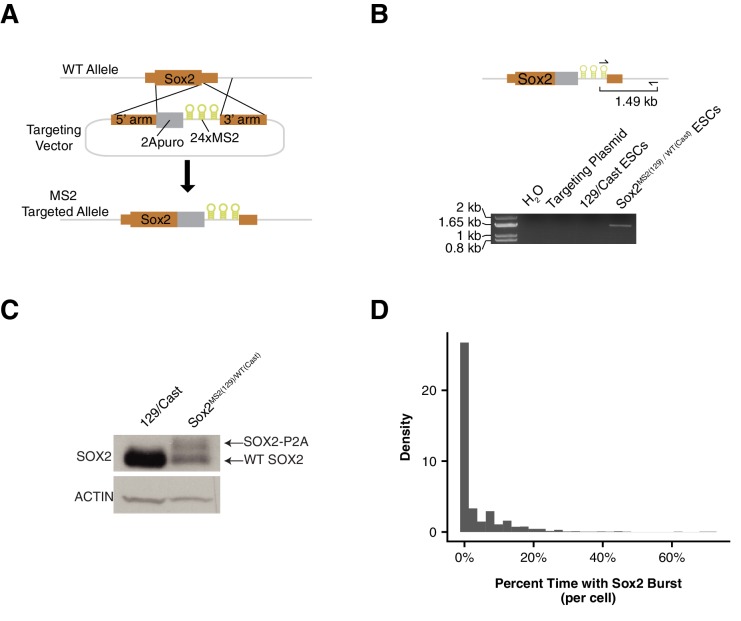
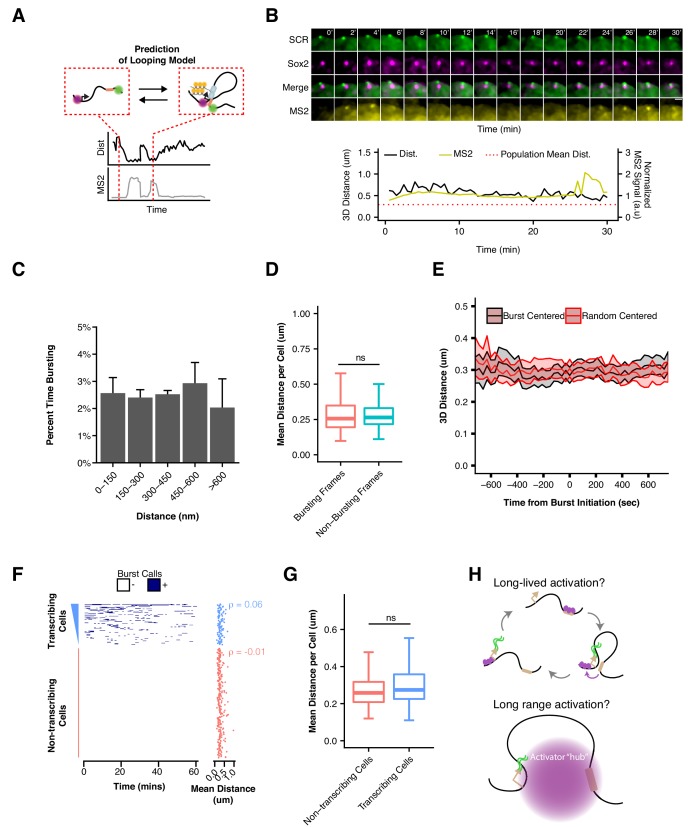
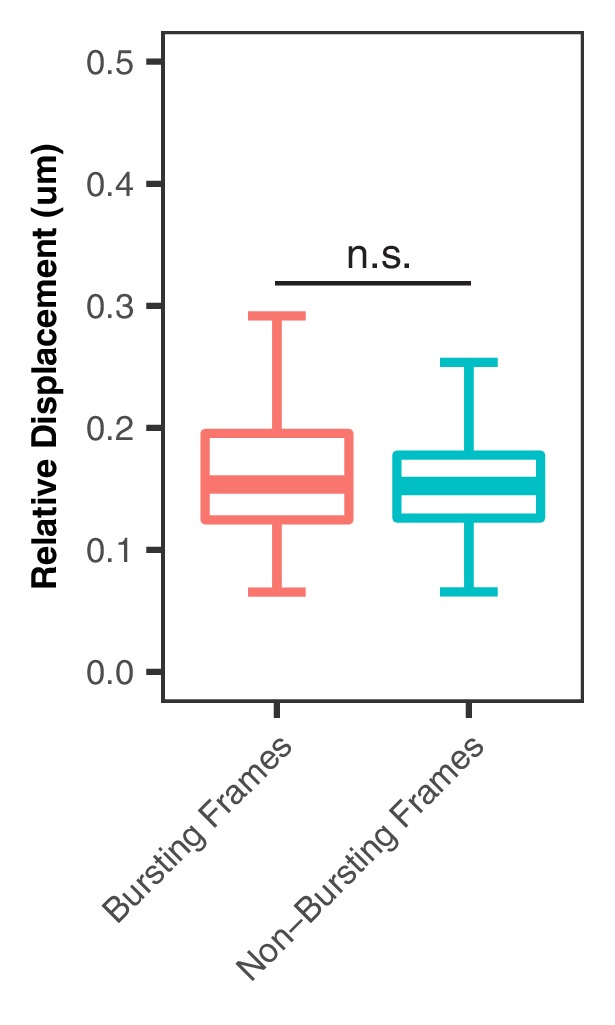
Enhancers are important regulatory elements that can control gene activity across vast genetic distances. However, the underlying nature of this regulation remains obscured because it has been difficult to observe in living cells. Here, we visualize the spatial organization and transcriptional output of the key pluripotency regulator Sox2 and its essential enhancer Sox2 Control Region (SCR) in living embryonic stem cells (ESCs). We find that Sox2 and SCR show no evidence of enhanced spatial proximity and that spatial dynamics of this pair is limited over tens of minutes. Sox2 transcription occurs in short, intermittent bursts in ESCs and, intriguingly, we find this activity demonstrates no association with enhancer proximity, suggesting that direct enhancer-promoter contacts do not drive contemporaneous Sox2 transcription. Our study establishes a framework for interrogation of enhancer function in living cells and supports an unexpected mechanism for enhancer control of Sox2 expression that uncouples transcription from enhancer proximity.

Keywords: chromosomes; enhancers; gene expression; microscopy; mouse; transcription.


Conflict of interest statement

JA, JG, BL, LM, MS, YS, BH, SL, OW No competing interests declared

Figures

Figure 1.
Figure 1.. The Sox2 Locus As a Model for Visualization of Enhancer-Promoter Regulation in Mouse Embryonic Stem Cells.
(A) To visualize chromosome loci in living cells, we have used tetO/TetR and cuO/CymR genetic labels. Our pipeline for insertion of these labels into the mouse genome is shown. First, CRISPR-Cas9 is used to place an attP integrase landing site. Second, a targeting plasmid bearing the compatible attB sequence, the tetO or cuO array, and a selection cassette is introduced along the integrase (Int) to mediate site-specific integration. The selection cassette can then be subsequently removed by Cre/Flp recombinase. (B) The Sox2 locus in mouse ESCs. Genomic browser tracks of epigenomic and expression data demonstrate high levels of histone acetylation, RNA polymerase II, and transcription factor (OCT4, SOX2, NANOG, CTCF) and cohesin (RAD21) occupancy at Sox2 and the distal Sox2 Control Region enhancer (tan boxes). Data from 4C and HiC experiments demonstrate chromosomal contacts at the Sox2 locus. For 4C data, read density indicates contact frequency with a fixed position near the Sox2 promoter (red triangle). Y-axis for browser tracks is reads per million. For HiC, all pairwise contact frequencies are shown using a heatmap. The intensity of each pixel represents the normalized number of contacts detected between a pair of loci. The maximum intensity is indicated in red square. At bottom, locations of the cuO- and tetO-arrays for the three cell lines utilized for this study. Sox2-8CcuO/+; Sox2-117TtetO/+ (Sox2-SCR) ESCs were used to track Sox2/SCR location. Two control lines, Sox2-43TtetO/+; Sox2-164TcuO/+ (Control-Control) and Sox2-117TtetO/+; Sox2-242TcuO/+ (SCR-Control) were analyzed for comparison. H3K27ac, RNA polymerase II (RNAP), and RNAseq data from GSE47949 (Wamstad et al., 2012); DNase data from GSE51336 (Vierstra et al., 2014); SOX2, OCT4, NANOG, CTCF data from GSE11431 (Chen et al., 2008b), and RAD21 data from GSE90994 (Hansen et al., 2017); 4C data from GSE72539 (de Wit et al., 2015); and HiChIP data from GSE96107 (Bonev et al., 2017).
Figure 1—figure supplement 1.
Figure 1—figure supplement 1.. Characterization of Modified Embryonic Stem Cell Lines.
(A) Schematic of modified cell lines used in this study. Primer sets used to amplify recombination arms for tetO- and cuO- integration are shown. (B,C) PCR genotyping of ESC lines shown in A.
Figure 1—figure supplement 2.
Figure 1—figure supplement 2.. Sox2 Expression Characterization for Modified Embryonic Stem Cell Lines.
(A) Ratio of Sox2 expression from the 129 allele and the CastEiJ allele measured by qPCR for modified ESC lines. Sox2-SCR cell line has cuO array inserted 8 kb centromeric to Sox2 TSS and tetO array inserted 5 kb telomeric to SCR. Control-Control cell line has cuO and tetO located 43 kb and 164 kb telomeric to Sox2 TSS. SCR-Control has tetO inserted 5 kb telomeric to SCR and cuO located 242 kb telomeric to Sox2 TSS. Samples labeled with CymR/TetR coexpress CymR-GFP and TetR-tdTom. (B) Sox2 expression relative to control gene (Tbp) for various cell lines. E14 (129/129) mESCs are included to demonstrate specificity of allele-specific qPCR assay. SCR deletion cell line are in the context of cuO and tetO integrations in the Sox2-SCR configuration. Deletion of SCR region leads to loss of expression from the Sox2 allele in cis. Bars show mean of at least three biological replicates. Error bars show the standard error. N.D. is not detected.
Figure 1—figure supplement 3.
Figure 1—figure supplement 3.. Sox2-SCR Contacts Are Maintained in Modified Embryonic Stem Cell Lines.
(A) Near-cis plots of 4C analysis using the Sox2 promoter region (red arrowhead) as bait shows elevated contacts with the SCR region (black arrowhead) in all cell lines investigated. Individual black points show fragment-based raw data, while blue points show a running median. The blue line and grey ribbon shows a loess-smoothed trendline for the data with the 20–80% quantile range. (B) Proportion of 4C reads that can be unambiguously assigned to a parental genome for each allele. These data demonstrate roughly half of Sox2-SCR contacts as measured by 4C come from the modified (129) allele and that our genome modifications do not significantly affect Sox2-SCR interactions.
Figure 2.
Figure 2.. Visualization of the Sox2 Region in ESCs Reveals Minimal Evidence for Sox2/SCR Interactions.
(A) Top, confocal Z slices of CymR-GFP and TetR-tdTom in Sox2-SCR ESCs, labeling the Sox2 promoter and SCR region with bright puncta, respectively. Middle, 3D surface rendering of the ESC nucleus shown above. A single fluorescence channel was rendered white and transparent to outline the nucleus, and GFP and tdTom surfaces were rendered with high threshold to highlight the cuO and tetO arrays, respectively. Bottom, tracking data is rendered for the nucleus shown above. Inset shows example of calculated 3D separation distance between the two labels. Scale bar is 1 µm. (B) Normalized histogram of 3D separation distance for Sox2-SCR ESCs demonstrates a single peak (Hartigan’s Dip Test for multimodality, p=1). Schematic for an hypothetical looping enhancer-promoter pair is shown as an inset, with two peaks. Tan box indicates regime where distance measurement error is expected to be greater than 50%. (C) Cumulative density of 3D separation distance for Sox2-SCR versus control comparisons. Mean distance for each sample shown on bottom right. (D) Mean 3D separation distance per cell for each label pair. Population means and standard deviations are shown for each sample. Mann-Whitney, *p<0.05, **p<0.01, ***p<0.001.
Figure 2—figure supplement 1.
Figure 2—figure supplement 1.. Tracking Lengths for tetO and cuO Spots Across Cell Lines.
(A–B) Histograms of the cuO-array (A) or tetO-array (B) track lengths for cell lines used in the study as ESCs, NPCs, and MES. Tracking lengths were often shorter in NPCs or MES due to increased nuclear movement in these cell types compared to ESCs.
Figure 2—figure supplement 2.
Figure 2—figure supplement 2.. Estimate of Localization Precision for cuO and tetO.
(A) Histograms of X, Y, and Z position uncertainty for fluorescent beads with signal-to-noise ratios comparable to cuO/CymR-GFP or tetO/TetR-tdTom. Data plotted are the standard deviation values measured using five frame sliding windows collected from 9 to 10 beads. (B) Histogram of X, Y, Z position uncertainty derived for tracking cuO/CymR-GFP and tetO/TetR-tdTom position in fixed cells. Data plotted are standard deviations using a five frame sliding window collected for 10 loci. (C) Histogram of X, Y, Z position uncertainty for fluorescent beads with signal-to-noise ratios comparable to cuO/CymR-Halox2 or tetO/TetR-GFPx2. In all cases, error bars show median and interquartile range of the computed position uncertainties, which are reported in the upper right of each panel.
Figure 2—figure supplement 3.
Figure 2—figure supplement 3.. Impact of Localization Precision on 3D Distance Measurements.
(A) A plot of true distance versus predicted measured distance after localization error is included demonstrate significant overestimation of very small distances. These values were derived by sampling X, Y, and Z measurements for cuO and tetO from normal distributions centered on positions that are separated by the true distance and standard deviations consistent with estimated uncertainty (median values from Figure 2—figure supplement 2 panel A). (B) The interquartile range of stimulated distance measurements after localization error is included demonstrates that measured 3D distance uncertainty is distance dependent and plateaus at approximately 52 nm.
Figure 3.
Figure 3.. Sox2 Locus Compacts upon ESC Differentiation.
(A) ESCs were differentiated into neural progenitor cells (NPCs), which maintain expression of Sox2 but inactivate the SCR, and cardiogenic mesodermal precursors (MES), which inactivate both Sox2 and the SCR. (B) Browser tracks of H3K27ac and RNA-seq data from ESCs, NPCs, and MES demonstrate the activation status of Sox2 and SCR in each cell type. Y-axis is 0–5 reads per million for H3K27ac data and 0–10 reads per million for RNA-seq data. (C) Cumulative density of 3D separation distance for Sox2-SCR and two control pairs for NPCs (left) and MES (right). ESC data are shown for comparison as solid lines on each graph and reproduced from Figure 2C. Tan box indicates regime where distance measurement error is expected to be greater than 50%. (D) Mean 3D separation distance per cell for each label pair, organized by cell type. Statistical analysis is for each matched pair-wise comparison between cell types. All p-values are below reported value. Mann-Whitney (**p<0.01, ***p<0.001). H3K27ac data from GSE47949 (Wamstad et al., 2012) and GSE24164 (Creyghton et al., 2010). RNAseq data from GSE47949 and GSE44067 (Zhang et al., 2013).
Figure 3—figure supplement 1.
Figure 3—figure supplement 1.. Characterization of ESC-derived Neural Progenitor Cell Lines.
(A) Immunofluorescence of fixed neural progenitor cells (NPCs) for the NPC markers SOX2 and PAX6. (B-C) Immunofluorescence for the neuron marker β3-tubulin (B) or the astrocyte marker GFAP (C) on fixed cultures after 12 days of differentiation towards neurons or astrocytes, respectively. Scale bar is 100 µm.
Figure 3—figure supplement 2.
Figure 3—figure supplement 2.. SCR Inactivation Does Not Drive Locus Compaction Upon Differentiation.
(A) Potential models for Sox2 locus compaction observed upon differentiation to NPCs or MES. At left, cellular differentiation may lead to global changes in chromatin structure that are not dependent of Sox2/SCR activation status. Alternatively, Sox2 and SCR inactivation could lead to changes to chromatin structure within the Sox2 locus, driving locus-specific compaction. (B) Strategy for CRISPR/Cas9-mediated SCR deletion. Two gRNAs were designed to flank the SCR region and generate a deletion of SCR. Below, the SCR deletion allele shows a novel junction near the locations of expected Cas9 cutting, indicating a loss of the intervening SCR sequence. (C) Scatterplot of mean and standard deviation of 3D distance measurements for each cell line visualizes similarity between Sox2 label pairs across cell types. (D) Dendrogram visualizing hierarchical clustering of Earth Mover’s distances between 3D separation distance histograms of distinct Sox2 label pairs across cell types. SCR-deleted ESCs show greatest similarity to other ESCs as opposed to differentiated cells with inactivation of the SCR element.
Figure 4.
Figure 4.. Slow Sox2 Locus Conformation Dynamics Lead to Limited Exploration and Variable Encounters.
(A) Maximum-intensity projection images (top) centered on the Sox2 locus and associated 3D distance measurements (bottom) highlight distinct conformations and dynamics of the Sox2 locus across cells. Scale bar is 1 µm. (B) 3D separation distance measurements for individual cells for Sox2-SCR, Control-Control, and SCR-Control highlight the heterogeneity of Sox2 locus organization across the cell population. The three cells depicted in A are boxed. (C) Cartoon description of autocorrelation analysis. Distance measurement between two time points are correlated using population statistics, revealing the time scale over which local measurements diverge from the population mean. A cell with low autocorrelation will randomly fluctuate around the population mean, leading the autocorrelation function to quickly decay to zero. A cell with high autocorrelation will deviate substantially from the expected value, only slowly relaxing back to the population mean. In this case, the autocorrelation function will stay significantly above zero for large lag times. (D) Autocorrelation function for Sox2-SCR, Control-Control, and SCR-Control pairs demonstrates significant autocorrelation at large lag times, indicating significant memory in 3D conformation across a 20 min window. The plotted values are mean ± 95% CI. E) Percent of cells with an encounter between tetO and cuO labels shown as a function of the initial separation distance measured for the cell. Likelihood of an encounter depends on the initial conformation of the locus across all label pairs and encounter thresholds.
Figure 4—figure supplement 1.
Figure 4—figure supplement 1.. Dynamics Statistics for Each Sox2 Locus Pair in ESCs.
(A–B) Normalized histograms of relative step size (A) and change in 3D separation distance (B) for adjacent frames. Mean value is highlighted by a red line.
Figure 5.
Figure 5.. Visualizing Sox2 Expression in Single Living ESCs Reveals Intermittent Bursts of Transcription.
(A) Sox2 locus with cuO-labeled Sox2 promoter and tetO-labeled SCR was further modified to introduce an MS2 transcriptional reporter cassette into the Sox2 gene. Transcription of Sox2 leads to visible spot at the Sox2 gene due to binding and clustering of MS2 coat protein to the MS2 hairpin sequence. (B) Maximum-intensity projection images centered on the Sox2 promoter (cuO) show intermittent bursts of MS2 signal, which are quantified on the right. Scale bar is 1 µm. (C) Single cell trajectories of Sox2 transcriptional bursts as representatively shown in B. (D) Aligned Sox2 transcriptional bursts. Randomly selected Sox2 bursts are shown as color traces (n = 50). Black line is mean MS2 signal for all annotated bursts. (E) Percent time Sox2 transcriptional bursting for various experimental conditions. Bars are mean ± standard error of ≥3 independent experiments. Sox2MS2/+ indicates cell line harbors the Sox2-MS2 reporter allele. SCRdel/+ indicates presence of an SCR deletion in cis with the Sox2-MS2 reporter. DRB indicates treatment with the transcriptional inhibitor 5,6-Dichloro-1-β-D-ribofuranosylbenzimidazole (DRB).
Figure 5—figure supplement 1.
Figure 5—figure supplement 1.. Generation and Characterization of Sox2-MS2 Transcriptional Reporter ESCs.
(A) Targeting strategy for Sox2 transcriptional reporter. A targeting plasmid was used with Sox2 homology arms and a P2A peptide puromycin resistance gene cassette (2Apuro) inserted in frame with Sox2. Downstream of 2A puro is a 24x MS2 stem loop array, which is inserted into the 3’ UTR. (B) PCR genotyping assay to identify a targeted Sox2 allele. A primer set was used that recognized the MS2 stem loop array and a genomic region downstream of the 3’ homology arm. (C) Western blotting for SOX2 protein in parental 129/CastEiJ ESCs or ESCs heterozygous for the Sox2-MS2 allele. Actin was used as a loading control. (D) Normalized histogram of the percentage of time each individual cell has a detectable Sox2 transcriptional burst.
Figure 6.
Figure 6.. Sox2 Transcription Is Not Associated with SCR Proximity.
(A) Schematic illustrating the expected relation between Sox2/SCR distance and MS2 transcription for a looping enhancer model. (B) Maximum-intensity projection images centered on the Sox2 promoter (cuO) show transcriptional activity without correlation to Sox2/SCR distance changes. The measured distance and MS2 signal are shown at bottom. The mean separation distance across the cell population is shown as a dotted red line. Scale bar is 1 µm. (C) Percent time with Sox2 transcriptional burst as a function of Sox2/SCR distance. Weighted mean + SE for seven experiments are shown. Weights were determined based on the proportion of frames in each bin contributed by individual experiments. (D) Mean separation distance per cell, separated into bursting and non-bursting frames. (Mann-Whitney, p=0.68). (E) Mean separation distance across a 25 min window for all transcriptional bursts (black) or randomly select time points (red), aligned according the burst initiation frame. Values plotted are mean ± 95% CI. (F) Single cell trajectories of Sox2 transcriptional bursts ranked by number of bursting frames per cell. At right, matched mean separation distances for each cell shown at left. Spearman’s correlation coefficient for each is shown. (G) Mean separation distance per cell for transcribing and non-transcribing cells. (Mann-Whitney, p=0.15). (H) Potential models of SCR regulation of Sox2 that would uncouple Sox2/SCR proximity from transcriptional activity. Above, SCR leads to long-lived activation of the Sox2 promoter that can persist long after Sox2/SCR contact is disassembled. Below, SCR nucleates a large hub of activator proteins that can modify the Sox2 promoter environment despite large distances between Sox2 and SCR.
Figure 6—figure supplement 1.
Figure 6—figure supplement 1.. Relative Displacement between Frames for Bursting and Non-Burst Time Points.
(A) Displacement of the SCR element (tetO/TetR) relative to the Sox2 promoter (cuO/CymR) between successive frames shows no difference between bursting and non-bursting time points (Mann-Whitney, p=0.4172).
Author response image 1.
Author response image 2.
Author response image 3.
Author response image 4.
Author response image 5.
Author response image 6.

References

    1. Afgan E, Baker D, Batut B, van den Beek M, Bouvier D, Cech M, Chilton J, Clements D, Coraor N, Grüning BA, Guerler A, Hillman-Jackson J, Hiltemann S, Jalili V, Rasche H, Soranzo N, Goecks J, Taylor J, Nekrutenko A, Blankenberg D. The Galaxy platform for accessible, reproducible and collaborative biomedical analyses: 2018 update. Nucleic Acids Research. 2018;46:W537–W544. doi: 10.1093/nar/gky379. - DOI - PMC - PubMed
    1. Alberts B, Johnson AD, Lewis J, Morgan D, Raff M, Roberts K, Walter P. Molecular Biology of the Cell. W. W. Norton & Company; 2014.
    1. Alexander JM. Alexander_et_al_2018. f8a68bcGitHub. 2018 https://github.com/JMAlexander/2018_eLife_Alexander_et_al
    1. Banerji J, Olson L, Schaffner W. A lymphocyte-specific cellular enhancer is located downstream of the joining region in immunoglobulin heavy chain genes. Cell. 1983;33:729–740. doi: 10.1016/0092-8674(83)90015-6. - DOI - PubMed
    1. Bartman CR, Hsu SC, Hsiung CC, Raj A, Blobel GA. Enhancer Regulation of Transcriptional Bursting Parameters Revealed by Forced Chromatin Looping. Molecular Cell. 2016;62:237–247. doi: 10.1016/j.molcel.2016.03.007. - DOI - PMC - PubMed

Publication types

MeSH terms

Substances