

Comparison of the Relaxivities of Macrocyclic Gadolinium-Based Contrast Agents in Human Plasma at 1.5, 3, and 7 T, and Blood at 3 T
- PMID: 31124800
- PMCID: PMC6738537
- DOI: 10.1097/RLI.0000000000000577
Comparison of the Relaxivities of Macrocyclic Gadolinium-Based Contrast Agents in Human Plasma at 1.5, 3, and 7 T, and Blood at 3 T
Abstract
Purpose: The relaxivities of 3 macrocyclic gadolinium-based contrast agents (GBCAs) were determined in human plasma and blood under standardized and clinically relevant laboratory conditions.
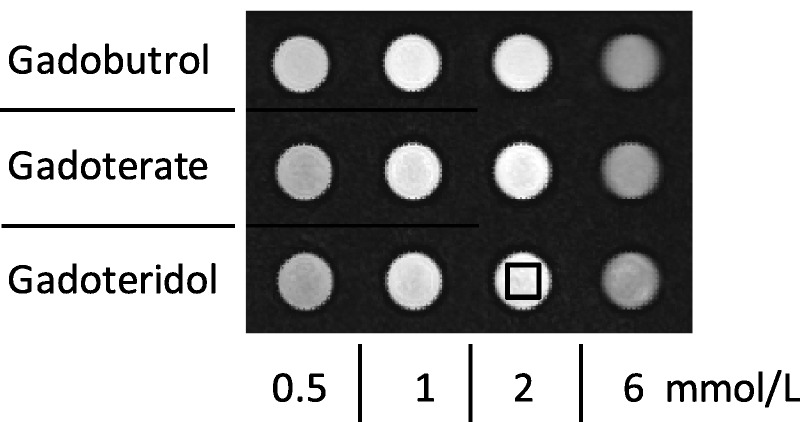
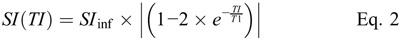
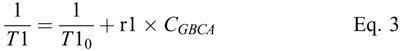
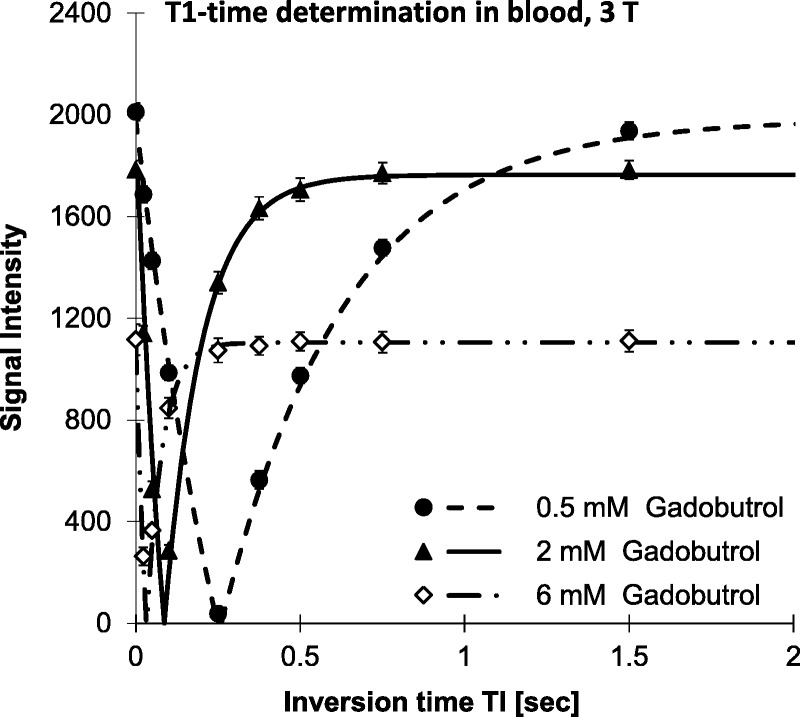
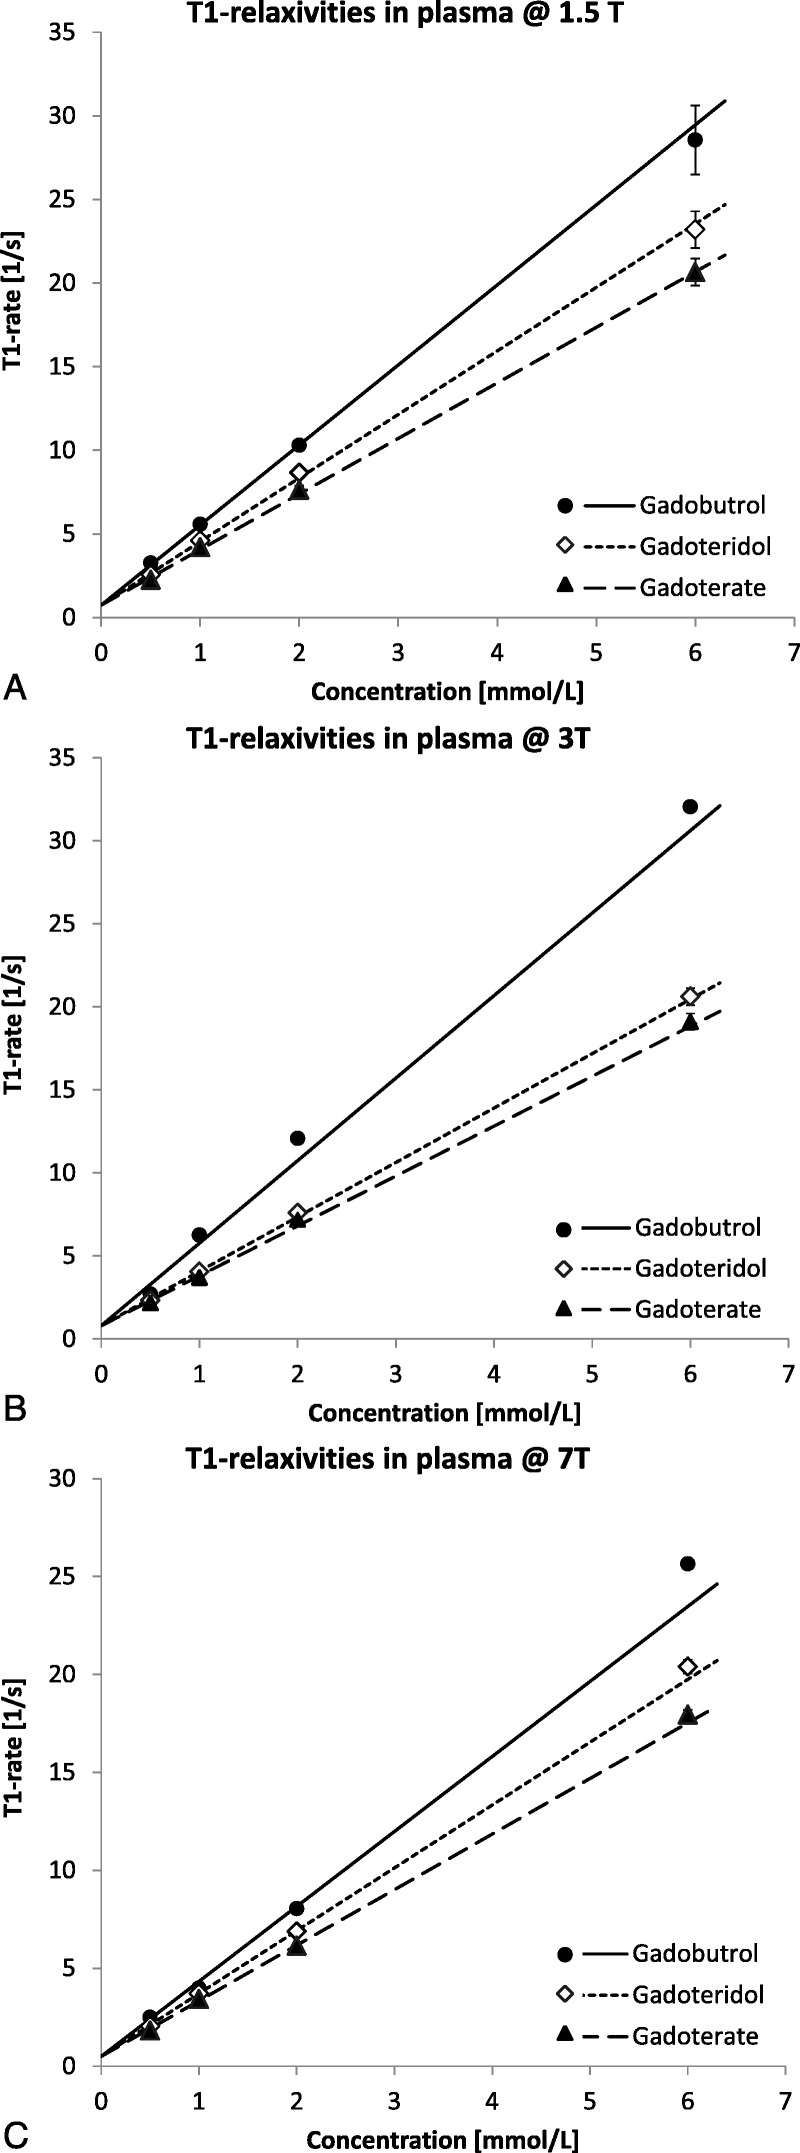
Methods: The T1 relaxivity, r1, was determined in human plasma at 1.5, 3, and 7 T, and in human blood at 3 T at 37°C in phantoms containing 4 different concentrations of the macrocyclic GBCAs gadobutrol, gadoteridol, and gadoterate. An inversion recovery turbo spin echo sequence was used to generate images with several inversion times. The T1-times were obtained by fitting the signal intensities to the signal equation. r1 was obtained by a 1/y-weighted regression of the T1-rates over the concentration of the GBCAs.
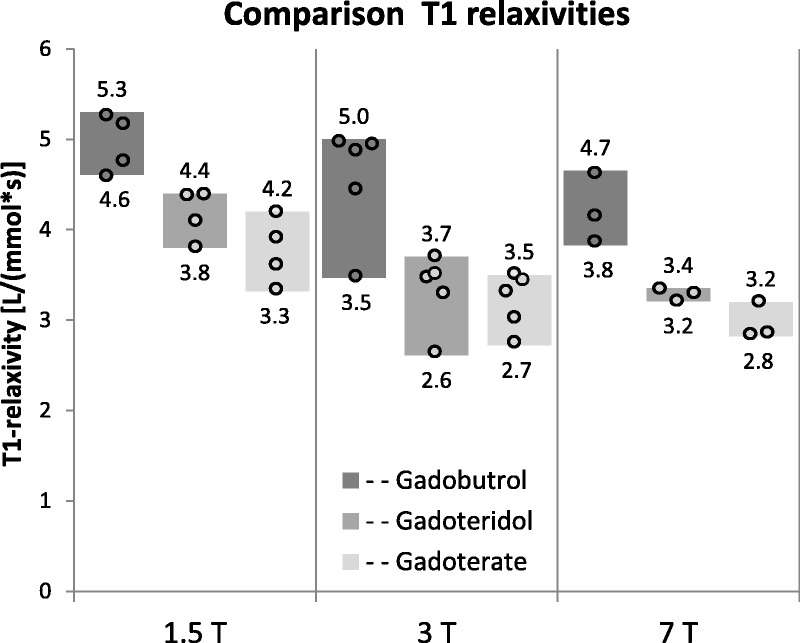
Results: For gadobutrol, the obtained r1 [L/(mmol·s)] in human plasma at 1.5 T, 3 T, and 7 T, and in human blood at 3 T was 4.78 ± 0.12, 4.97 ± 0.59, 3.83 ± 0.24, and 3.47 ± 0.16. For gadoteridol, r1 was 3.80 ± 0.10, 3.28 ± 0.09, 3.21 ± 0.07, and 2.61 ± 0.16, and for gadoterate, 3.32 ± 0.13, 3.00 ± 0.13, 2.84 ± 0.09, and 2.72 ± 0.17.
Conclusions: The relaxivity of gadobutrol is significantly higher than that of gadoteridol and gadoterate at all magnetic field strengths and in plasma as well as in blood, whereas that of gadoteridol was higher than gadoterate only in plasma at 1.5 and 7 T. This is in accordance with results from 3 previous studies obtained in different media.
Conflict of interest statement
Conflicts of interest and sources of funding: The authors P.S., I.M.N.-H., and S.T. declare no conflicts of interest. The authors M.R., T.F., G.J., J.E. and H.P. are employees of Bayer AG. This study was funded by the Vienna Science and Technology Fund (WWTF-LS11-018), Austrian Science Fund (FWF KLI541-B30), and Slovak Grant Agency (APVV-15-0029). Financial support to the Medical University of Vienna was also provided by Bayer AG.
Figures

References
-
- Matsumura T, Hayakawa M, Shimada F, et al. Safety of gadopentetate dimeglumine after 120 million administrations over 25 years of clinical use. Magn Reson Med Sci. 2013;12:297–304. - PubMed
-
- Runge VM. Safety of the gadolinium-based contrast agents for magnetic resonance imaging, focusing in part on their accumulation in the brain and especially the dentate nucleus. Invest Radiol. 2016;51:273–279. - PubMed
-
- Runge VM. Critical questions regarding gadolinium deposition in the brain and body after injections of the gadolinium-based contrast agents, safety, and clinical recommendations in consideration of the EMA's pharmacovigilance and risk assessment committee recommendation for suspension of the marketing authorizations for 4 linear agents. Invest Radiol. 2017;52:317–323. - PubMed
-
- Radbruch A, Weberling LD, Kieslich PJ, et al. Gadolinium retention in the dentate nucleus and globus pallidus is dependent on the class of contrast agent. Radiology. 2015;275:783–791. - PubMed
Publication types
MeSH terms
Substances
LinkOut - more resources
Full Text Sources
Medical
