

Formation of Polycyclic Aromatic Hydrocarbon Oxidation Products in α-Pinene Secondary Organic Aerosol Particles Formed through Ozonolysis
- PMID: 31125204
- PMCID: PMC7122035
- DOI: 10.1021/acs.est.9b01732
Formation of Polycyclic Aromatic Hydrocarbon Oxidation Products in α-Pinene Secondary Organic Aerosol Particles Formed through Ozonolysis
Abstract
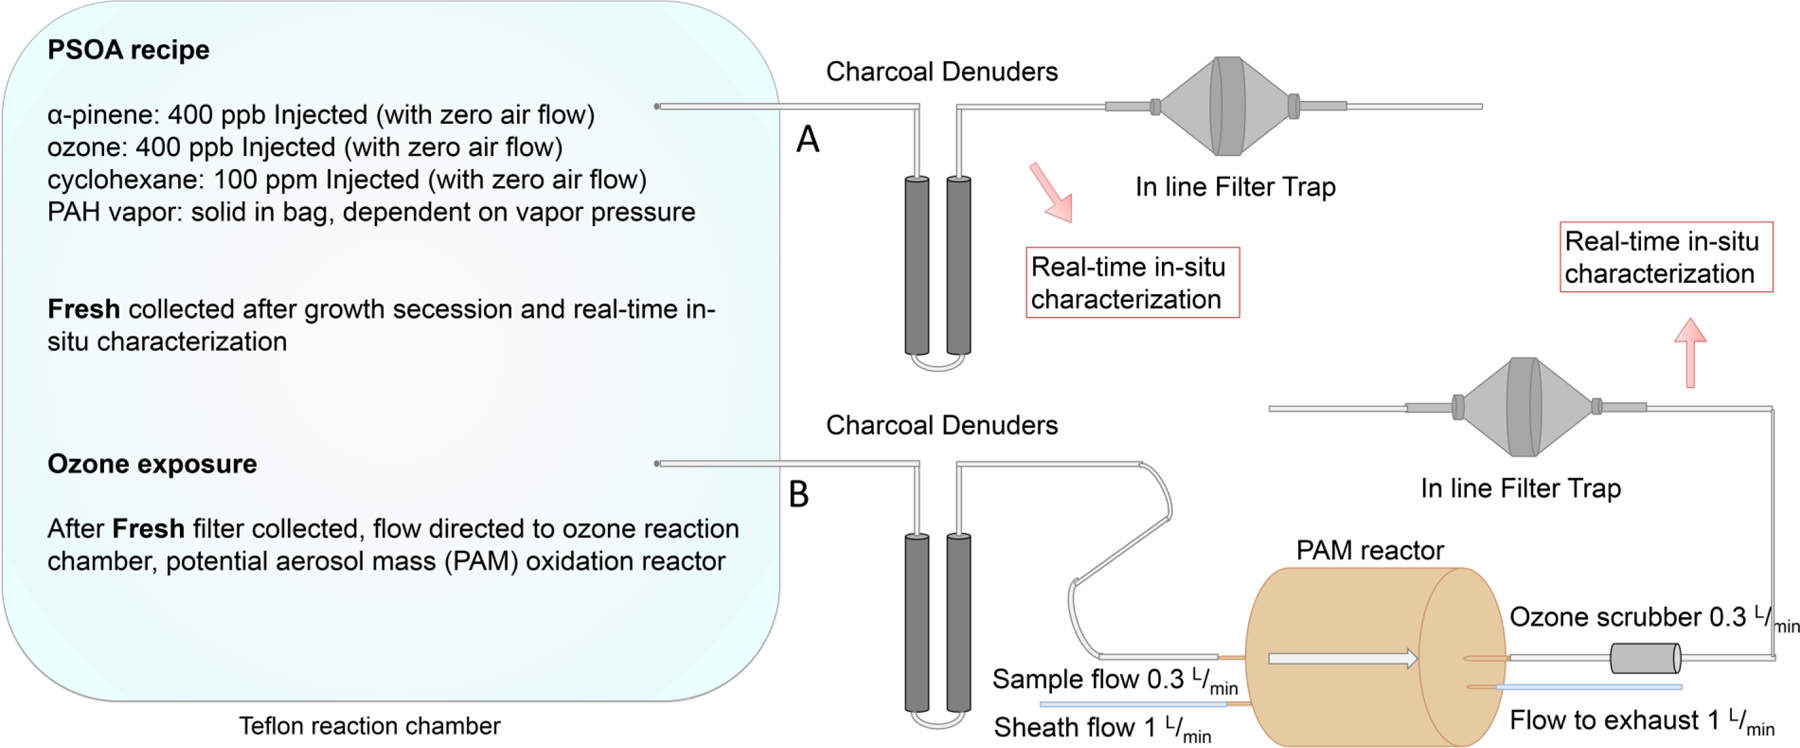
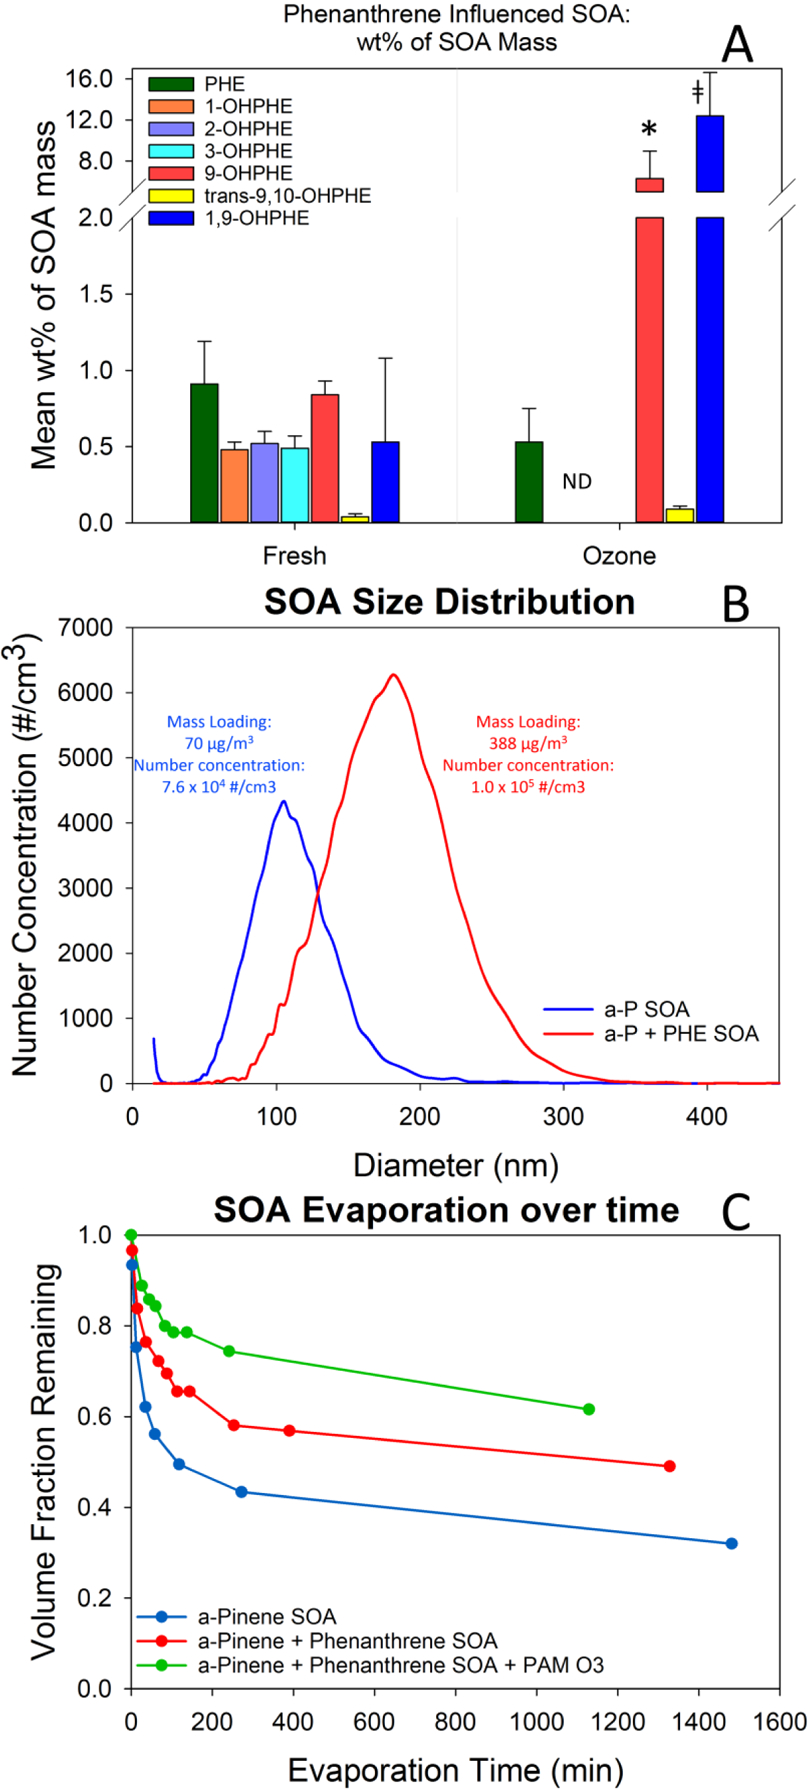
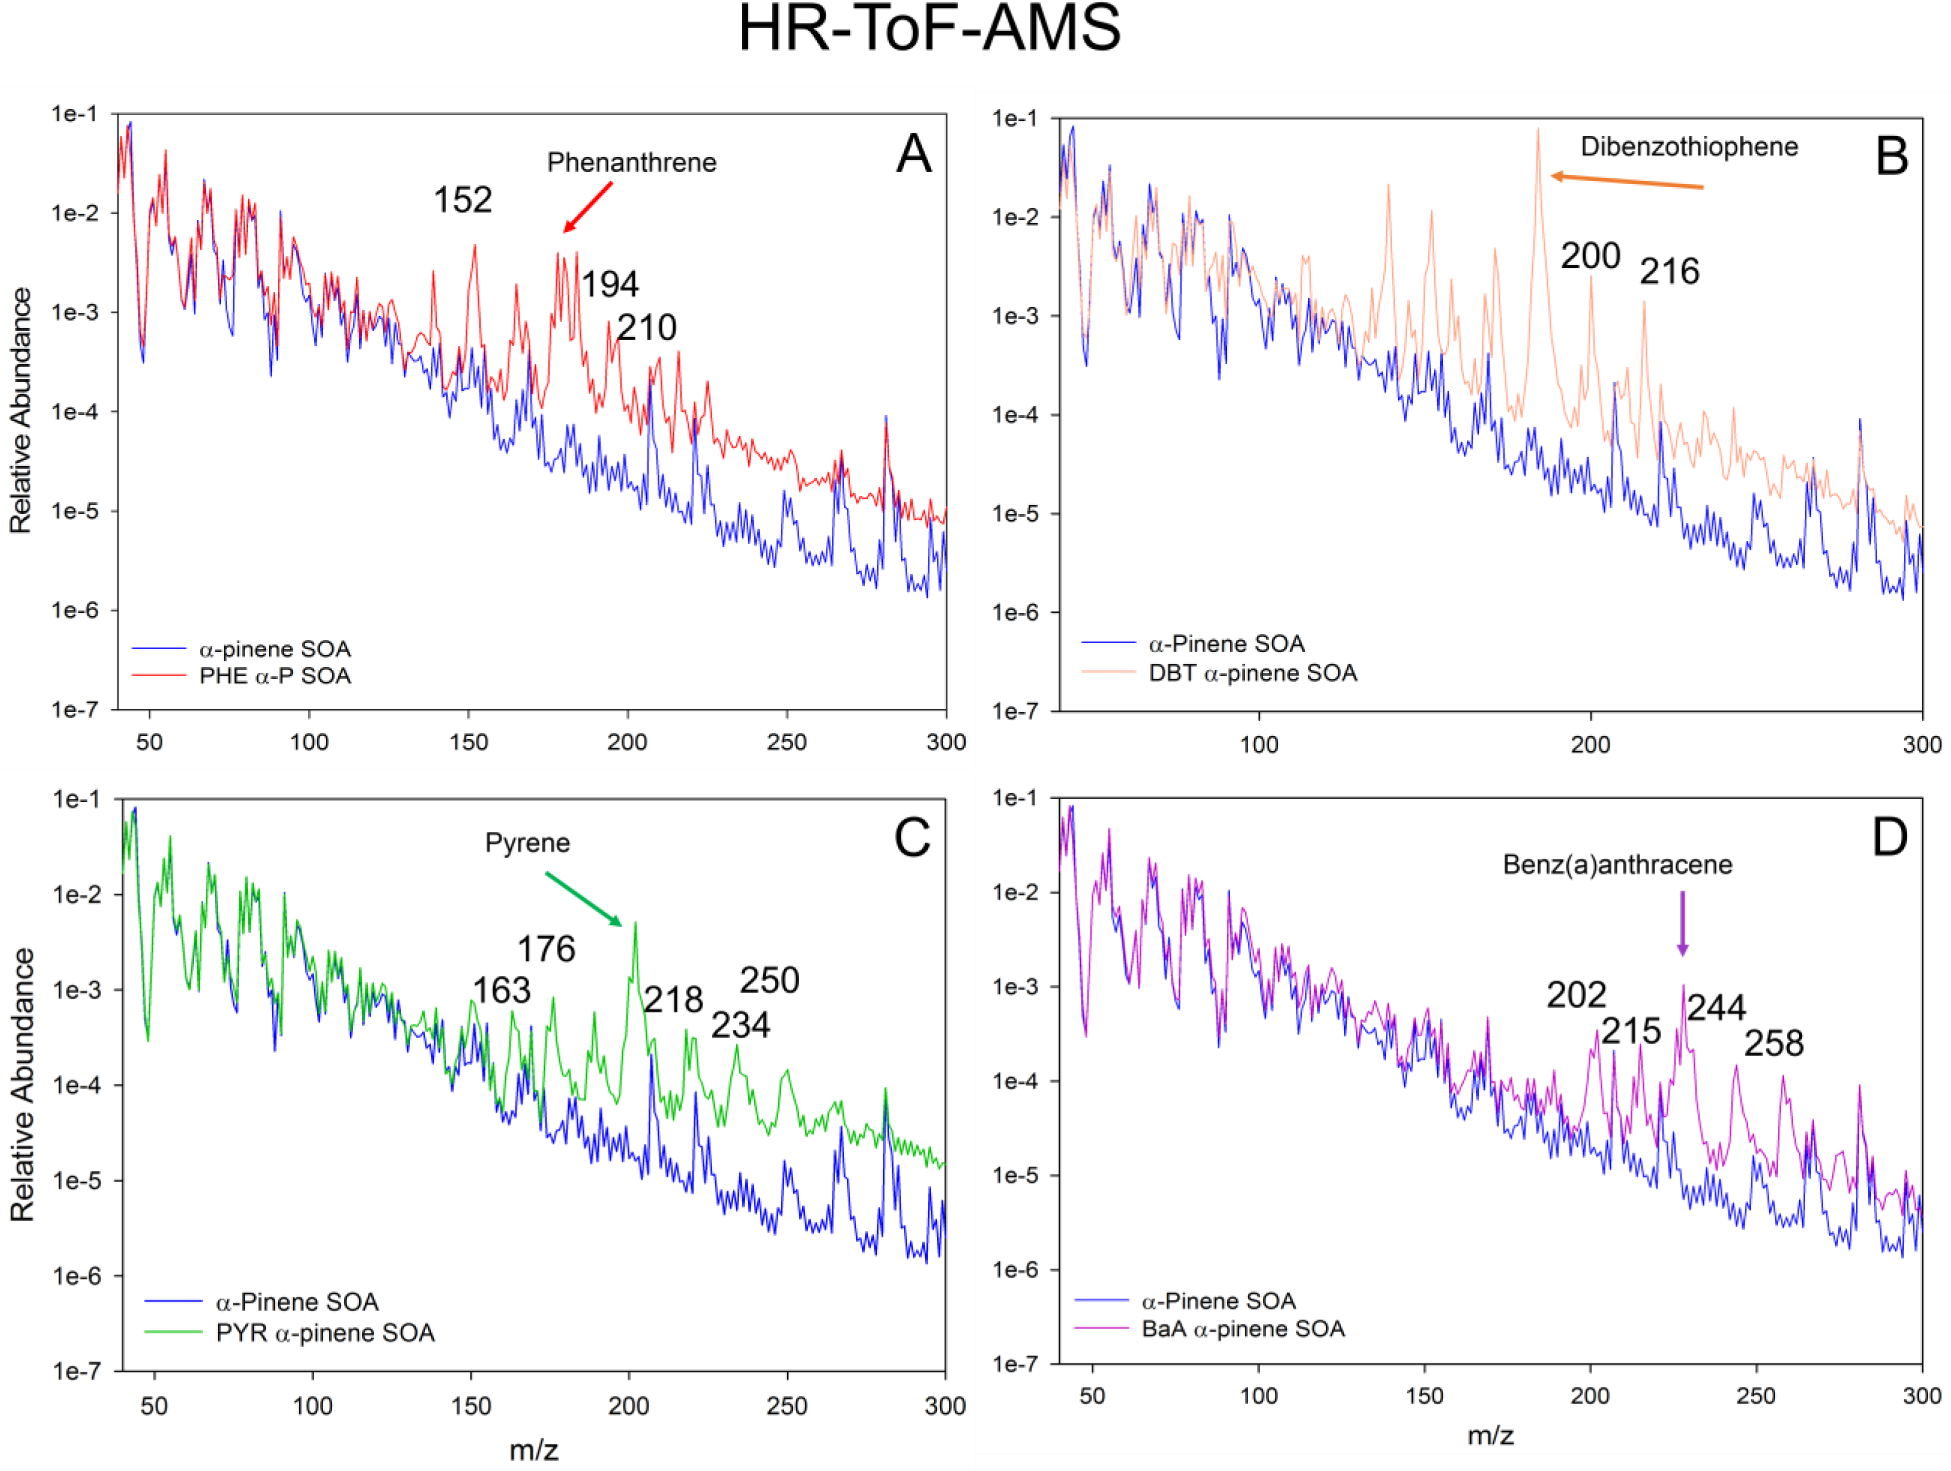
Accurate long-range atmospheric transport (LRAT) modeling of polycyclic aromatic hydrocarbons (PAHs) and PAH oxidation products (PAH-OPs) in secondary organic aerosol (SOA) particles relies on the known chemical composition of the particles. Four PAHs, phenanthrene (PHE), dibenzothiophene (DBT), pyrene (PYR), and benz(a)anthracene (BaA), were studied individually to identify and quantify PAH-OPs produced and incorporated into SOA particles formed by ozonolysis of α-pinene in the presence of PAH vapor. SOA particles were characterized using real-time in situ instrumentation, and collected on quartz fiber filters for offline analysis of PAHs and PAH-OPs. PAH-OPs were measured in all PAH experiments at equal or greater concentrations than the individual PAHs they were produced from. The total mass of PAH and PAH-OPs, relative to the total SOA mass, varied for different experiments on individual parent PAHs: PHE and 6 quantified PHE-OPs (3.0%), DBT and dibenzothiophene sulfone (4.9%), PYR and 3 quantified PYR-OPs (3.1%), and BaA and benz(a)anthracene-7,12-dione (0.26%). Further exposure of PAH-SOA to ozone generally increased the concentration ratio of PAH-OPs to PAH, suggesting longer atmospheric lifetimes for PAH-OPs, relative to PAHs. These data indicate that PAH-OPs are formed during SOA particle formation and growth.
Conflict of interest statement
The authors declare no conflicts of interest.
Figures
Similar articles
-
The effect of sub-zero temperature on the formation and composition of secondary organic aerosol from ozonolysis of alpha-pinene.Environ Sci Process Impacts. 2017 Oct 18;19(10):1220-1234. doi: 10.1039/c7em00231a. Environ Sci Process Impacts. 2017. PMID: 28805852
-
The effect of gas-phase polycyclic aromatic hydrocarbons on the formation and properties of biogenic secondary organic aerosol particles.Faraday Discuss. 2017 Aug 24;200:143-164. doi: 10.1039/c7fd00032d. Faraday Discuss. 2017. PMID: 28581016 Free PMC article.
-
Aging of secondary organic aerosol from alpha-pinene ozonolysis: roles of hydroxyl and nitrate radicals.J Air Waste Manag Assoc. 2012 Dec;62(12):1359-69. doi: 10.1080/10962247.2012.712082. J Air Waste Manag Assoc. 2012. PMID: 23362755
-
Micro-droplet Trapping and Manipulation: Understanding Aerosol Better for a Healthier Environment.Chem Asian J. 2021 Jul 5;16(13):1644-1660. doi: 10.1002/asia.202100516. Epub 2021 Jun 10. Chem Asian J. 2021. PMID: 33999498 Review.
-
Recent Progress in Polycyclic Aromatic Hydrocarbon-Based Organic Co-Crystals.Chem Rec. 2021 Jan;21(1):116-132. doi: 10.1002/tcr.202000098. Epub 2020 Nov 10. Chem Rec. 2021. PMID: 33169940 Review.
Cited by
-
The Parallel Transformations of Polycyclic Aromatic Hydrocarbons in the Body and in the Atmosphere.Environ Health Perspect. 2022 Feb;130(2):25004. doi: 10.1289/EHP9984. Epub 2022 Feb 28. Environ Health Perspect. 2022. PMID: 35225689 Free PMC article.
-
Primary and Secondary Organic Aerosol Formation from Asphalt Pavements.Environ Sci Technol. 2023 Dec 5;57(48):20034-20042. doi: 10.1021/acs.est.3c06037. Epub 2023 Nov 6. Environ Sci Technol. 2023. PMID: 37931038 Free PMC article.
-
Impact of local and regional sources of PAHs on tribal reservation air quality in the U.S. Pacific Northwest.Sci Total Environ. 2020 Mar 25;710:136412. doi: 10.1016/j.scitotenv.2019.136412. Epub 2020 Jan 5. Sci Total Environ. 2020. PMID: 31927295 Free PMC article.
-
Assessing the oxidative potential of PAHs in ambient PM2.5 using the DTT consumption assay.Environ Pollut. 2021 Sep 15;285:117411. doi: 10.1016/j.envpol.2021.117411. Epub 2021 May 19. Environ Pollut. 2021. PMID: 34051568 Free PMC article.
-
Time-Resolved Molecular Characterization of Secondary Organic Aerosol Formed from OH and NO3 Radical Initiated Oxidation of a Mixture of Aromatic Precursors.Environ Sci Technol. 2023 Aug 8;57(31):11572-11582. doi: 10.1021/acs.est.3c00225. Epub 2023 Jul 26. Environ Sci Technol. 2023. PMID: 37496264 Free PMC article.
References
-
- Primbs T; Piekarz A; Wilson G; Schmedding D; Higginbotham C; Field J; Simonich SM, Influence of Asian and Western United States Urban Areas and Fires on the Atmospheric Transport of Polycyclic Aromatic Hydrocarbons, Polychlorinated Biphenyls, and Fluorotelomer Alcohols in the Western United States. Environmental Science & Technology 2008, 42 (17), 6385–6391. - PMC - PubMed
-
- Friedman CL; Selin NE, Long-Range Atmospheric Transport of Polycyclic Aromatic Hydrocarbons: A Global 3-D Model Analysis Including Evaluation of Arctic Sources. Environmental Science & Technology 2012, 46 (17), 9501–9510. - PubMed
-
- Wang R; Liu G; Zhang J, Variations of emission characterization of PAHs emitted from different utility boilers of coal-fired power plants and risk assessment related to atmospheric PAHs. Science of The Total Environment 2015, 538, 180–190. - PubMed
Publication types
MeSH terms
Substances
Grants and funding
LinkOut - more resources
Full Text Sources
Medical
