. 2019 May 24;13(5):e0007030.
doi: 10.1371/journal.pntd.0007030. eCollection 2019 May.

The effects of trans-chalcone and chalcone 4 hydrate on the growth of Babesia and Theileria

Affiliations

The effects of trans-chalcone and chalcone 4 hydrate on the growth of Babesia and Theileria

Gaber El-Saber Batiha et al. PLoS Negl Trop Dis. .

Abstract

Background: Chemotherapy is a principle tool for the control and prevention of piroplasmosis. The search for a new chemotherapy against Babesia and Theileria parasites has become increasingly urgent due to the toxic side effects of and developed resistance to the current drugs. Chalcones have attracted much attention due to their diverse biological activities. With the aim to discover new drugs and drug targets, in vitro and in vivo antibabesial activity of trans-chalcone (TC) and chalcone 4 hydrate (CH) alone and combined with diminazene aceturate (DA), clofazimine (CF) and atovaquone (AQ) were investigated.

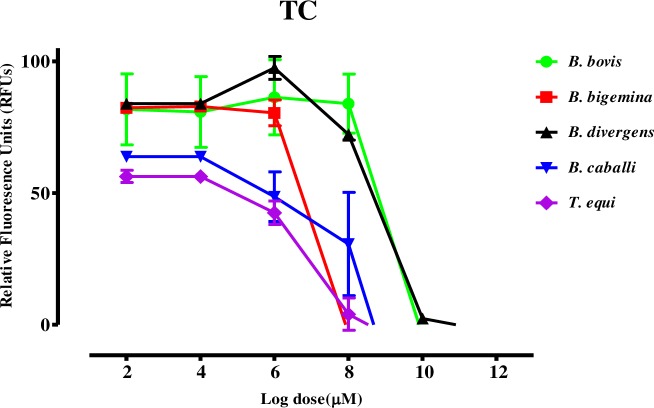
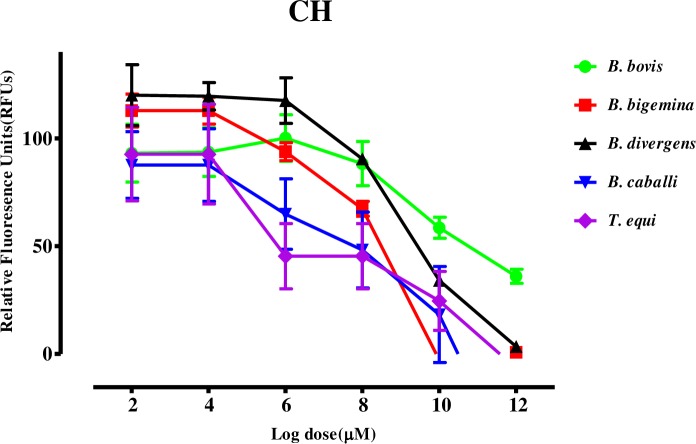
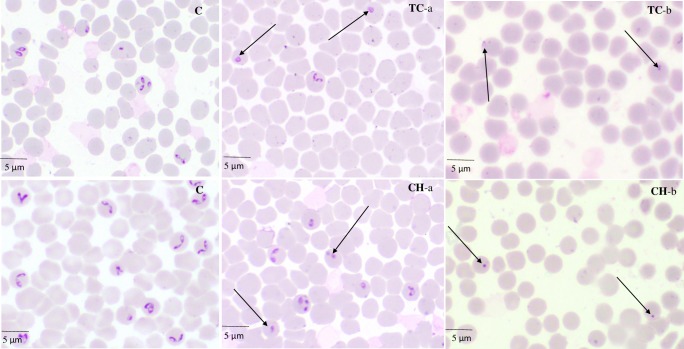
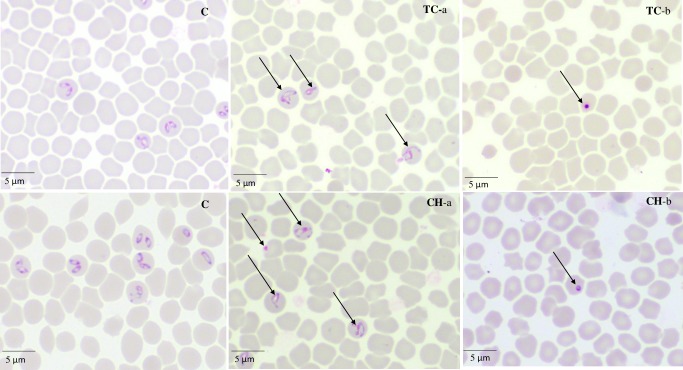
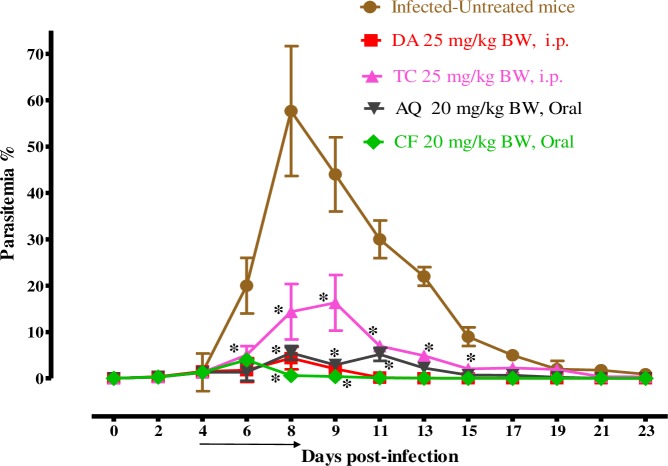
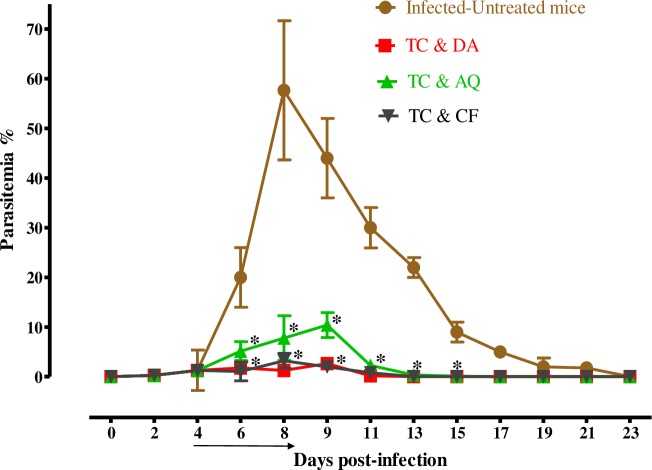
Methodology/principal findings: The fluorescence-based assay was used for evaluating the inhibitory effect of TC and CH on four Babesia species, including B. bovis, B. bigemina, B. divergens, B. caballi, and T. equi, the combination with DA, CF, and AQ on in vitro cultures, and on the multiplication of a B. microti-infected mouse model. The cytotoxicity of compounds was tested on Madin-Darby bovine kidney (MDBK), mouse embryonic fibroblast (NIH/3T3), and human foreskin fibroblast (HFF) cell lines. The half maximal inhibitory concentration (IC50) values of TC and CH against B. bovis, B. bigemina, B. divergens, B. caballi, and T. equi were 69.6 ± 2.3, 33.3 ± 1.2, 64.8 ± 2.5, 18.9 ± 1.7, and 14.3 ± 1.6 μM and 138.4 ± 4.4, 60.9 ± 1.1, 82.3 ± 2.3, 27.9 ± 1.2, and 19.2 ± 1.5 μM, respectively. In toxicity assays, TC and CH affected the viability of MDBK, NIH/3T3, and HFF cell lines the with half maximum effective concentration (EC50) values of 293.9 ± 2.9, 434.4 ± 2.7, and 498 ± 3.1 μM and 252.7 ± 1.7, 406.3 ± 9.7, and 466 ± 5.7 μM, respectively. In the mouse experiment, TC reduced the peak parasitemia of B. microti by 71.8% when administered intraperitoneally at 25 mg/kg. Combination therapies of TC-DA and TC-CF were more potent against B. microti infection in mice than their monotherapies.

Conclusions/significance: In conclusion, both TC and CH inhibited the growth of Babesia and Theileria in vitro, and TC inhibited the growth of B. microti in vivo. Therefore, TC and CH could be candidates for the treatment of piroplasmosis after further studies.


Conflict of interest statement

The authors have declared that no competing interests exist.

Figures

Fig 1
Fig 1. Dose-response curves of TC against Babesia and Theileria parasites in vitro.
The curves show the relative fluorescence units of B. bovis, B. bigemina, B. divergens, B. caballi, and T. equi treated with increasing concentrations of TC. The results were determined via fluorescence assay after 96 h of incubation in three separate trials. The values obtained from three separate trials were used to determine the IC50 values using the non-linear regression (curve fit analysis) in GraphPad Prism software (GraphPad Software Inc., USA).
Fig 2
Fig 2. Dose-response curves of CH against Babesia and Theileria parasites in vitro.
The curves show the relative fluorescence units of B. bovis, B. bigemina, B. divergens, B. caballi, and T. equi treated with increasing concentrations of CH. The results were determined via fluorescence assay after 96 h of incubation in three separate trials. The values obtained from three separate trials were used to determine the IC50 values using the non-linear regression (curve fit analysis) in GraphPad Prism software (GraphPad Software Inc., USA).
Fig 3
Fig 3. The morphological changes observed in TC- and CH-treated B. bovis.
The arrows show TC- and CH-treated B. bovis parasites. The micrographs, C, were taken from the untreated wells. TC-a and CH-a were taken from treated wells at 24 h, while TC-b and CH-b were taken at 72 h.
Fig 4
Fig 4. The morphological changes observed in TC- and CH-treated B. caballi.
The arrows show TC- and CH-treated B. caballi parasites. The micrographs, C, were taken from the untreated wells. TC-a and CH-a were taken from treated wells at 24 h, while TC-b and CH-b were taken at 72 h.
Fig 5
Fig 5. The growth inhibition of TC on B. microti in vivo.
The graph shows the inhibitory effects of TC, DA, AQ, and CF treatments as compared with the untreated group. The values plotted indicate the mean ± standard deviation for two separate experiments. The asterisks (*) indicate statistical significance (p < 0.05) based on one-way ANOVA Tukey's test using GraphPad Prism version 5.0 for Windows (GraphPad Software Inc., San Diego, CA, USA). The arrow indicates 5 consecutive days of treatment. Parasitemia was calculated by counting infected RBCs among 2,000 RBCs using Giemsa-stained thin blood smears.
Fig 6
Fig 6. The growth inhibition of TC combinations on B. microti in vivo.
The graph shows the inhibitory effects of DA, AQ, and CF combined with TC treatments as compared with the untreated group. The values plotted indicate the mean ± standard deviation for two separate experiments. The asterisks (*) indicate statistical significance (p < 0.05) based on one-way ANOVA Tukey's test using GraphPad Prism version 5.0 for Windows (GraphPad Software Inc., San Diego, CA, USA). The arrow indicates 5 consecutive days of treatment. Parasitemia was calculated by counting infected RBCs among 2,000 RBCs using Giemsa-stained thin blood smears.
Fig 7
Fig 7. Molecular detection of parasite DNA in the treated groups.
The image shows the molecular detection of parasites in the treated groups. The double distilled water (DDW) is for the untreated- uninfected group which used as a negative control, PC is for the untreated- infected group which used as the positive control, and M is for the marker. The arrow shows the expected band length of 154 bp for positive cases of B. microti.
Fig 8
Fig 8. The changes in blood parameters in treated and untreated mice in vivo.
The graphs show changes in the number of red blood cells (RBCs) (A), hemoglobin concentration (HGB) (B), and hematocrit percentage (HCT) (C) in different groups of treated mice as compared with untreated mice. The values plotted are the mean ± standard deviation for two separate trials. Each group contained five mice. The asterisks (*) indicate statistical significance (p < 0.05) based on one-way ANOVA Tukey's test using GraphPad Prism version 5.0 for Windows (GraphPad Software Inc., San Diego, CA, USA).

References

    1. Bock R, Jackson L, Vos ADE, Jorgensen W (2004) Babesiosis of cattle. Parasitology 129: S247–269 - PubMed
    1. Weiss LM (2002) Babesiosis in humans: a treatment review. Expert Opinion on Pharmacotherapy 3: 1109–1115. 10.1517/14656566.3.8.1109 - DOI - PubMed
    1. Vos AJ, Bock RE (2006) Vaccination against bovine babesiosis. Annals New York Academy of Sciences 916: 540–545. 10.1111/j.1749-6632.2000.tb05333.x - DOI - PubMed
    1. Wise LN, Pelzel-McCluskey AM, Mealey R.H, Knowles DP (2014) Equine piroplasmosis. Veterinary Clinics of North America: Equine Practice 30: 677–693. 10.1016/j.cveq.2014.08.008 - DOI - PubMed
    1. Vannier E, Gewurz BE, Krause PJ (2008) Human babesiosis. Infectious disease clinics of North America 22: 469–488. 10.1016/j.idc.2008.03.010 - DOI - PMC - PubMed

Publication types

MeSH terms