. 2019 Oct 9;21(10):1263-1272.
doi: 10.1093/neuonc/noz096.

Defining EGFR amplification status for clinical trial inclusion

Affiliations

Defining EGFR amplification status for clinical trial inclusion

Pim J French et al. Neuro Oncol. .

Abstract

Background: Precision medicine trials targeting the epidermal growth factor receptor (EGFR) in glioblastoma patients require selection for EGFR-amplified tumors. However, there is currently no gold standard in determining the amplification status of EGFR or variant III (EGFRvIII) expression. Here, we aimed to determine which technique and which cutoffs are suitable to determine EGFR amplification status.

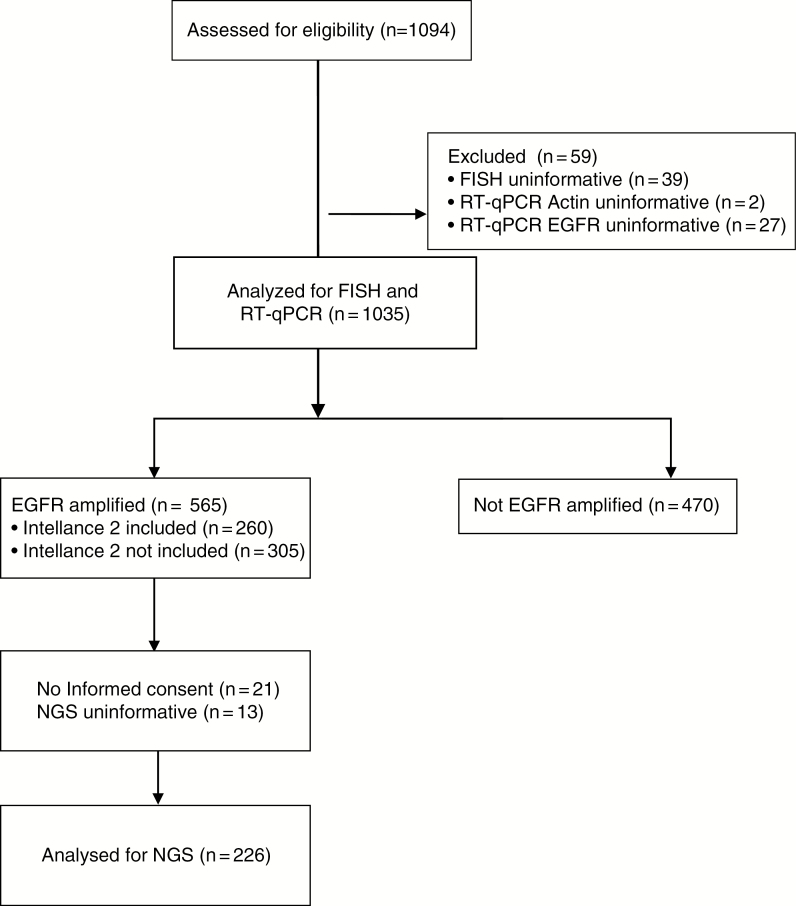
Methods: We compared fluorescence in-situ hybridization (FISH) and real-time quantitative (RT-q)PCR data from patients screened for trial inclusion into the Intellance 2 clinical trial, with data from a panel-based next generation sequencing (NGS) platform (both DNA and RNA).

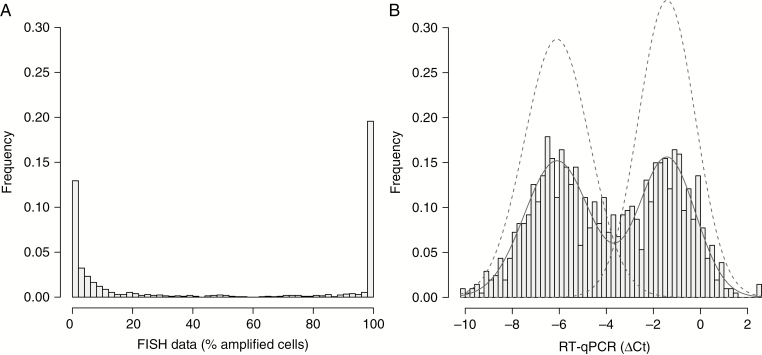
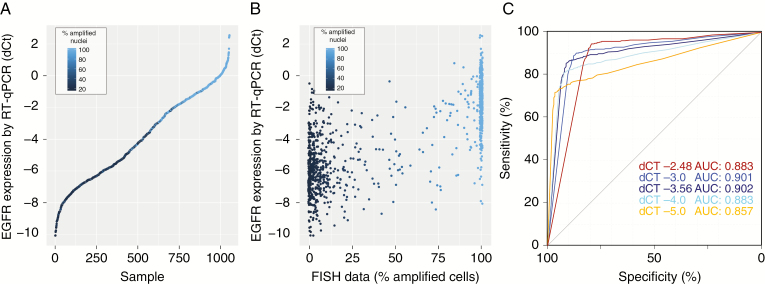
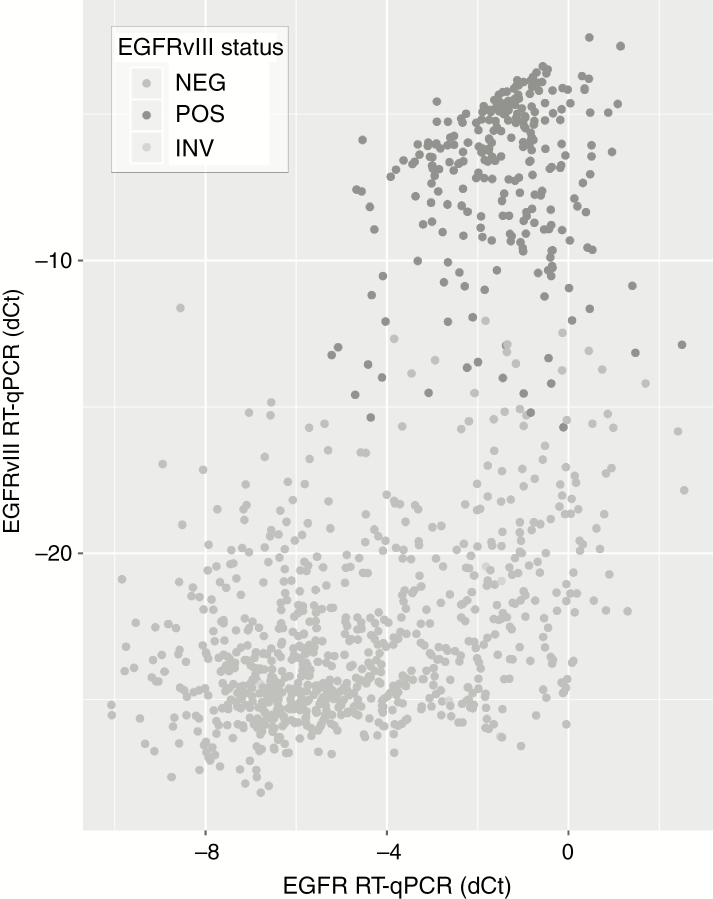
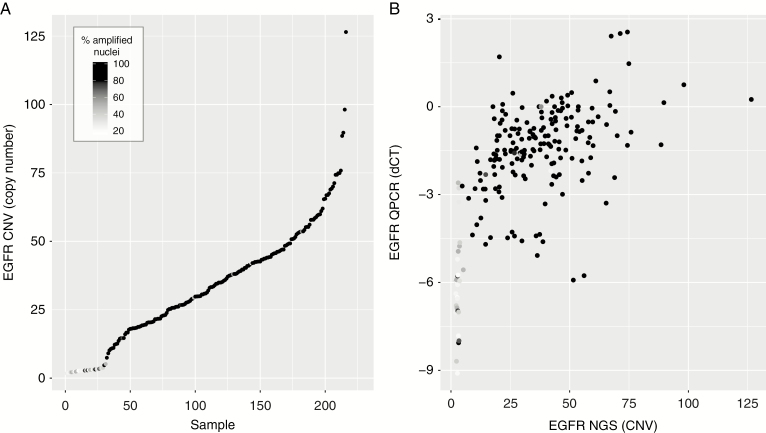
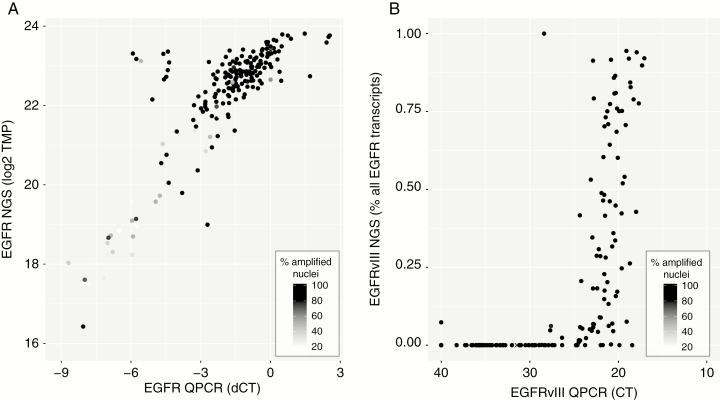
Results: By using data from >1000 samples, we show that at least 50% of EGFR amplified nuclei should be present to define EGFR gene amplification by FISH. Gene amplification (as determined by FISH) correlates with EGFR expression levels (as determined by RT-qPCR) with receiver operating characteristics analysis showing an area under the curve of up to 0.902. EGFR expression as assessed by RT-qPCR therefore may function as a surrogate marker for EGFR amplification. Our NGS data show that EGFR copy numbers can strongly vary between tumors, with levels ranging from 2 to more than 100 copies per cell. Levels exceeding 5 gene copies can be used to define EGFR-amplification by NGS; below this level, FISH detects very few (if any) EGFR amplified nuclei and none of the samples express EGFRvIII.

Conclusion: Our data from central laboratories and diagnostic sequencing facilities, using material from patients eligible for clinical trial inclusion, help define the optimal cutoff for various techniques to determine EGFR amplification for diagnostic purposes.

Keywords: EGFR; EGFRvIII; FISH; amplification; biomarker; glioblastoma; screening.


Figures

Fig. 1
Fig. 1
CONSORT diagram of the study population assessed for biomarkers.
Fig. 2
Fig. 2
Frequency histogram of the percentage of EGFR-amplified nuclei per tumor sample by FISH (A). Note that most samples either contain almost no EGFR-amplified nuclei or almost entirely consist of EGFR-amplified nuclei. The histogram of EGFR RT-qPCR data (B) also shows a bimodal distribution suggesting that RT-qPCR data can also be used to determine EGFR amplification status. Models of the 2 distributions (dashed lines) are plotted on top of the frequency histogram. The intersect of these 2 curves at −3.56 gives highest concordance between FISH and RT-qPCR data. The cutoff value for type I errors in calling EGFR amplification was calculated at −2.48.
Fig. 3
Fig. 3
RT-qPCR can function as a surrogate to determine EGFR amplification status. (A) Ranked ΔCt values from RT-qPCR data show a wide range of EGFR expression between samples. Samples with high EGFR expression often had EGFR amplification. (B) RT-qPCR plotted against the percentage of EGFR-amplified cells per sample highlights the observation that higher percentages of EGFR-amplified cells also express EGFR at higher levels. (C) ROC curves show that EGFR expression can predict EGFR gene amplification by FISH. ROC curves were plotted for 4 different cutoffs (% of EGFR-amplified cells) to determine EGFR amplification by FISH.
Fig. 4
Fig. 4
EGFRvIII expression is found in samples with high levels of EGFR expression. As can be seen, samples that express EGFRvIII (y-axis) are found in samples that have high levels of EGFR expression (x-axis). Dark-gray dots indicate those that have been classified as EGFRvIII positive tumors (ie, Ct values of EGFRvIII <30).
Fig. 5
Fig. 5
Comparison between EGFR amplification as determined by NGS with FISH and RT-qPCR. (A) Ranked copy number estimates by NGS show that samples with low copy numbers also had relatively few EGFR-amplified nuclei (darker points). Note the steep increase from <5 copy numbers to >10 copy numbers. (B) Copy number estimates by NGS correlate with gene expression derived from RT-qPCR. Samples with low copy numbers often had low levels of EGFR expression.
Fig. 6
Fig. 6
RT-qPCR and NGS show high correlation in determining levels of EGFR and presence of EGFRvIII. (A) EGFR expression by RT-qPCR is highly correlated with expression derived from NGS data. (B) Samples in which EGFRvIII expression is identified by RT-qPCR (ie, ΔCt < 30) often also show detectable levels of EGFRvIII by panel-based RNA-seq.

Comment in

References

    1. Brennan CW, Verhaak RG, McKenna A, et al. ; TCGA Research Network The somatic genomic landscape of glioblastoma. Cell. 2013;155(2):462–477. - PMC - PubMed
    1. Ceccarelli M, Barthel FP, Malta TM, et al. ; TCGA Research Network Molecular profiling reveals biologically discrete subsets and pathways of progression in diffuse glioma. Cell. 2016;164(3):550–563. - PMC - PubMed
    1. Turner KM, Deshpande V, Beyter D, et al. . Extrachromosomal oncogene amplification drives tumour evolution and genetic heterogeneity. Nature. 2017;543(7643):122–125. - PMC - PubMed
    1. Lee JC, Vivanco I, Beroukhim R, et al. . Epidermal growth factor receptor activation in glioblastoma through novel missense mutations in the extracellular domain. PLoS Med. 2006;3(12):e485. - PMC - PubMed
    1. Klingler S, Guo B, Yao J, et al. . Development of resistance to EGFR-targeted therapy in malignant glioma can occur through EGFR-dependent and -independent mechanisms. Cancer Res. 2015;75(10):2109–2119. - PMC - PubMed

Publication types

MeSH terms