

Cytokine patterns in critically ill patients undergoing percutaneous tracheostomy
- PMID: 31125429
- PMCID: PMC6718278
- DOI: 10.1111/cei.13333
Cytokine patterns in critically ill patients undergoing percutaneous tracheostomy
Abstract
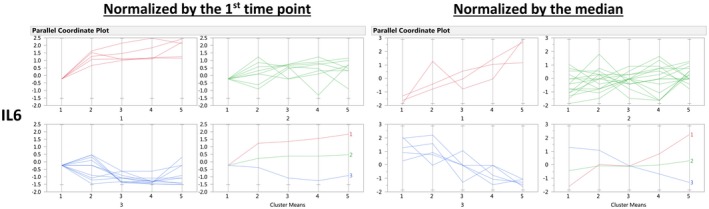
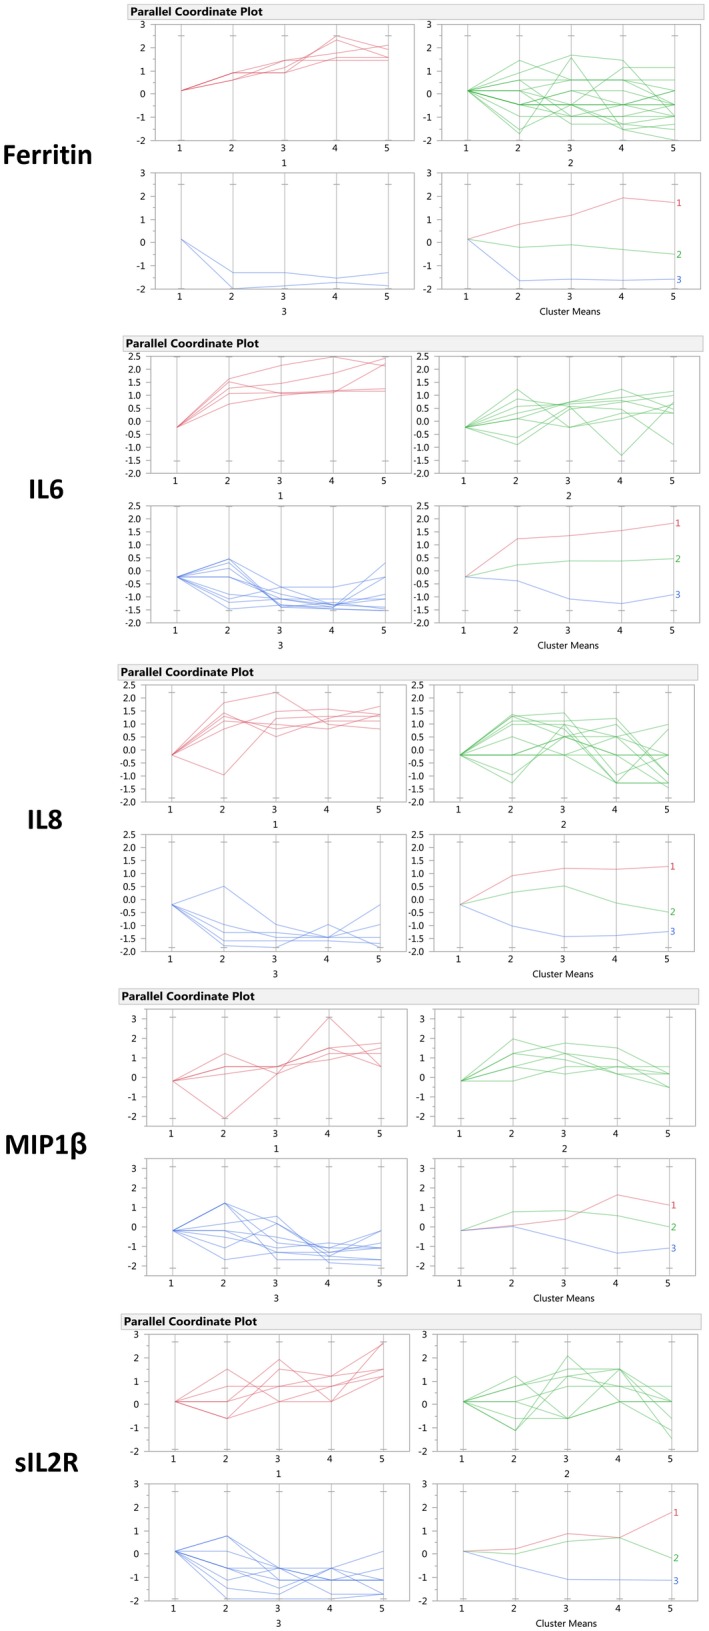
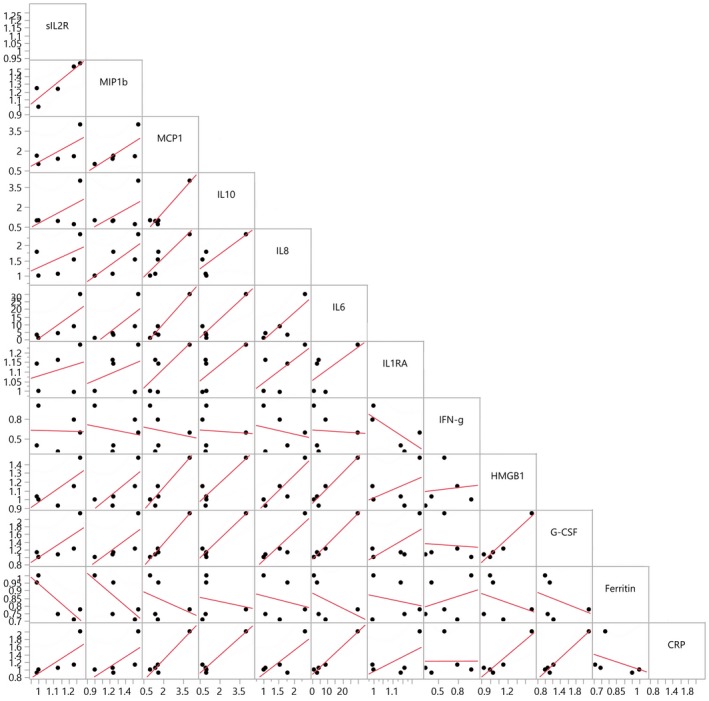
The inflammatory response to acute injury among humans has proved difficult to study due to the significant heterogeneity encountered in actual patients. We set out to characterize the immune response to a model injury with reduced heterogeneity, a tracheostomy, among stable critical care patients, using a broad cytokine panel and clinical data. Twenty-three critical care patients undergoing percutaneous bedside tracheostomies were recruited in a medical intensive care unit. Blood samples were collected at five intervals during 24-h peri-procedure. Patients were followed-up for 28 days for clinical outcomes. There were no statistically significant changes in any of the cytokines between the five time-points when studied as a whole cohort. Longitudinal analysis of the cytokine patterns at the individual patient level with a clustering algorithm showed that, notwithstanding the significant heterogeneity observed, the patients' cytokine responses can be classified into three broad patterns that show increasing, decreasing or no major changes from the baseline. This analytical approach also showed statistically significant associations between cytokines, with those most likely to be associated being interleukin (IL)-6, granulocyte colony-stimulating factor (GCSF) and ferritin, as well as a strong tri-way correlation between GCSF, monocyte chemoattractant protein 1 (MCP1) and macrophage inflammatory protein-1β (MIP1β). In conclusion, in this standard human model of soft tissue injury, by applying longitudinal analysis at the individual level, we have been able to identify the cytokine patterns underlying the seemingly random, heterogeneous patient responses. We have also identified consistent cytokine interactions suggesting that IL-6, GCSF, MCP1 and MIP1β are the cytokines most probably driving the immune response to this injury.
Keywords: critical care; cytokines; human; inflammation; percutaneous tracheostomy.
© 2019 British Society for Immunology.
Conflict of interest statement
The authors declare no conflicts of interest.
Figures
Similar articles
-
Unique cytokine and chemokine responses to exertional heat stroke in mice.J Appl Physiol (1985). 2017 Feb 1;122(2):296-306. doi: 10.1152/japplphysiol.00667.2016. Epub 2016 Dec 1. J Appl Physiol (1985). 2017. PMID: 27909226
-
Early cytokine and chemokine gene expression during Pseudomonas aeruginosa corneal infection in mice.Infect Immun. 1998 Jan;66(1):376-9. doi: 10.1128/IAI.66.1.376-379.1998. Infect Immun. 1998. PMID: 9423885 Free PMC article.
-
Granulocyte Colony Stimulating Factor (GCSF) Can Attenuate Neuropathic Pain by Suppressing Monocyte Chemoattractant Protein-1 (MCP-1) Expression, through Upregulating the Early MicroRNA-122 Expression in the Dorsal Root Ganglia.Cells. 2020 Jul 11;9(7):1669. doi: 10.3390/cells9071669. Cells. 2020. PMID: 32664488 Free PMC article.
-
Involvement of mannose receptor in cytokine interleukin-1beta (IL-1beta), IL-6, and granulocyte-macrophage colony-stimulating factor responses, but not in chemokine macrophage inflammatory protein 1beta (MIP-1beta), MIP-2, and KC responses, caused by attachment of Candida albicans to macrophages.Infect Immun. 1997 Mar;65(3):1077-82. doi: 10.1128/IAI.65.3.1077-1082.1997. Infect Immun. 1997. PMID: 9038318 Free PMC article.
-
A distinct multicytokine profile is associated with anti-cyclical citrullinated peptide antibodies in patients with early untreated inflammatory arthritis.J Rheumatol. 2004 Dec;31(12):2336-46. J Rheumatol. 2004. PMID: 15570632
Cited by
-
Longitudinal patterns of cytokine expression at the individual level in humans after laparoscopic sleeve gastrectomy.J Cell Mol Med. 2020 Jun;24(12):6622-6633. doi: 10.1111/jcmm.15309. Epub 2020 Apr 26. J Cell Mol Med. 2020. PMID: 32336016 Free PMC article.
References
-
- Fry DE. Sepsis, systemic inflammatory response, and multiple organ dysfunction: the mystery continues. Am Surg 2012; 78:1–8. - PubMed
-
- Gustot T. Multiple organ failure in sepsis: prognosis and role of systemic inflammatory response. Curr Opin Crit Care 2011; 17:153–9. - PubMed
-
- Schork NJ. Personalized medicine: time for one‐person trials. Nature 2015; 520:609–11. - PubMed
MeSH terms
Substances
LinkOut - more resources
Full Text Sources
Research Materials
