. 2019;8(2):173-192.
doi: 10.1016/j.jcmgh.2019.05.006. Epub 2019 May 21.

Myeloid Cell-Derived HB-EGF Drives Tissue Recovery After Pancreatitis

Affiliations

Myeloid Cell-Derived HB-EGF Drives Tissue Recovery After Pancreatitis

Hui-Ju Wen et al. Cell Mol Gastroenterol Hepatol. 2019.

Abstract

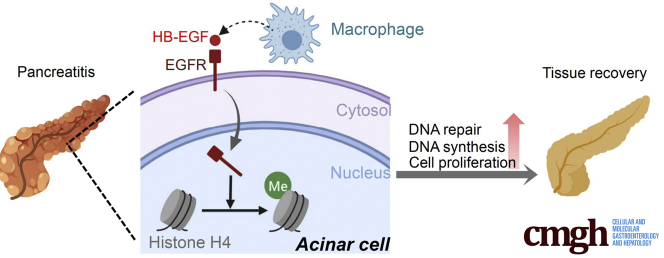
Background & aims: Pancreatitis is a major cause of morbidity and mortality and is a risk factor for pancreatic tumorigenesis. Upon tissue damage, an inflammatory response, made up largely of macrophages, provides multiple growth factors that promote repair. Here, we examine the molecular pathways initiated by macrophages to promote pancreas recovery from pancreatitis.

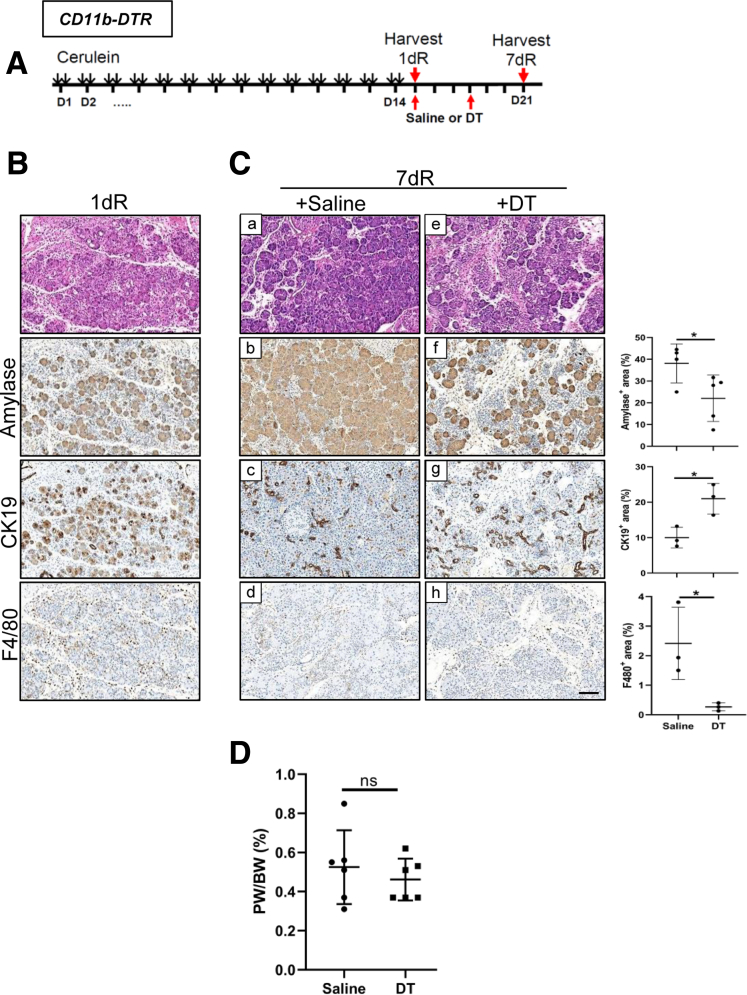
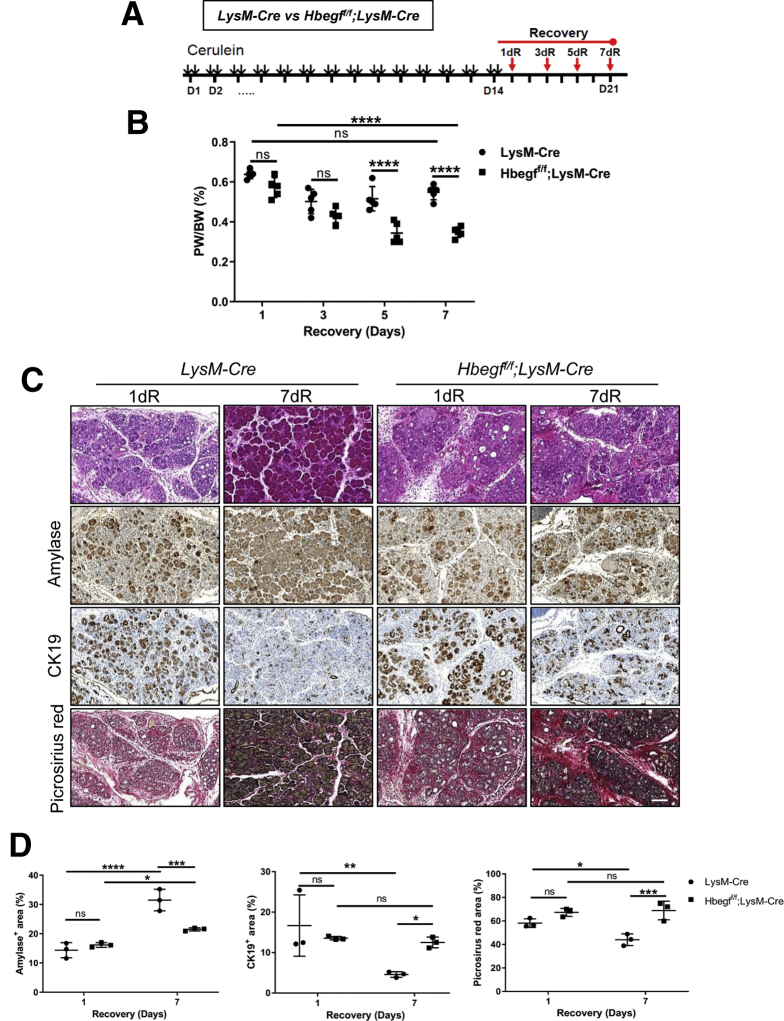
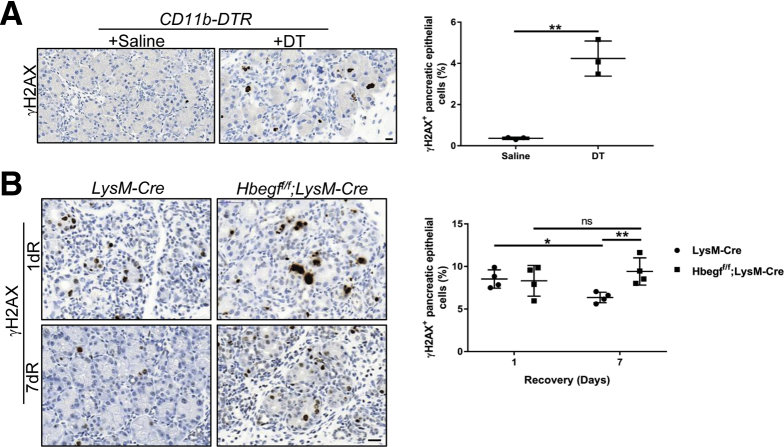
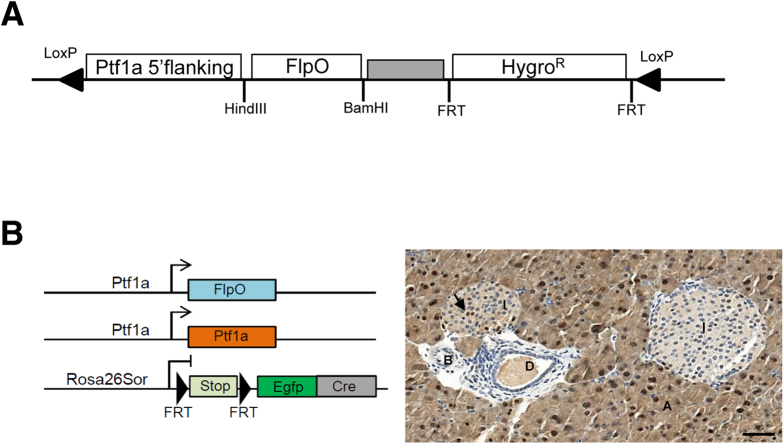
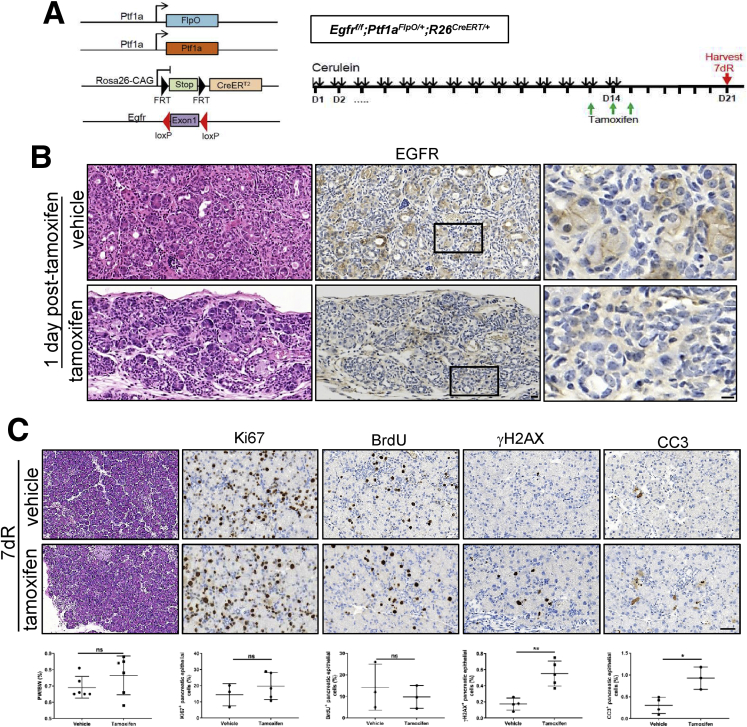
Methods: To induce organ damage, mice were subjected to cerulein-induced experimental pancreatitis and analyzed at various times of recovery. CD11b-DTR mice were used to deplete myeloid cells. Hbegff/f;LysM-Cre mice were used to ablate myeloid cell-derived heparin-binding epidermal growth factor (EGF)-like growth factor (HB-EGF). To ablate EGFR specifically during recovery, pancreatitis was induced in Egfrf/f;Ptf1aFlpO/+;FSF-Rosa26CAG-CreERT2 mice followed by tamoxifen treatment.

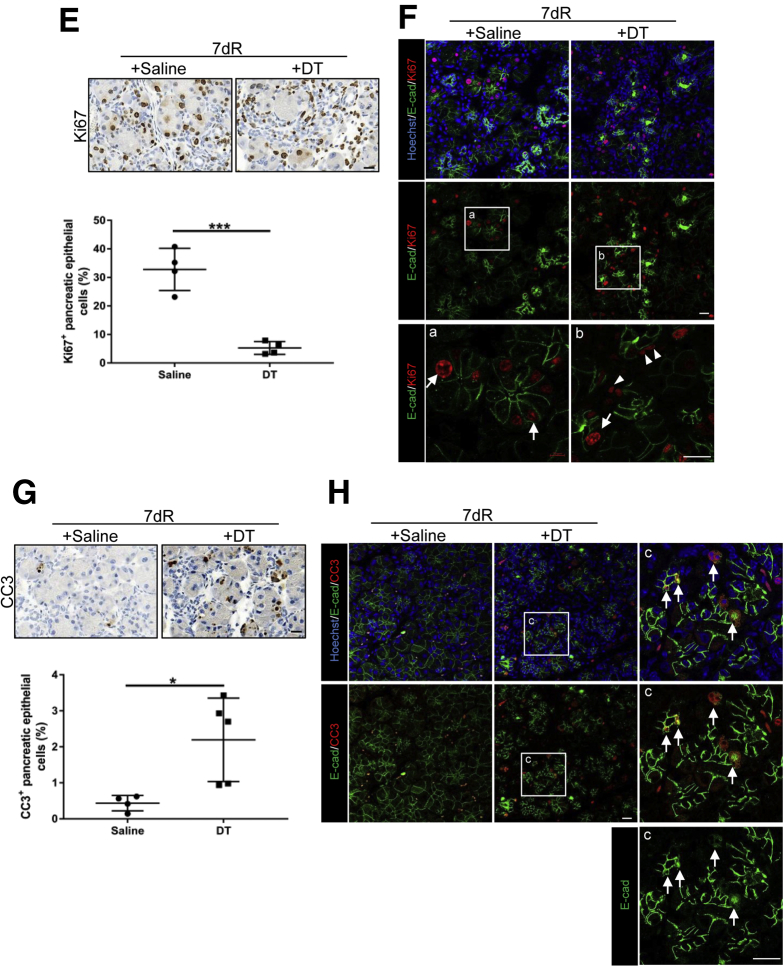
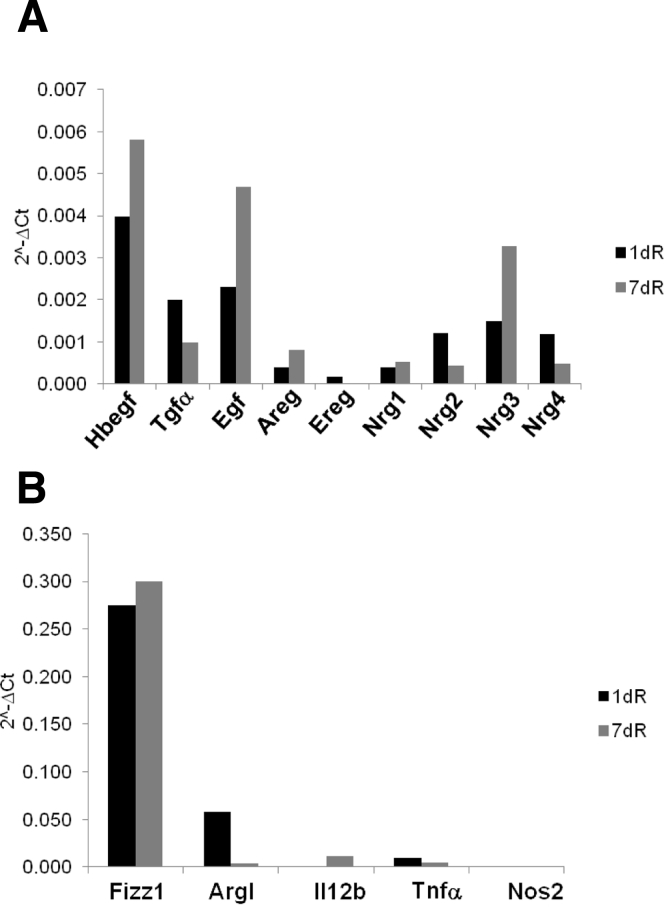
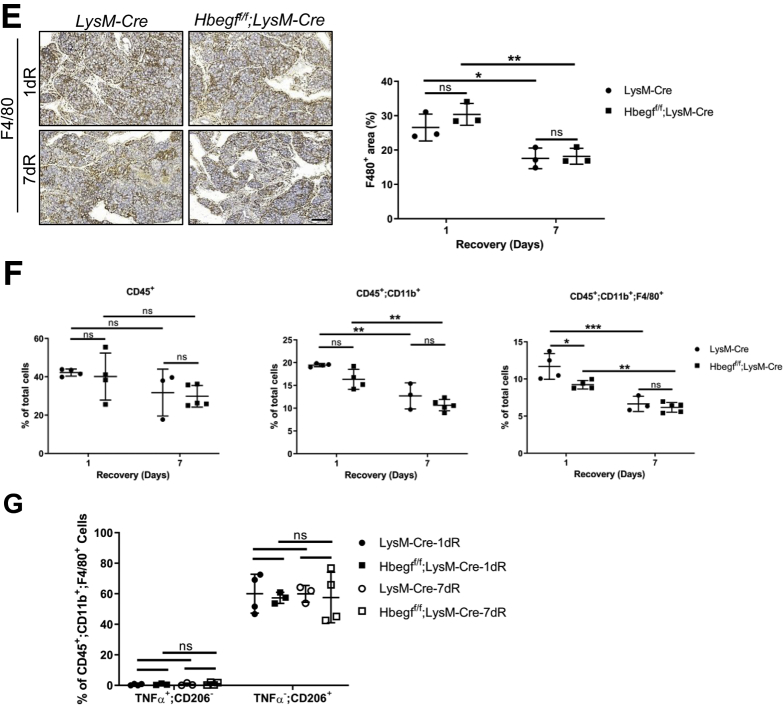
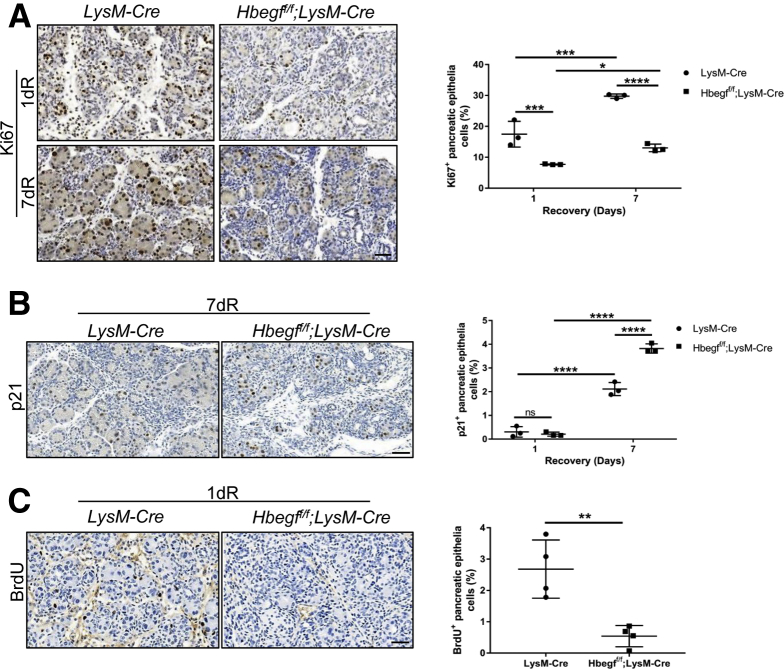
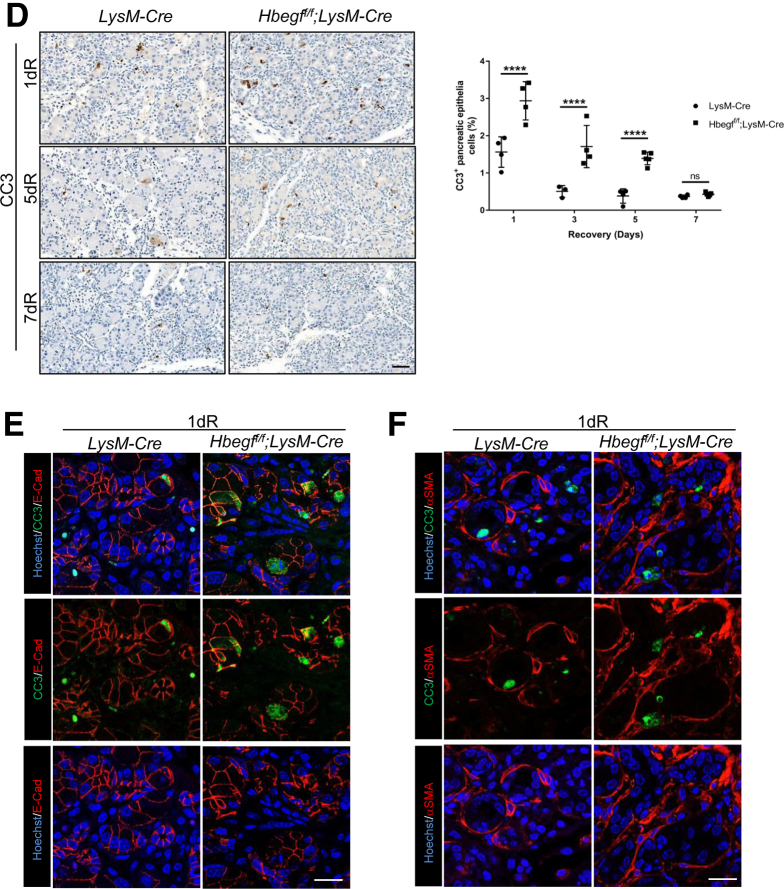
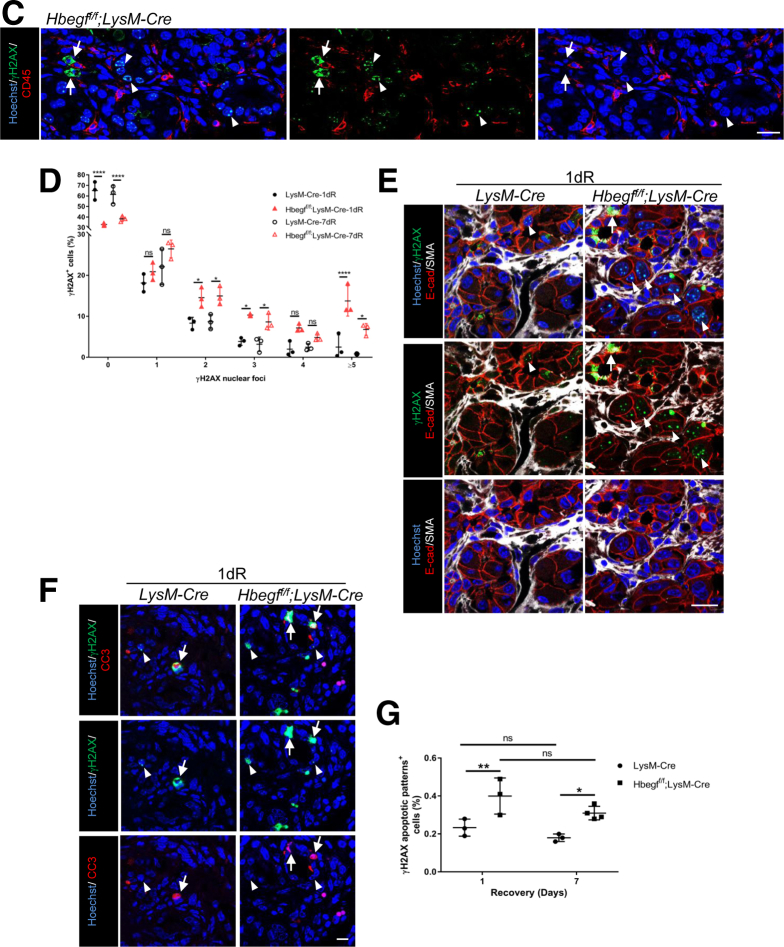
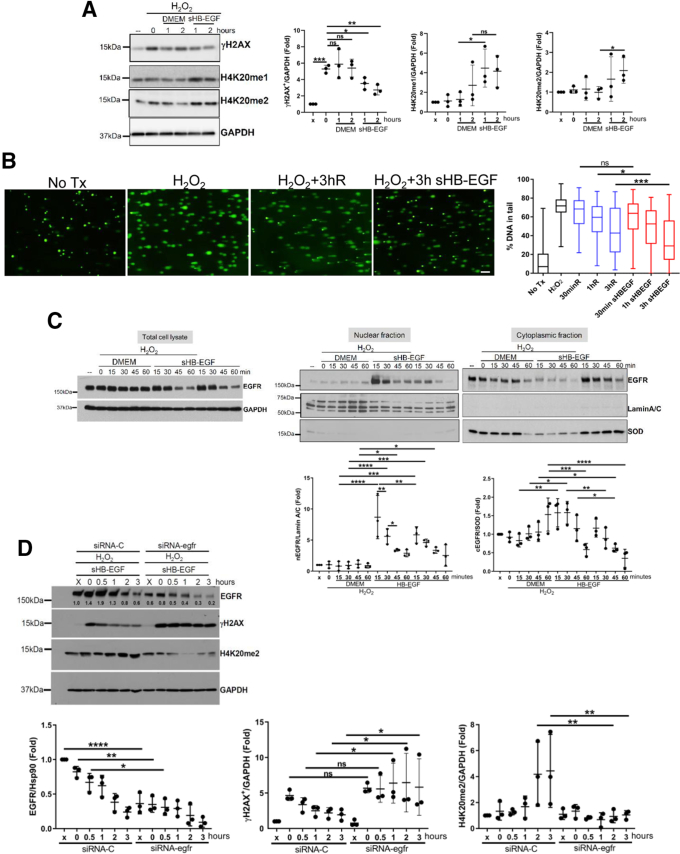
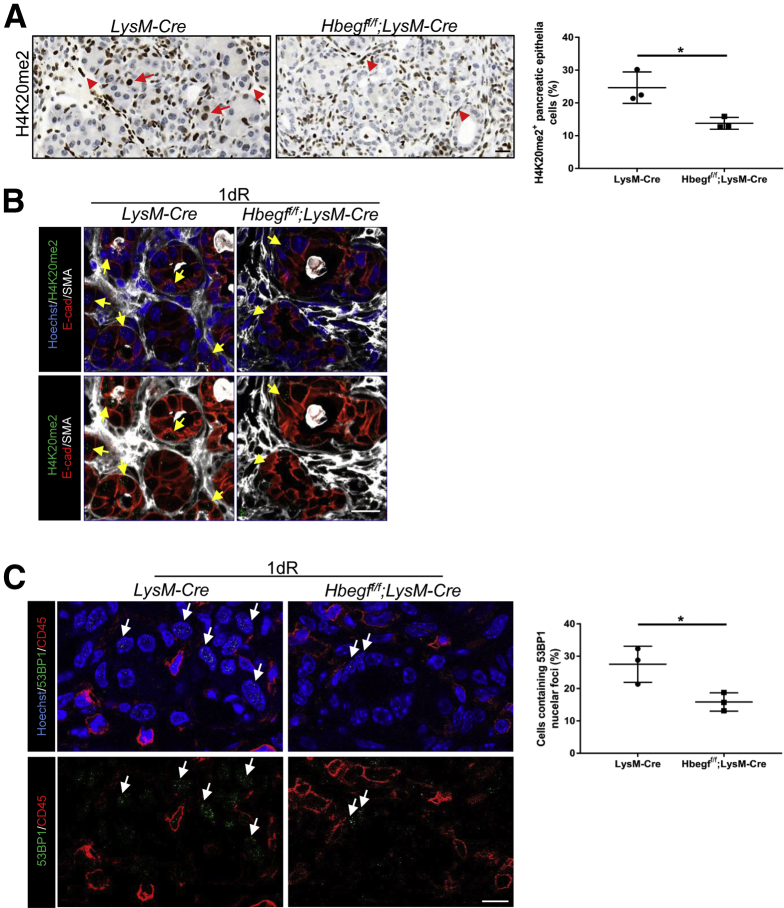
Results: Macrophages infiltrating the pancreas in experimental pancreatitis make high levels of HB-EGF. Both depletion of myeloid cells and ablation of myeloid cell HB-EGF delayed recovery from experimental pancreatitis, resulting from a decrease in cell proliferation and an increase in apoptosis. Mechanistically, ablation of myeloid cell HB-EGF impaired epithelial cell DNA repair, ultimately leading to cell death. Soluble HB-EGF induced EGFR nuclear translocation and methylation of histone H4, facilitating resolution of DNA damage in pancreatic acinar cells in vitro. Consistent with its role as the primary receptor of HB-EGF, in vivo ablation of EGFR from pancreatic epithelium during recovery from pancreatitis resulted in accumulation of DNA damage.

Conclusions: By using novel conditional knockout mouse models, we determined that HB-EGF derived exclusively from myeloid cells induces epithelial cell proliferation and EGFR-dependent DNA repair, facilitating pancreas healing after injury.

Keywords: DNA Damage; EGFR; Inflammation; Macrophages.


Figures

None
Graphical abstract
Figure 1
Figure 1
Depletion of myeloid cells impairs pancreatic recovery from experimental pancreatitis. (A) Schematic of cerulein treatment protocol for CD11b-DTR mice. (B and C) H&E staining and IHC for amylase, CK19, and F4/80 on pancreas sections from CD11b-DTR mice treated with cerulein for 2 weeks followed by (B) 1-day recovery (1dR) and (C) 7-day recovery (7dR). Scale bar: 100 μm. Quantitation of IHC for amylase, CK19, and F4/80 on pancreata from saline and DT-treated mice (n = 3). (D) Analysis of pancreas-to-body weight ratios (PW/BW) of CD11b-DTR mice with saline or DT treatment (n = 6). (E and G) IHC for Ki67 and CC3 on pancreata after 7-day recovery. Scale bar: 20 μm. Quantitation of IHC for Ki67-positive (n = 4) and CC3-positive (n ≥ 4) epithelial cells. (F and H) Representative immunofluorescent images for E-cadherin (E-cad) (green), Hoechst33342 (blue), and (F) Ki67 or (H) CC3 (red) on 7-day recovery pancreata from CD11b-DTR mice. Arrows indicate epithelial cells. Arrowheads indicate nonepithelial cells. Scale bar: 20 μm. Significance was calculated using an unpaired t test. *P < .05, ***P < .001. CC3, cleaved caspase-3.
Figure 1
Figure 1
Depletion of myeloid cells impairs pancreatic recovery from experimental pancreatitis. (A) Schematic of cerulein treatment protocol for CD11b-DTR mice. (B and C) H&E staining and IHC for amylase, CK19, and F4/80 on pancreas sections from CD11b-DTR mice treated with cerulein for 2 weeks followed by (B) 1-day recovery (1dR) and (C) 7-day recovery (7dR). Scale bar: 100 μm. Quantitation of IHC for amylase, CK19, and F4/80 on pancreata from saline and DT-treated mice (n = 3). (D) Analysis of pancreas-to-body weight ratios (PW/BW) of CD11b-DTR mice with saline or DT treatment (n = 6). (E and G) IHC for Ki67 and CC3 on pancreata after 7-day recovery. Scale bar: 20 μm. Quantitation of IHC for Ki67-positive (n = 4) and CC3-positive (n ≥ 4) epithelial cells. (F and H) Representative immunofluorescent images for E-cadherin (E-cad) (green), Hoechst33342 (blue), and (F) Ki67 or (H) CC3 (red) on 7-day recovery pancreata from CD11b-DTR mice. Arrows indicate epithelial cells. Arrowheads indicate nonepithelial cells. Scale bar: 20 μm. Significance was calculated using an unpaired t test. *P < .05, ***P < .001. CC3, cleaved caspase-3.
Figure 2
Figure 2
Experimental pancreatitis is abundantly infiltrated with alternatively activated macrophages expressing EGFR ligands. Total RNA of macrophages (CD45+;CD11b+;F4/80+) was isolated from a pool of pancreata (4–5 pancreata/cohort) treated with cerulein after recovery for 1 or 7 days and analyzed by reverse-transcription quantitative PCR for (A) EGFR ligands and (B) macrophage markers. Alternatively activated macrophage markers are found in inflammatory zone protein (Fizz1) and arginase I (ArgI). Classically activated macrophage markers are Il12b, Tnfα, and nitric oxide synthase 2 (Nos2). Areg, amphiregulin; Egf, epidermal growth factor; Ereg, epiregulin; Tgf-α, transforming growth factor α; Nrg, neuregulin.
Figure 3
Figure 3
Ablation of HB-EGF from myeloid cells results in continuing pancreatic atrophy during recovery. (A) Schematic of cerulein treatment protocol for LysM-Cre and Hbegff/f;LysM-Cre mice. (B) Analysis of pancreas-to-body weight ratios (PW/BW) of mice with 2-week cerulein treatment and recovery for 1, 3, 5, and 7 days (n = 5). Significance was calculated by 2-way analysis of variance with the Tukey multiple comparison. (C and E) Pancreas sections were analyzed by H&E staining and IHC for amylase, CK19, picrosirius red, and F4/80. Scale bars: (C) 100 μm, (E) 200 μm. (D and E) Quantitation of amylase-positive area, CK19-positive area, picrosirius red–positive area, and F4/80 positive area (n = 3). Significance was calculated using 2-way analysis of variance with Fisher’s LSD (least significant difference). (F and G) Pancreas sections were analyzed for immune cells by flow cytometry. (F) Percentage of immune cells (CD45+), myeloid cells (CD45+;CD11b+), and macrophages (CD45+;CD11b+;F4/80+) is indicated. (G) Macrophages (CD45+;CD11b+;F4/80+) were analyzed further for different subtypes by labeling with TNF-α and CD206 antibodies (n ≥ 3). Significance was calculated by 2-way analysis of variance with Tukey multiple comparison. *P < .05, **P < .01, ***P < .001, and ****P < .0001.
Figure 3
Figure 3
Ablation of HB-EGF from myeloid cells results in continuing pancreatic atrophy during recovery. (A) Schematic of cerulein treatment protocol for LysM-Cre and Hbegff/f;LysM-Cre mice. (B) Analysis of pancreas-to-body weight ratios (PW/BW) of mice with 2-week cerulein treatment and recovery for 1, 3, 5, and 7 days (n = 5). Significance was calculated by 2-way analysis of variance with the Tukey multiple comparison. (C and E) Pancreas sections were analyzed by H&E staining and IHC for amylase, CK19, picrosirius red, and F4/80. Scale bars: (C) 100 μm, (E) 200 μm. (D and E) Quantitation of amylase-positive area, CK19-positive area, picrosirius red–positive area, and F4/80 positive area (n = 3). Significance was calculated using 2-way analysis of variance with Fisher’s LSD (least significant difference). (F and G) Pancreas sections were analyzed for immune cells by flow cytometry. (F) Percentage of immune cells (CD45+), myeloid cells (CD45+;CD11b+), and macrophages (CD45+;CD11b+;F4/80+) is indicated. (G) Macrophages (CD45+;CD11b+;F4/80+) were analyzed further for different subtypes by labeling with TNF-α and CD206 antibodies (n ≥ 3). Significance was calculated by 2-way analysis of variance with Tukey multiple comparison. *P < .05, **P < .01, ***P < .001, and ****P < .0001.
Figure 4
Figure 4
Myeloid HB-EGF is required for parenchymal cell survival. (A–D) IHC (left) for Ki67, p21, BrdU, and CC3 on pancreas sections from LysM-Cre and Hbegff/f;LysM-Cre mice with 1 or 7 days of recovery after 2-week cerulein treatment. Scale bars: 50 μm. Quantitation (right) of Ki67, p21, BrdU, and cleaved caspase 3 (CC3)-positive pancreatic epithelial cells (n ≥ 3). Significance was calculated (C) using an unpaired t test and (A, B, D) 2-way analysis of variance with Fisher’s least significant difference (LSD). (E and F) Representative immunofluorescent images for (E) CC3 (green), Hoechst33342 (blue), and E-cadherin (E-cad) (red) or (F) α-smooth muscle actin (α-SMA) (red) on 1-day recovery pancreata of LysM-Cre and Hbegff/f;LysM-Cre mice. Scale bar: 20 μm. ∗P < .05; ∗∗P < .01; ∗∗∗P < .001; and ∗∗∗∗P < .0001.
Figure 4
Figure 4
Myeloid HB-EGF is required for parenchymal cell survival. (A–D) IHC (left) for Ki67, p21, BrdU, and CC3 on pancreas sections from LysM-Cre and Hbegff/f;LysM-Cre mice with 1 or 7 days of recovery after 2-week cerulein treatment. Scale bars: 50 μm. Quantitation (right) of Ki67, p21, BrdU, and cleaved caspase 3 (CC3)-positive pancreatic epithelial cells (n ≥ 3). Significance was calculated (C) using an unpaired t test and (A, B, D) 2-way analysis of variance with Fisher’s least significant difference (LSD). (E and F) Representative immunofluorescent images for (E) CC3 (green), Hoechst33342 (blue), and E-cadherin (E-cad) (red) or (F) α-smooth muscle actin (α-SMA) (red) on 1-day recovery pancreata of LysM-Cre and Hbegff/f;LysM-Cre mice. Scale bar: 20 μm. ∗P < .05; ∗∗P < .01; ∗∗∗P < .001; and ∗∗∗∗P < .0001.
Figure 5
Figure 5
Ablation of myeloid HB-EGF slows DNA damage repair in parenchymal cells. (A and B) IHC for γH2AX on pancreas sections from (A) CD11b-DTR mice with 7-day recovery and (B) LysM-Cre and Hbegff/f;LysM-Cre mice with 1 and 7 days of recovery. Scale bar: 20 μm. Quantitation of γH2AX-positive pancreatic epithelial cells (n ≥ 3). (C) Representative immunofluorescent images for γH2AX (green), CD45 (red), and Hoechst33342 (blue) on pancreas sections of Hbegff/f;LysM-Cre mice with 2-week cerulein and 1-day recovery. Scale bar: 20 μm. (D) Quantitation of γH2AX nuclear foci (n = 3). CD45+ immune cells (red) were excluded from quantitation. (E and F) Representative immunofluorescent images for Hoechst33342 (blue), γH2AX (green), α-smooth muscle actin (SMA) (white), and (E) E-cad or (F) cleaved caspase 3 (CC3) (red) on 1-day recovery pancreata of LysM-Cre and Hbegff/f;LysM-Cre mice. Arrowheads indicate γH2AX nuclear punctate dots. Arrows indicate γH2AX apoptotic patterns. Scale bars: (E) 20 μm, (F) 10 μm. (G) Quantitation of γH2AX apoptotic patterns includes cells containing γH2AX-ring staining, nuclear pan staining, and staining on apoptotic bodies (n = 3). Significance was calculated using 2-way analysis of variance with Tukey multiple comparison. *P < .05, **P < .01, and ****P < .0001.
Figure 5
Figure 5
Ablation of myeloid HB-EGF slows DNA damage repair in parenchymal cells. (A and B) IHC for γH2AX on pancreas sections from (A) CD11b-DTR mice with 7-day recovery and (B) LysM-Cre and Hbegff/f;LysM-Cre mice with 1 and 7 days of recovery. Scale bar: 20 μm. Quantitation of γH2AX-positive pancreatic epithelial cells (n ≥ 3). (C) Representative immunofluorescent images for γH2AX (green), CD45 (red), and Hoechst33342 (blue) on pancreas sections of Hbegff/f;LysM-Cre mice with 2-week cerulein and 1-day recovery. Scale bar: 20 μm. (D) Quantitation of γH2AX nuclear foci (n = 3). CD45+ immune cells (red) were excluded from quantitation. (E and F) Representative immunofluorescent images for Hoechst33342 (blue), γH2AX (green), α-smooth muscle actin (SMA) (white), and (E) E-cad or (F) cleaved caspase 3 (CC3) (red) on 1-day recovery pancreata of LysM-Cre and Hbegff/f;LysM-Cre mice. Arrowheads indicate γH2AX nuclear punctate dots. Arrows indicate γH2AX apoptotic patterns. Scale bars: (E) 20 μm, (F) 10 μm. (G) Quantitation of γH2AX apoptotic patterns includes cells containing γH2AX-ring staining, nuclear pan staining, and staining on apoptotic bodies (n = 3). Significance was calculated using 2-way analysis of variance with Tukey multiple comparison. *P < .05, **P < .01, and ****P < .0001.
Figure 6
Figure 6
Soluble HB-EGF promotes DNA repair through EGFR in vitro. (A and C) The 266.6 cells were exposed to 500 μmol/L H2O2 for 1 hour followed by treatment with/without sHB-EGF for the indicated times. (A) Whole-cell lysates were analyzed by immunoblotting for γH2AX, H4K20me1, H4K20me2, and glyceraldehyde-3-phosphate dehydrogenase (GAPDH) (a loading control). (C) Cytosolic and nuclear fractions were isolated from 266.6 cell lysates. EGFR was analyzed by immunoblotting. Lamin A/C and β-tubulin were used as loading and purity controls for nuclear and cytosolic fractions, respectively. (B) Representative images of comet assay from 266.6 cells treated with nothing (no Tx) or H2O2 in serum-free DMEM for 1 hour followed by 3-hour recovery in DMEM (H2O2+3hR) or sHB-EGF supplement (H2O2+3h sHB-EGF). Quantitation of DNA in the comet tail was performed by analyzing 150 cells for each sample from 3 separate independent experiments. Scale bar: 200 μm. (D) EGFR knockdown was performed in 266.6 cells transfected with siRNA control (siRNA-C) or siRNA against EGFR (siRNA-egfr). At 48 hours after transfection, cells were treated with H2O2 for 1 hour followed by HB-EGF treatment for the indicated time. Cell lysates were analyzed by immunoblotting for EGFR, γH2AX, H4K20me2, and GAPDH. Significance was calculated by 1-way analysis of variance with (A, C, D) Fisher’s LSD and (B) with Tukey multiple comparison test. *P < .05, **P < .01, ***P < .001, and ****P < .0001.
Figure 7
Figure 7
Myeloid HB-EGF activates the DNA repair process in pancreatitis in vivo. (A and B) IHC for H4K20me2 and representative immunofluorescent images for Hoechst33342 (blue), α-smooth muscle actin (SMA) (white), E-cadherin (E-cad) (red), and H4K20me2 (green) on 1-day recovery pancreatic sections of LysM-Cre and Hbegff/f;LysM-Cre mice. Arrowheads and arrows show H4K20me2-positive staining in stromal and epithelial cells, respectively. Scale bars: 20 μm. Quantitation of H4K20me2-positive epithelial cells (n = 3). (C) Representative immunofluorescent images for Hoechst33342 (blue), CD45 (red), and 53BP1 (green) on 1-day recovery pancreatic section of LysM-Cre and Hbegff/f;LysM-Cre mice. White arrows show nuclear foci of 53BP1. Scale bar: 10 μm. Quantitation of 53BP1-positive cells. CD45+ cells were excluded from quantitation. Significance was calculated using an unpaired t test. *P < .05.
Figure 8
Figure 8
FlpO-mediated recombination on pancreas. (A) Design of the Ptf1aFlpO(HygroR) cassette exchange vector. The FlpO open reading frame was inserted into an exchange vector containing 2 inverted LoxP sites and used to perform recombinase-mediated cassette exchange in embryonic stem cells containing a loxed cassette acceptor allele in the Ptf1a gene locus that also had 2 inverted LoxP sites. A hygromycin resistance gene (HygroR), flanked by tandem FRT sites, was inserted at the 3’-end of the exchange vector for positive selection during recombinase-mediated cassette exchange. Gray box, rabbit β-globin intron 2 plus 3’-untranslated region. (B) IHC for green fluorescent protein (GFP) visualized the expression of EGFP-Cre fusion protein in the pancreas of a 6-week-old Ptf1aFlpO/+;R26MASTR reporter mouse. The arrow shows a GFP-positive cell in the islet. Scale bar: 50 μm. A, acini; B, blood vessel; D, pancreatic duct; I, islet.
Figure 9
Figure 9
Ablation of EGFR during recovery from pancreatitis delays resolution of DNA damage. (A) Genetic strategy and schematic of cerulein treatment protocol to ablate Egfr from the parenchyma by tamoxifen-mediated activation of CreERT2. Pancreata were harvested after 7 days of recovery after cerulein (red arrow). (B) H&E staining and IHC for EGFR on pancreata of Egfrf/f;Ptf1aFlpO/+;R26CreERT/+ mice were harvested 1 day after vehicle/tamoxifen treatment after 2 weeks of cerulein. The boxs are the magnified area. Scale bar: 20 μm. (C) Pancreas sections were analyzed by H&E staining and IHC for Ki67, BrdU, γH2AX, and cleaved caspase 3 (CC3) on 7-day recovery pancreata of Egfrf/f;Ptf1aFlpO/+;R26CreERT/+ mice treated with 2 weeks of cerulein followed by vehicle or tamoxifen treatment (n > 3). Scale bar: 50 μm. Significance was calculated using an unpaired t test. *P < .05, **P < .01.

Similar articles

Cited by

References

    1. Kleeff J., Whitcomb D.C., Shimosegawa T., Esposito I., Lerch M.M., Gress T., Mayerle J., Drewes A.M., Rebours V., Akisik F., Munoz J.E.D., Neoptolemos J.P. Chronic pancreatitis. Nat Rev Dis Primers. 2017;3:17060. - PubMed
    1. Yadav D., Lowenfels A.B. The epidemiology of pancreatitis and pancreatic cancer. Gastroenterology. 2013;144:1252–1261. - PMC - PubMed
    1. Machicado J.D., Yadav D. Epidemiology of recurrent acute and chronic pancreatitis: similarities and differences. Dig Dis Sci. 2017;62:1683–1691. - PMC - PubMed
    1. Seifert L., Werba G., Tiwari S., Giao Ly N.N., Alothman S., Alqunaibit D., Avanzi A., Barilla R., Daley D., Greco S.H., Torres-Hernandez A., Pergamo M., Ochi A., Zambirinis C.P., Pansari M., Rendon M., Tippens D., Hundeyin M., Mani V.R., Hajdu C., Engle D., Miller G. The necrosome promotes pancreatic oncogenesis via CXCL1 and Mincle-induced immune suppression. Nature. 2016;532:245–249. - PMC - PubMed
    1. Bockman D.E., Boydston W.R., Anderson M.C. Origin of tubular complexes in human chronic pancreatitis. Am J Surg. 1982;144:243–249. - PubMed

Publication types