

An Oncolytic Adenovirus Targeting Transforming Growth Factor β Inhibits Protumorigenic Signals and Produces Immune Activation: A Novel Approach to Enhance Anti-PD-1 and Anti-CTLA-4 Therapy
- PMID: 31126191
- PMCID: PMC6761593
- DOI: 10.1089/hum.2019.059
An Oncolytic Adenovirus Targeting Transforming Growth Factor β Inhibits Protumorigenic Signals and Produces Immune Activation: A Novel Approach to Enhance Anti-PD-1 and Anti-CTLA-4 Therapy
Abstract
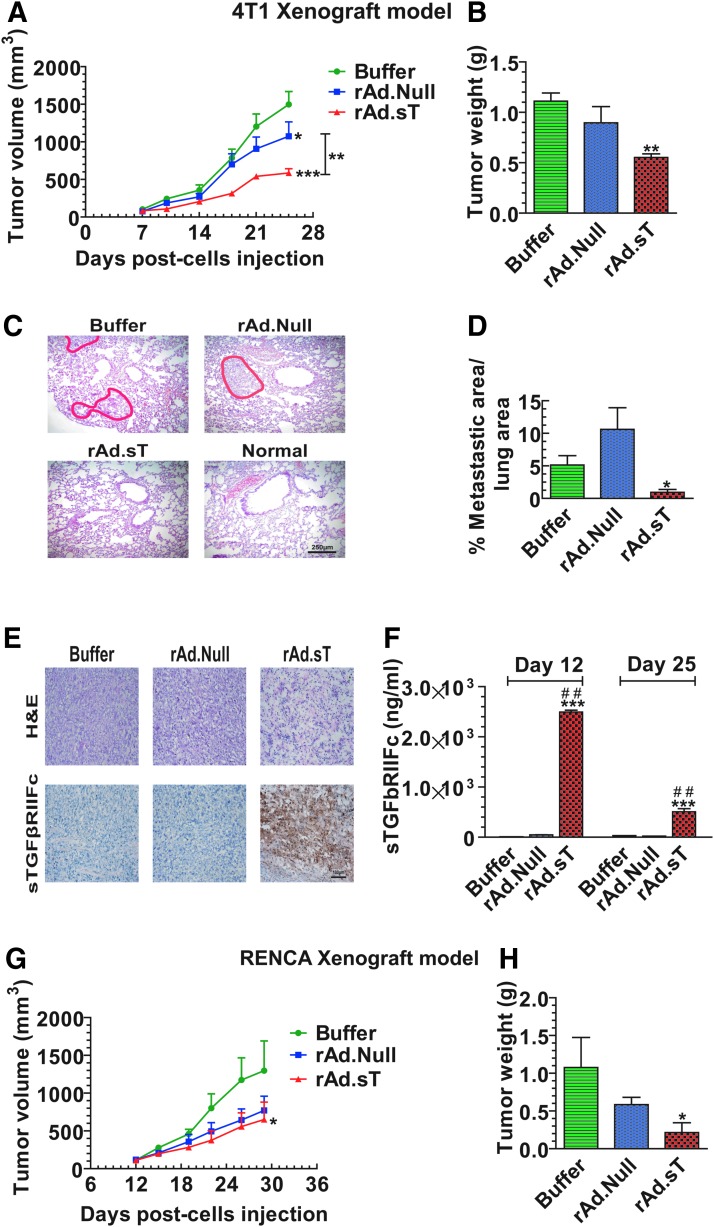
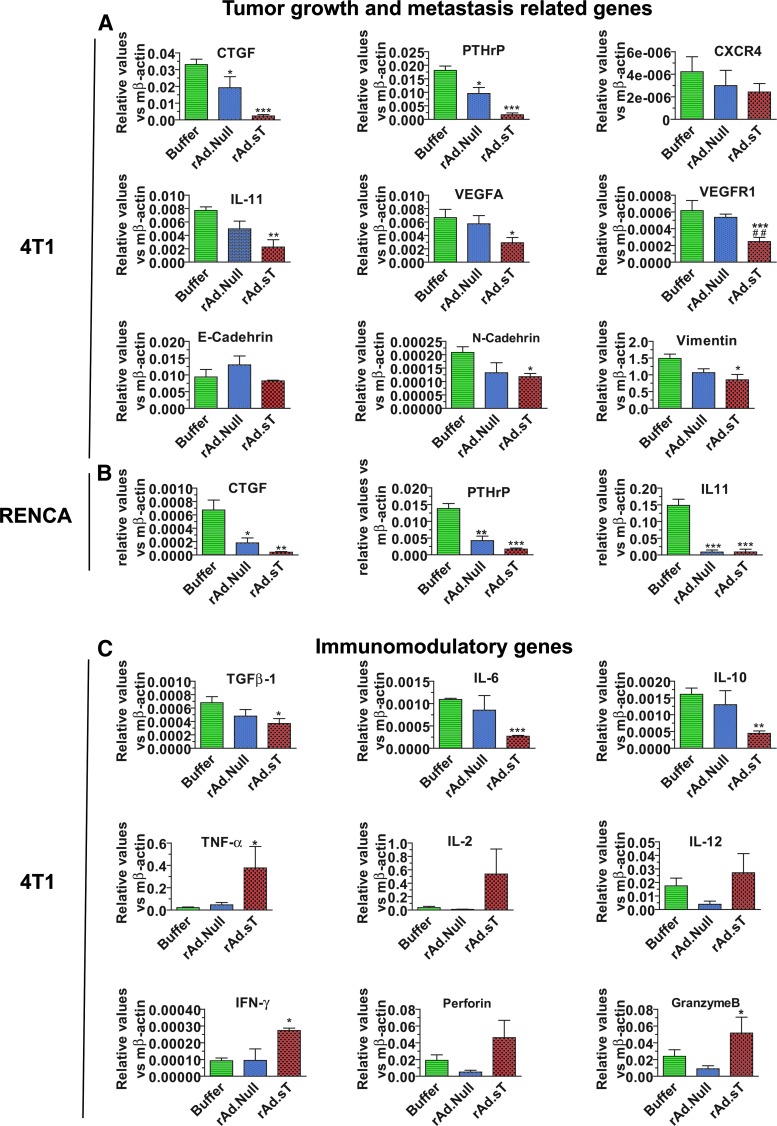
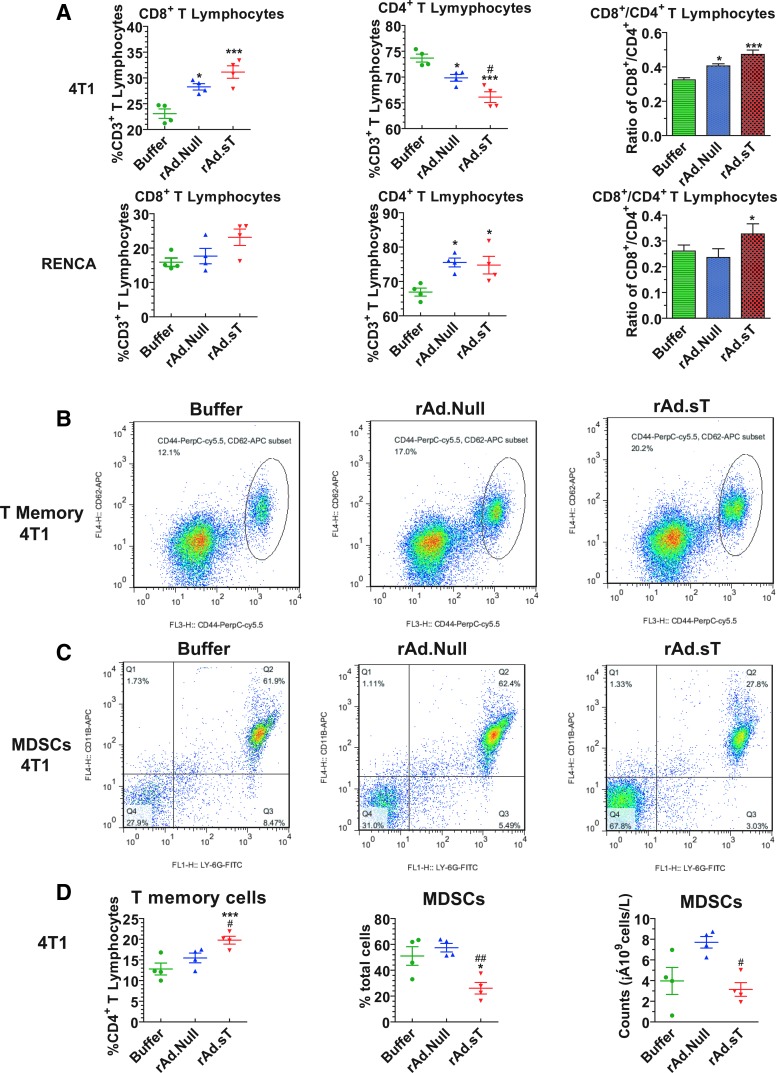
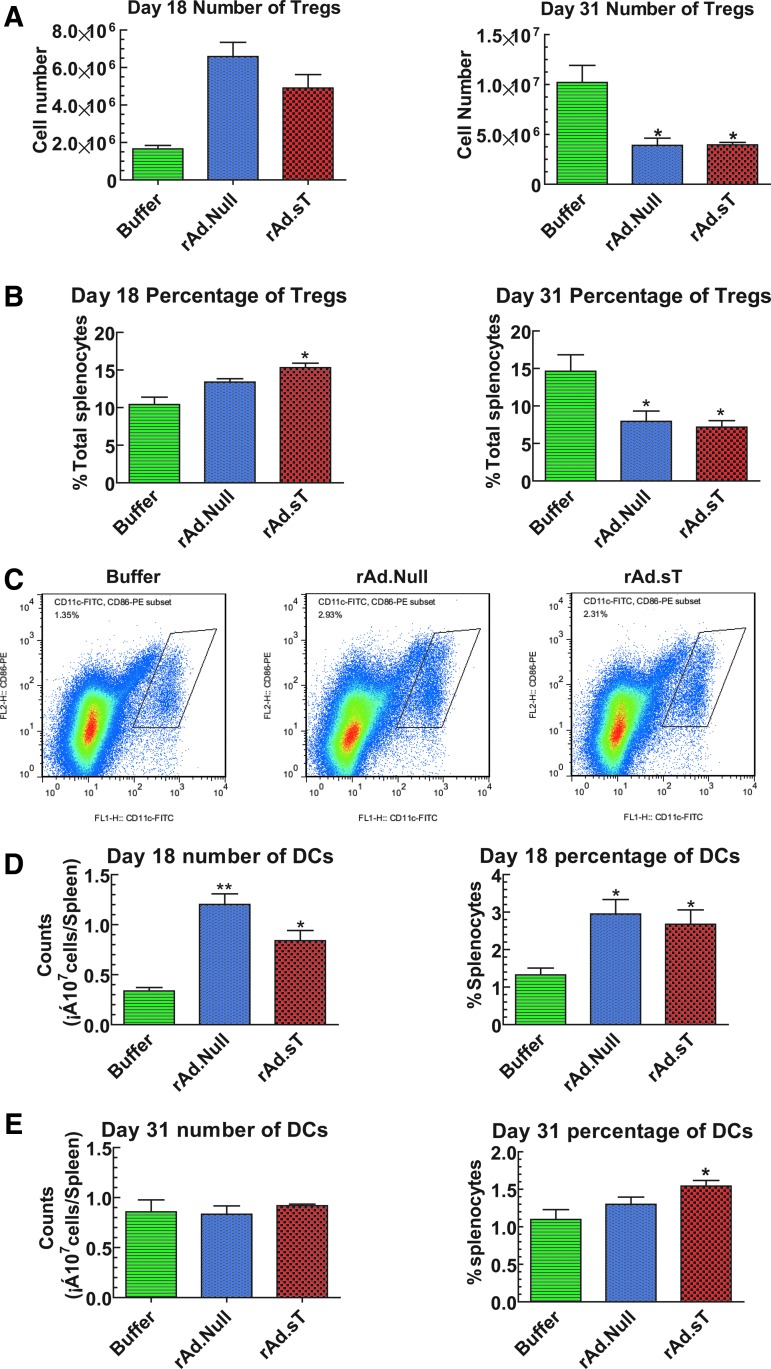
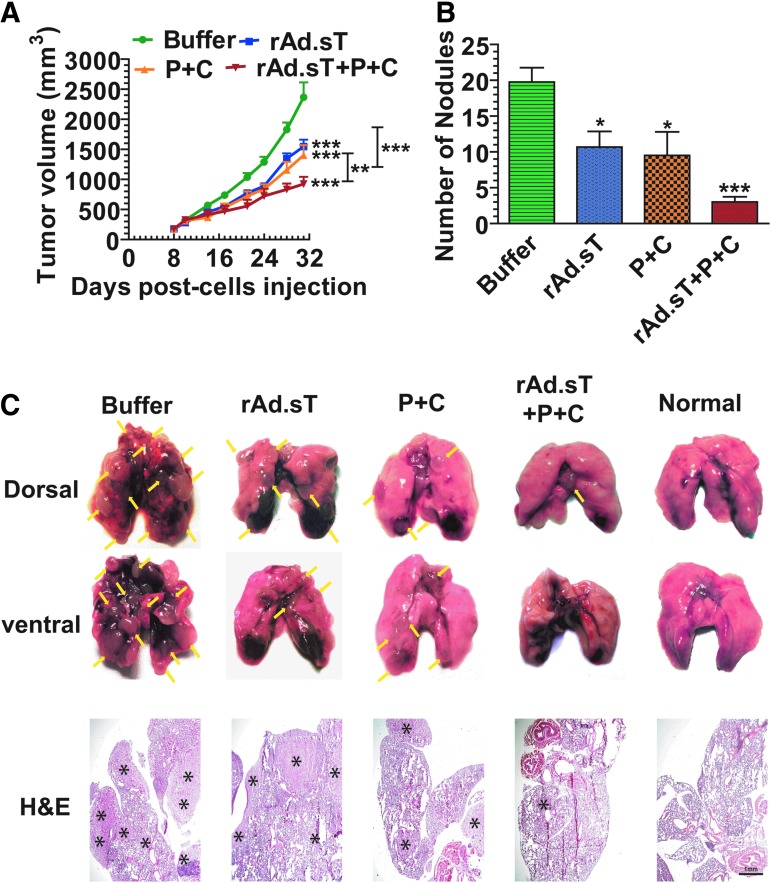
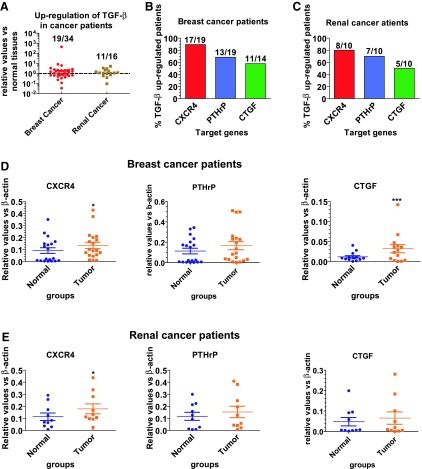
In an effort to develop a new therapy for cancer and to improve antiprogrammed death inhibitor-1 (anti-PD-1) and anticytotoxic T lymphocyte-associated protein (anti-CTLA-4) responses, we have created a telomerase reverse transcriptase promoter-regulated oncolytic adenovirus rAd.sT containing a soluble transforming growth factor receptor II fused with human IgG Fc fragment (sTGFβRIIFc) gene. Infection of breast and renal tumor cells with rAd.sT produced sTGFβRIIFc protein with dose-dependent cytotoxicity. In immunocompetent mouse 4T1 breast tumor model, intratumoral delivery of rAd.sT inhibited both tumor growth and lung metastases. rAd.sT downregulated the expression of several transforming growth factor β (TGFβ) target genes involved in tumor growth and metastases, inhibited Th2 cytokine expression, and induced Th1 cytokines and chemokines, and granzyme B and perforin expression. rAd.sT treatment also increased the percentage of CD8+ T lymphocytes, promoted the generation of CD4+ T memory cells, reduced regulatory T lymphocytes (Tregs), and reduced bone marrow-derived suppressor cells. Importantly, rAd.sT treatment increased the percentage of CD4+ T lymphocytes, and promoted differentiation and maturation of antigen-presenting dendritic cells in the spleen. In the immunocompetent mouse Renca renal tumor model, similar therapeutic effects and immune activation results were observed. In the 4T1 mammary tumor model, rAd.sT improved the inhibition of tumor growth and lung and liver metastases by anti-PD-1 and anti-CTLA-4 antibodies. Analysis of the human breast and kidney tumors showed that a significant number of tumor tissues expressed high levels of TGFβ and TGFβ-inducible genes. Therefore, rAd.sT could be a potential enhancer of anti-PD-1 and anti-CTLA-4 therapy for treating breast and kidney cancers.
Keywords: TGFβ; adenovirus; breast cancer; immunotherapy; kidney cancer.
Conflict of interest statement
No competing financial interests exist.
Figures
Similar articles
-
An Oncolytic Adenovirus Encoding Decorin and Granulocyte Macrophage Colony Stimulating Factor Inhibits Tumor Growth in a Colorectal Tumor Model by Targeting Pro-Tumorigenic Signals and via Immune Activation.Hum Gene Ther. 2017 Aug;28(8):667-680. doi: 10.1089/hum.2017.033. Hum Gene Ther. 2017. PMID: 28530155
-
LyP-1-Modified Oncolytic Adenoviruses Targeting Transforming Growth Factor β Inhibit Tumor Growth and Metastases and Augment Immune Checkpoint Inhibitor Therapy in Breast Cancer Mouse Models.Hum Gene Ther. 2020 Aug;31(15-16):863-880. doi: 10.1089/hum.2020.078. Epub 2020 Jun 12. Hum Gene Ther. 2020. PMID: 32394753 Free PMC article.
-
Immune Modulation by Telomerase-Specific Oncolytic Adenovirus Synergistically Enhances Antitumor Efficacy with Anti-PD1 Antibody.Mol Ther. 2020 Mar 4;28(3):794-804. doi: 10.1016/j.ymthe.2020.01.003. Epub 2020 Jan 10. Mol Ther. 2020. PMID: 31991110 Free PMC article.
-
The oncolytic virus ΔPK has multimodal anti-tumor activity.Pathog Dis. 2016 Jul;74(5):ftw050. doi: 10.1093/femspd/ftw050. Epub 2016 May 29. Pathog Dis. 2016. PMID: 27242376 Free PMC article. Review.
-
Abscopal effects observed in cancer radiation therapy and oncolytic virotherapy: an overview.Drugs Today (Barc). 2019 Feb;55(2):117-130. doi: 10.1358/dot.2019.55.2.2903217. Drugs Today (Barc). 2019. PMID: 30816886 Review.
Cited by
-
Oncolytic adenovirus encoding decorin and CD40 ligand inhibits tumor growth and liver metastasis via immune activation in murine colorectal tumor model.Mol Biomed. 2024 Sep 22;5(1):39. doi: 10.1186/s43556-024-00202-1. Mol Biomed. 2024. PMID: 39306655 Free PMC article.
-
Tumor immunotherapies by immune checkpoint inhibitors (ICIs); the pros and cons.Cell Commun Signal. 2022 Apr 7;20(1):44. doi: 10.1186/s12964-022-00854-y. Cell Commun Signal. 2022. PMID: 35392976 Free PMC article. Review.
-
Therapeutic Efficacy of Oncolytic Viruses in Fighting Cancer: Recent Advances and Perspective.Oxid Med Cell Longev. 2022 Jul 22;2022:3142306. doi: 10.1155/2022/3142306. eCollection 2022. Oxid Med Cell Longev. 2022. PMID: 35910836 Free PMC article. Review.
-
Combination therapy with immune checkpoint inhibitors (ICIs); a new frontier.Cancer Cell Int. 2022 Jan 3;22(1):2. doi: 10.1186/s12935-021-02407-8. Cancer Cell Int. 2022. PMID: 34980128 Free PMC article. Review.
-
Immune Checkpoint Inhibitor Therapy for Bone Metastases: Specific Microenvironment and Current Situation.J Immunol Res. 2021 Nov 28;2021:8970173. doi: 10.1155/2021/8970173. eCollection 2021. J Immunol Res. 2021. PMID: 34877360 Free PMC article. Review.
References
-
- Santa-Maria CA, Gradishar WJ. Changing treatment paradigms in metastatic breast cancer: lessons learned. JAMA Oncol 2015;1:528–534; quiz 549. - PubMed
-
- Katsuno Y, Lamouille S, Derynck R. TGF-beta signaling and epithelial-mesenchymal transition in cancer progression. Curr Opin Oncol 2013;25:76–84 - PubMed
Publication types
MeSH terms
Substances
LinkOut - more resources
Full Text Sources
Research Materials
