. 2019 May 24;20(1):417.
doi: 10.1186/s12864-019-5805-z.

Corrupted DNA-binding specificity and ectopic transcription underpin dominant neomorphic mutations in KLF/SP transcription factors

Affiliations

Corrupted DNA-binding specificity and ectopic transcription underpin dominant neomorphic mutations in KLF/SP transcription factors

Melissa D Ilsley et al. BMC Genomics. .

Abstract

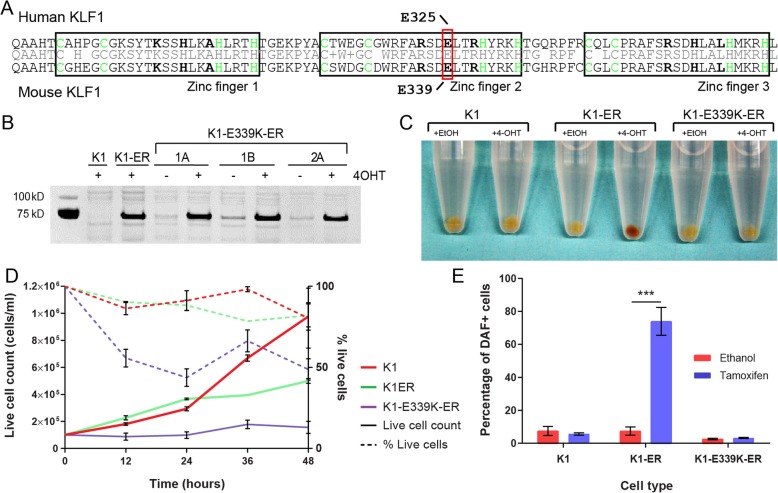
Background: Mutations in the transcription factor, KLF1, are common within certain populations of the world. Heterozygous missense mutations in KLF1 mostly lead to benign phenotypes, but a heterozygous mutation in a DNA-binding residue (E325K in human) results in severe Congenital Dyserythropoietic Anemia type IV (CDA IV); i.e. an autosomal-dominant disorder characterized by neonatal hemolysis.

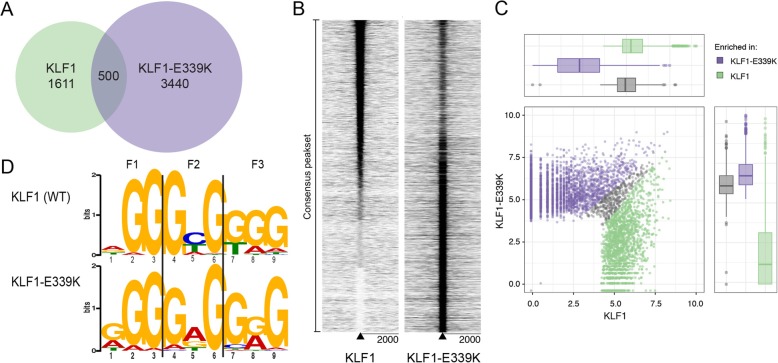
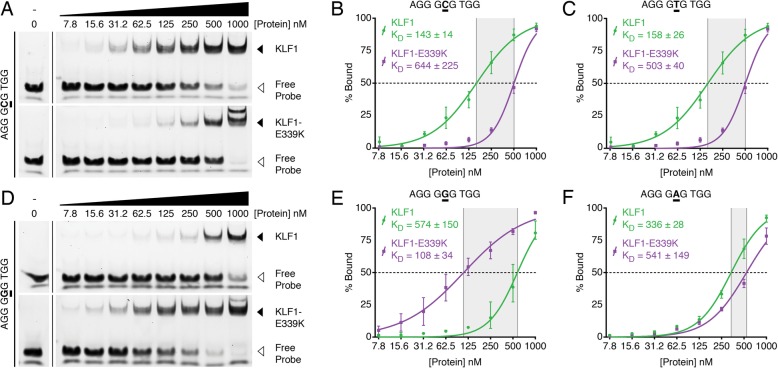
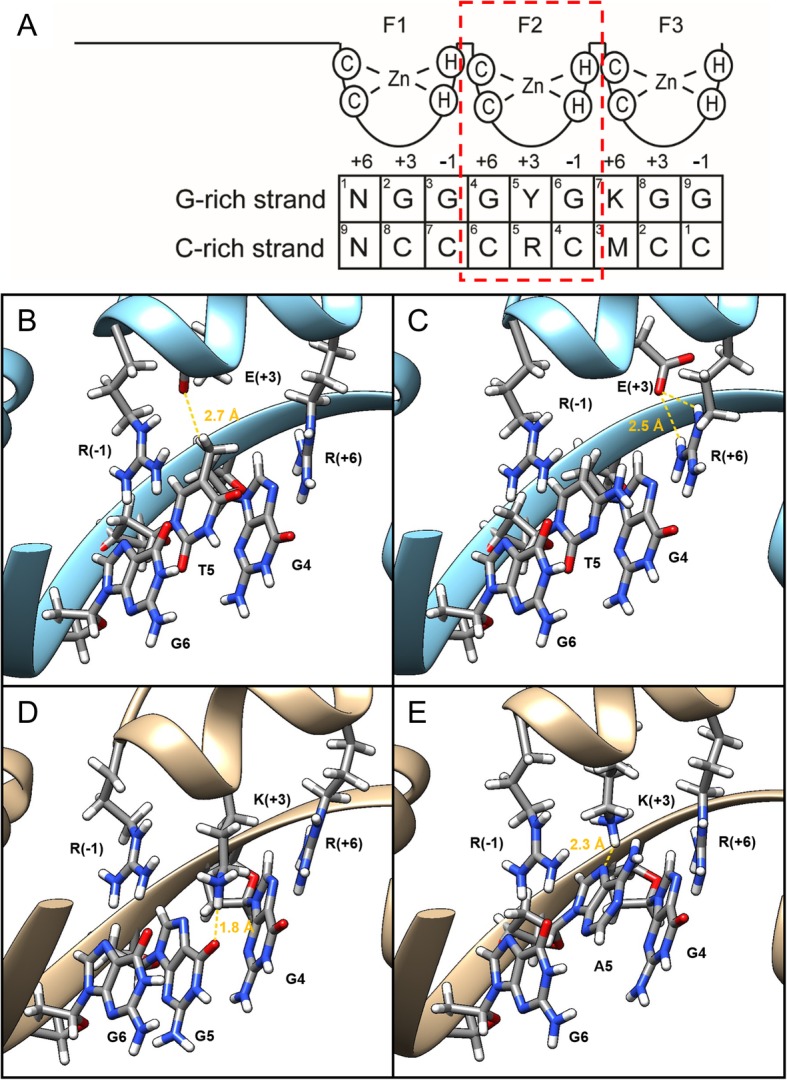
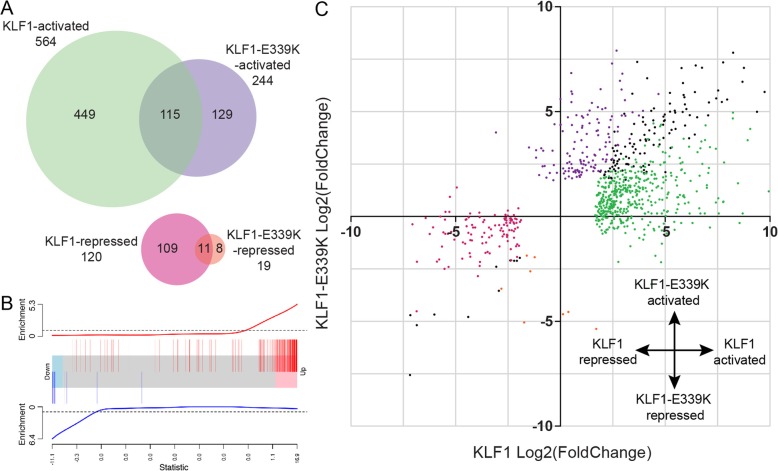
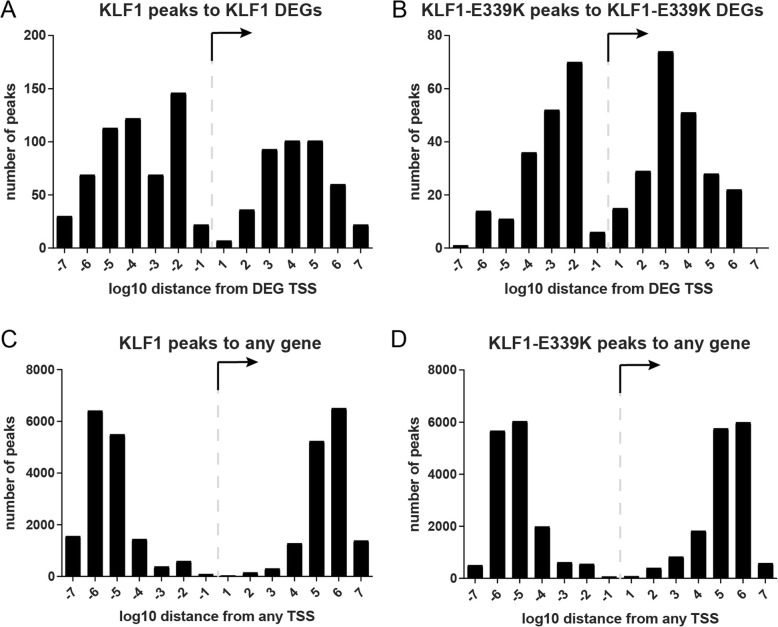
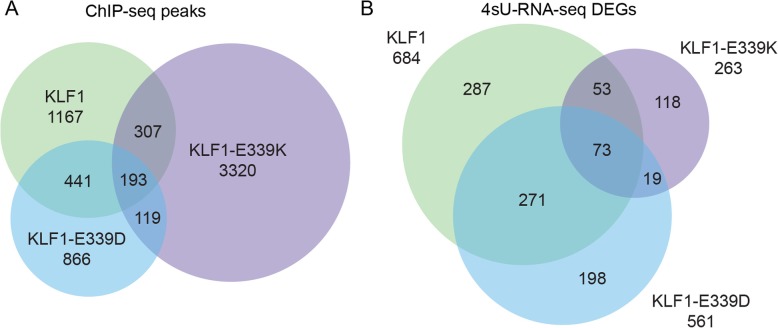
Results: To investigate the biochemical and genetic mechanism of CDA IV, we generated murine erythroid cell lines that harbor tamoxifen-inducible (ER™) versions of wild type and mutant KLF1 on a Klf1-/- genetic background. Nuclear translocation of wild type KLF1 results in terminal erythroid differentiation, whereas mutant KLF1 results in hemolysis without differentiation. The E to K variant binds poorly to the canonical 9 bp recognition motif (NGG-GYG-KGG) genome-wide but binds at high affinity to a corrupted motif (NGG-GRG-KGG). We confirmed altered DNA-binding specificity by quantitative in vitro binding assays of recombinant zinc-finger domains. Our results are consistent with previously reported structural data of KLF-DNA interactions. We employed 4sU-RNA-seq to show that a corrupted transcriptome is a direct consequence of aberrant DNA binding.

Conclusions: Since all KLF/SP family proteins bind DNA in an identical fashion, these results are likely to be generally applicable to mutations in all family members. Importantly, they explain how certain mutations in the DNA-binding domain of transcription factors can generate neomorphic functions that result in autosomal dominant disease.

Keywords: 4sU-RNA labeling; CDA; ChIP-seq; Hemolysis; KLF1.


Conflict of interest statement

The authors declare that they have no competing interests.

Figures

Fig. 1
Fig. 1
An in vitro cell line model to study human CDA type IV. a Alignment of human and mouse KLF1 demonstrating the sequence conservation within the C2H2 zinc finger domains. Mutations associated with CDA IV (E325K) and Nan (E339D) are indicated by boxes. Bold amino acids indicate residues which contact DNA when bound. b Western blot of nuclear extracts from cell lines generated in this study. The blot shows presence of KLF1-ER in the nucleus after induction with 4-OHT (+) in a K1-ER cell line and 3 independent clones of the K1-E339K-ER cell line. Full-length blot image is presented in Additional file 1: Figure S1. c Cell pellets from K1 (parental), K1-ER (wild type), and K1-E339K-ER (CDA mutation) lines treated with 4-OHT or ethanol (vehicle control) for 48 h. The redness of the pellet indicates production of hemoglobin. d Cell number and viability measured at 12-h intervals following induction with 4-OHT for K1 (yellow), K1-ER (green), and K1-E339K-ER (purple) cells. Solid line represents number of live cells in culture and dashed line represents the percentage of live cells in culture. Error bars show ± SEM from three independent clones or three biological replicates for parental K1 cells.e Percentage of DAF positive cells (indicating presence of hemoglobin) at 48 h post-treatment with 4-OHT or ethanol. Data are represented as mean ± SEM from 3 clonally independent cell lines. ***P < 0.001 (Student’s t-test)
Fig. 2
Fig. 2
KLF1-E339K-ER binds to novel sites throughout the genome due to a change in DNA-binding specificity. a A Consensus occupancy peakset was generated from overlapping KLF1-ER and KLF1-E339K-ER binding sites. b Heat maps of read density of KLF1-ER and KLF1-E339K-ER ChIP-seq at a ± 2 kb from the consensus peakset. Plots are clustered according to the nearest neighbor chain algorithm [50]. c Scatter plot with marginal boxplots displaying the log2 normalized mean read count from differential binding analysis between KLF1 and KLF1-E339K peaksets and read alignments. d Position weighted matrix for the highest-ranking motif derived from KLF1-ER (top) and KLF1-E339K-ER (bottom) peaks (±50 bp), as determined by MEME
Fig. 3
Fig. 3
KLF1-E339K binds with strong affinity to an altered recognition sequence. a Saturation fluorescent gel shift assay of KLF1-zf and KLF1-E339K-zf (0–1000 nM) binding to a 2 nM probe representing the sequence at the Alas2 enhancer binding site (AGG GCG TGG; C5). b Free versus bound probe were quantified and plotted from replicate gel shift assays to calculate the binding affinity constant (KD) of KLF1 (green) and KLF1-E339K (purple) to the Alas2 enhancer binding site (AGG GCG TGG; C5). Curves were fit individually using with Hill Slope. Averaged KD and its standard error are reported (n = 3). c, e, f Free versus bound probe were quantified and plotted from replicate (n = 3) gel shift assays as in A) with alternate probe sequences as indicated. d Saturation fluorescent gel shift assay of KLF1-zf and KLF1-E339K-zf (0–1000 nM) binding to a 2 nM probe representing an altered sequence at the Alas2 enhancer binding site (AGG GGG TGG; G5)
Fig. 4
Fig. 4
KLF1-E339K binds to the G-rich strand when purines are present at the fifth position, but lysine residue makes no contact with DNA. a Schematic of how KLF1 binds to CACCC-box motif via the G-rich strand. K = T/G, Y = T/C, M = A/C, R = A/G, N = any nucleotide. The panels in B-E focus on the interaction between the central triplet and ZF2. b Binding mode of the second zinc finger of KLF1 to a central GTG triplet on the G-rich strand, modeled on the crystal structure of KLF4 bound to the cognate GTG-containing DNA (PDB ID 5ke6). A weak C-H···O bond is the only contact between the glutamate (E) at the + 3 position and the central DNA base (T5). c Binding mode of the second zinc finger of KLF1 to a central GCG triplet on the G-rich strand, modeled on the crystal structure of KLF4 bound to the cognate GCG-containing DNA (PDB ID 2wbu). The glutamate does not directly contact the DNA but instead hydrogen bonds to the arginine (R) at the − 1 position. d Proposed binding mode of second zinc finger of KLF1-E339K to a central GGG triplet on the G-rich strand. The larger, positively charged lysine (K) sidechain extends towards the DNA and is able to act as a hydrogen bond donor, contacting the carbonyl group on G5 and forming a favorable hydrogen bond (shown in gold). e Proposed binding mode of second zinc finger of KLF1-E339K to a central GAG triplet on the G-rich strand. Substitution of guanine for adenine removes the hydrogen bond acceptor but an alternative, hydrogen bond is possible with the N7 atom of the adenine ring (shown in gold). This arrangement may also be possible when the central nucleotide is a G, however it is predicted that the N-H···O bond shown in D) is preferred, leading to a comparatively stronger affinity for GGG over GAG
Fig. 5
Fig. 5
KLF1-E339K-ER causes dysregulation of gene expression via aberrant activation of genes. a Venn diagram showing the overlap of differentially expressed genes (DEGs) from K1-ER and K1-E339K-ER 4sU-RNA-seq analysis. b Barcode plot demonstrating correlation of differentially expressed genes due to KLF1-E339K-ER (comparison of K1-E339K-ER cells versus K1; FDR < 0.05, Additional file 6: Table S2; red bars: upregulated genes; blue bars: downregulated genes) relative to gene expression changes due to KLF1-ER. Horizontal axis shows moderated t-statistic values for KLF1-ER. Red and blue worms show relative enrichment of up and downregulated genes (ROAST P-value < 0.01 for upregulated genes). c Scatter-plot of the log2 (fold change) of all genes called as significant in either K1-ER or K1-E339K-ER 4sU-RNA-seq analysis. Colors are consistent with those in the Venn diagram (A). Black dots represent genes that are significantly differentially regulated by both TFs
Fig. 6
Fig. 6
Aberrant transcription is a direct result of KLF1-E339K-ER binding. a Graph of the number of KLF1-ER ChIP-peaks versus distance (log10 nt) and direction from the TSS of K1-ER DEGs.b Graph of the number of KLF1-ER ChIP-peaks versus distance (log10 nt) and direction from the TSS of all genes within the genome. c Graph of the number of KLF-E339K-ER versus distance (log10 nt) and direction from the TSS of K1-E339K-ER DEGs. d Graph of the number of KLF1-E339K-ER peaks versus distance (log10 nt) and direction from the TSS of all genes within the genome
Fig. 7
Fig. 7
KLF1-E339K-ER and KLF1-E339D-ER bind different sites in the genome to regulate different sets of genes. a Proportional Venn diagram of ChIP-seq peak overlaps between wildtype KLF1-ER, KLF1-E339K-ER and KLF1-E339D-ER. Peaks are considered shared if the peak summits are within 250 bp of each other. b Proportional Venn diagram of DEGS in response to wildtype KLF1-ER, KLF1-E339K-ER or KLF1-E339D-ER induction

Similar articles

Cited by

References

    1. Miller IJ, Beiker JJ. A novel, erythroid cell-specific murine transcription factor that binds to the CACCC element and is related to the Kruppel family of nuclear proteins. Mol Cell Biol. 1993;13(5):2776–2786. doi: 10.1128/MCB.13.5.2776. - DOI - PMC - PubMed
    1. Tallack MR, Perkins AC. KLF1 directly coordinates almost all aspects of terminal erythroid differentiation. IUBMB Life. 2010;62(12):886–890. doi: 10.1002/iub.404. - DOI - PubMed
    1. Perkins A, Xu X, Higgs DR, Patrinos GP, Arnaud L, Bieker JJ, Philipsen S, Workgroup KLFC. Kruppeling erythropoiesis: an unexpected broad spectrum of human red blood cell disorders due to KLF1 variants. Blood. 2016;127(15):1856–1862. doi: 10.1182/blood-2016-01-694331. - DOI - PMC - PubMed
    1. Gnanapragasam MN, Bieker JJ. Orchestration of late events in erythropoiesis by KLF1/EKLF. Curr Opin Hematol. 2017;24(3):183–190. doi: 10.1097/MOH.0000000000000327. - DOI - PMC - PubMed
    1. Nuez B, Michalovich D, Bygrave A, Ploemacher R, Grosveld F. Defective haematopoiesis in fetal liver resulting from inactivation of the EKLF gene. Nature. 1995;375(6529):316–318. doi: 10.1038/375316a0. - DOI - PubMed