. 2019 May 24;11(1):34.
doi: 10.1186/s13073-019-0638-6.

Molecular and pharmacological modulators of the tumor immune contexture revealed by deconvolution of RNA-seq data

Affiliations

Molecular and pharmacological modulators of the tumor immune contexture revealed by deconvolution of RNA-seq data

Francesca Finotello et al. Genome Med. .

Erratum in

Abstract

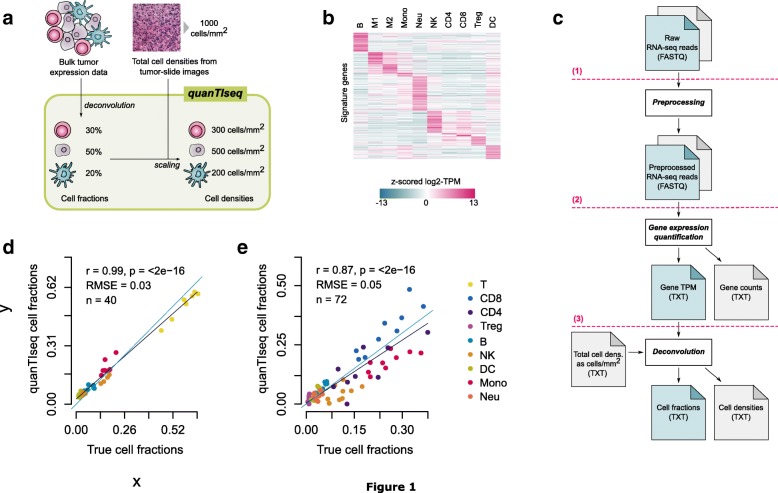
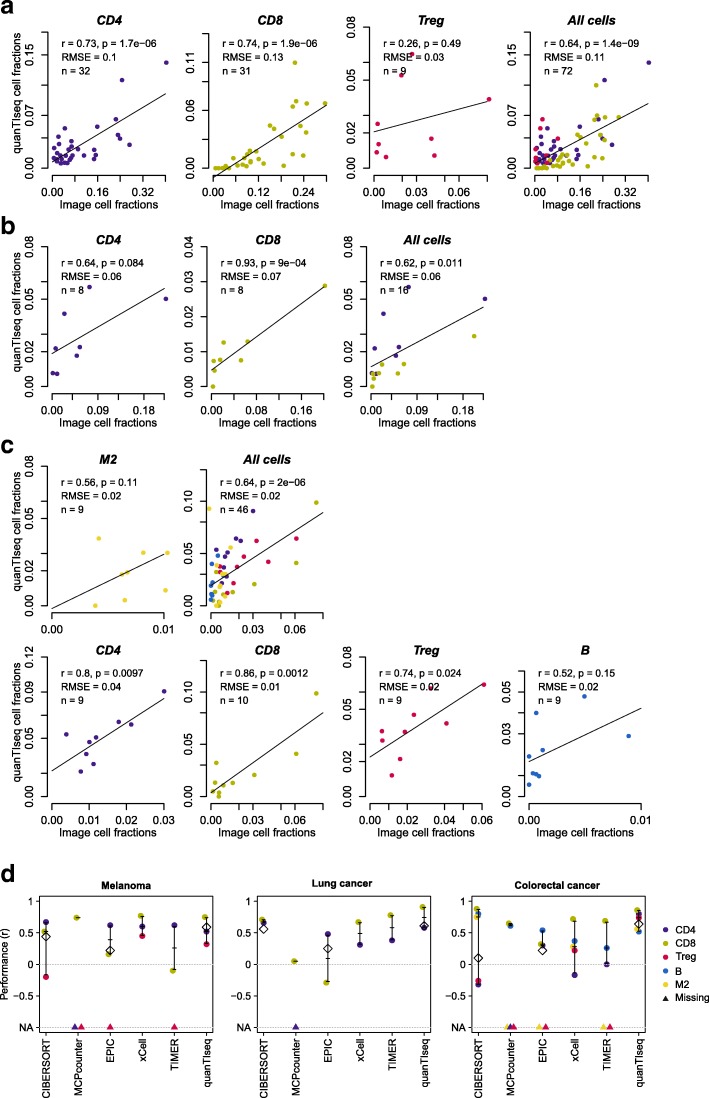
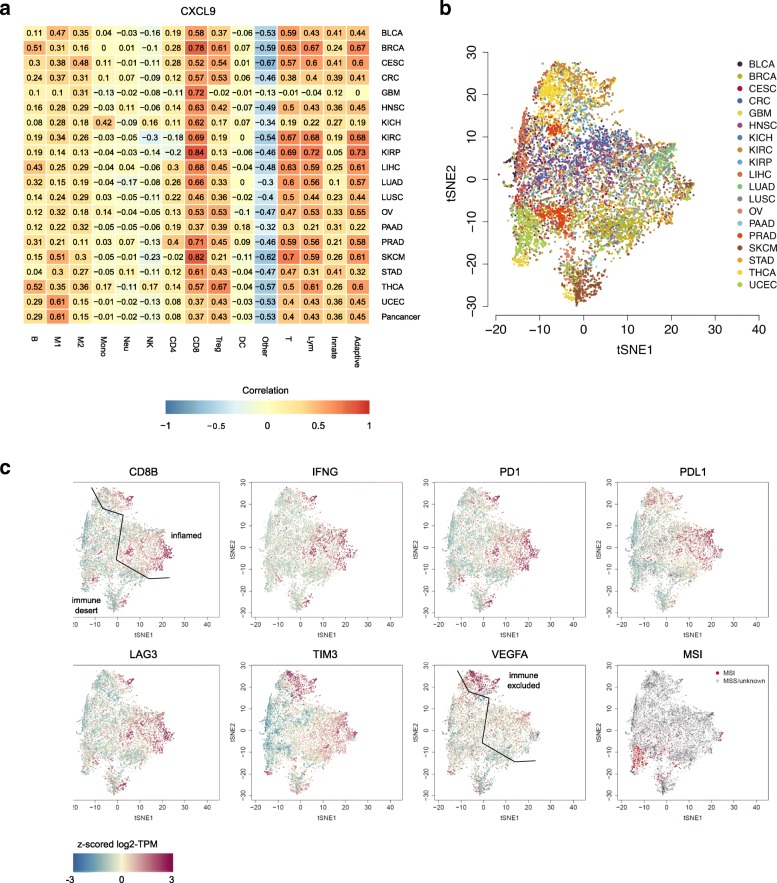
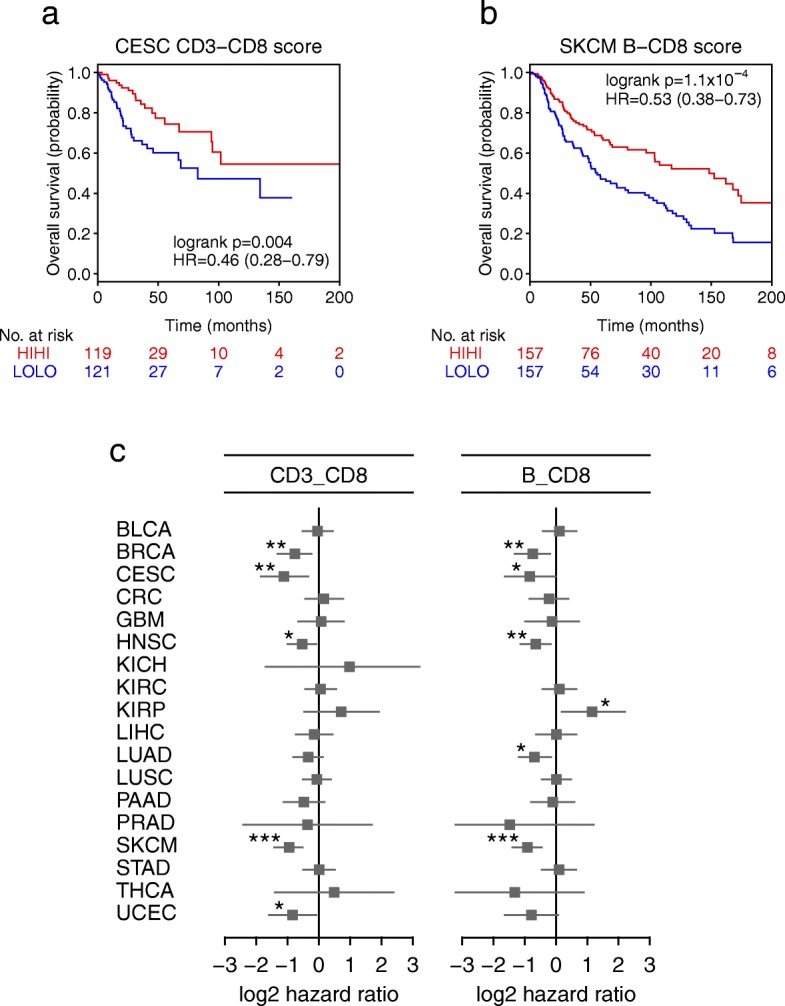
We introduce quanTIseq, a method to quantify the fractions of ten immune cell types from bulk RNA-sequencing data. quanTIseq was extensively validated in blood and tumor samples using simulated, flow cytometry, and immunohistochemistry data.quanTIseq analysis of 8000 tumor samples revealed that cytotoxic T cell infiltration is more strongly associated with the activation of the CXCR3/CXCL9 axis than with mutational load and that deconvolution-based cell scores have prognostic value in several solid cancers. Finally, we used quanTIseq to show how kinase inhibitors modulate the immune contexture and to reveal immune-cell types that underlie differential patients' responses to checkpoint blockers.Availability: quanTIseq is available at http://icbi.at/quantiseq .

Keywords: Cancer immunology; Deconvolution; Immune contexture; Immunotherapy; RNA-seq.


Conflict of interest statement

JB receives research support from Genentech/Roche, Bristol Myers Squibb, and Incyte Corporation; has received consulting/expert witness fees from Novartis; and is an inventor on provisional patents regarding immunotherapy targets and biomarkers in cancer. DJ is in the Advisory Board of Array, BMS, Genoptix, Incyte, Merck, and Novartis and has received research or travel support from BMS, Incyte, and Genentech. ZT is affiliated with ADSI and there are no competing interests related to this work. The remaining authors declare that they have no competing interests.

Figures

Fig. 1
Fig. 1
quanTIseq method and validation based on blood-cell mixtures. a quanTIseq characterizes the immune contexture of human tumors from expression and imaging data. Cell fractions are estimated from expression data and then scaled to cell densities (cells/mm2) using total cell densities extracted from imaging data. b Heatmap of quanTIseq signature matrix, with z scores computed from log2(TPM+1) expression values of the signature genes. c The quanTIseq pipeline consists of three modules that perform (1) pre-processing of paired- or single-end RNA-seq reads in FASTQ format; (2) quantification of gene expression as transcripts-per-millions (TPM) and gene counts; and (3) deconvolution of cell fractions and scaling to cell densities considering total cells per mm2 derived from imaging data. The analysis can be initiated at any step. Optional files are shown in grey. Validation of quanTIseq with RNA-seq data from blood-derived immune cell mixtures generated in [46] (d) and in this study (e). Deconvolution performance was assessed with Pearson’s correlation (r) and root-mean-square error (RMSE) using flow cytometry estimates as ground truth. The grey and blue lines represent the linear fit and the “x = y” line, respectively. B, B cells; CD4, non-regulatory CD4+ T cells; CD8, CD8+ T cells; DC, dendritic cells; M1, classically activated macrophages; M2, alternatively activated macrophages; Mono, monocytes; Neu, neutrophils; NK, natural killer cells; T, T cells; Treg, regulatory T cells
Fig. 2
Fig. 2
Validation of quanTIseq using tumor RNA-seq data and IF/IHC images. Comparison of quanTIseq cell fractions with those inferred for IF/IHC images from melanoma (a), lung cancer (b), and colorectal cancer (c) patients. Deconvolution performance was assessed with Pearson’s correlation (r) and root-mean-square error (RMSE) considering image cell fractions (ratio of positive cells to total nuclei) as ground truth. The line represents the linear fit. d Performance of quanTIseq and previous computational methods obtained on the three validation cohorts: melanoma, lung cancer, and colorectal cancer patients. Methods performance was quantified using Pearson’s correlation (r) considering image cell fractions as ground truth. Correlations for single cell types are displayed as dots, together with whiskers and horizontal bands representing median and 95% confidence intervals. Missing cell types are visualized as triangles at the bottom of the plots. Diamonds indicate the overall correlation obtained considering all cell types together; not shown for marker-based methods, which do not allow intra-sample comparison. B, B cells. CD4, total CD4+ T cells (including also CD4+ regulatory T cells); CD8, CD8+ T cells; M2, M2 macrophages; T, Treg: regulatory T cells
Fig. 3
Fig. 3
quanTIseq analysis of RNA-seq data from 19 TCGA solid cancers. a Pearson’s correlation between cell proportions estimated by quanTIseq and expression in TPM of the CXCL9 chemokine. t-SNE plot of the immune contextures of 8243 TCGA cancer patients, colored by: b cancer type or c expression of immune-related genes and microsatellite instability state. The line in the t-SNE plots qualitatively indicates the separation of the putative inflamed, immune-desert, and immune-excluded phenotypes. Adaptive, total adaptive immune cells; B, B cells; CD4, total CD4+ T cells (including also CD4+ regulatory T cells); CD8, CD8+ T cells; DC, dendritic cells; Innate, total innate immune cells; Lym, total lymphocytes; M1, classically activated macrophages; M2, alternatively activated macrophages; Mono, monocytes; MSI, microsatellite instable; MSS, microsatellite stable; Neu, neutrophils; NK, natural killer cells; Other, uncharacterized cells; T, T cells; Treg, regulatory T cells
Fig. 4
Fig. 4
Prognostic value of deconvolution-based immunoscore and T cell/ B cell score in solid cancers. Kaplan-Meier plots showing the survival of the Hi-Hi and Lo-Lo classes defined considering the deconvolution-based immunoscore computed for cervical endometrial cancer (CESC) patients (a) and the TB score computed for melanoma (SKCM) patients (b). The p value of the log-rank test, hazard ratio (HR) with 5% confidence intervals, and number of patients at risk at the respective time points are reported. c Results of the overall survival analysis across 19 TCGA solid cancers. Log2 hazard ratio and its 95% confidence interval are visualized for the deconvolution-based immunoscore and TB score as forest plots. Significant p values are indicated as ***p < 0.001, **0.001 ≤ p < 0.01, and *0.01 ≤ p < 0.05
Fig. 5
Fig. 5
Pharmacological modulation of the tumor immune contexture and response to checkpoint blockers. a Changes in the immune contexture of melanoma tumors during treatment with BRAF and/or MEK inhibitors, measured as “relative cell fraction variation”, i.e., ratio between the difference and the mean of the on- and pre-treatment immune cell fractions estimated via deconvolution. Immune cell fractions (log scale) estimated with quanTIseq from pre- (b) and on-treatment (c) samples collected from melanoma patients treated with anti-PD1 and stratified as responders (R) and non-responders (NR) (data from [58]). d quanTIseq immune cell densities (log scale) from our cohort of melanoma patients, stratified as responders (R) and non-responders (NR). Total cell densities used to scale quanTIseq immune cell fractions were estimated as the median number of nuclei per mm2 across all images generated from each tumor. B, B cells; CD4, total CD4+ T cells (including also CD4+ regulatory T cells); CD8, CD8+ T cells; DC, dendritic cells; M1, classically activated macrophages; M2, alternatively activated macrophages; Mono, monocytes; Neu, neutrophils; NK, natural killer cells; Treg, regulatory T cells; Other, other uncharacterized cells

References

    1. Topalian SL, Taube JM, Anders RA, Pardoll DM. Mechanism-driven biomarkers to guide immune checkpoint blockade in cancer therapy. Nat Rev Cancer. 2016;16:275–287. doi: 10.1038/nrc.2016.36. - DOI - PMC - PubMed
    1. Chen DS, Mellman I. Elements of cancer immunity and the cancer-immune set point. Nature. 2017;541:321–330. doi: 10.1038/nature21349. - DOI - PubMed
    1. Galon J, Costes A, Sanchez-Cabo F, Kirilovsky A, Mlecnik B, Lagorce-Pagès C, et al. Type, density, and location of immune cells within human colorectal tumors predict clinical outcome. Science. 2006;313:1960–1964. doi: 10.1126/science.1129139. - DOI - PubMed
    1. Fridman WH, Zitvogel L, Sautès-Fridman C, Kroemer G. The immune contexture in cancer prognosis and treatment. Nat Rev Clin Oncol. 2017;14:717–734. doi: 10.1038/nrclinonc.2017.101. - DOI - PubMed
    1. Fridman WH, Pagès F, Sautès-Fridman C, Galon J. The immune contexture in human tumours: impact on clinical outcome. Nat Rev Cancer. 2012;12:298–306. doi: 10.1038/nrc3245. - DOI - PubMed

Publication types