. 2019 Jun 12;6(3):ENEURO.0190-19.2019.
doi: 10.1523/ENEURO.0190-19.2019. Print 2019 May/Jun.

Dopamine Depletion Affects Vocal Acoustics and Disrupts Sensorimotor Adaptation in Songbirds

Affiliations

Dopamine Depletion Affects Vocal Acoustics and Disrupts Sensorimotor Adaptation in Songbirds

Varun Saravanan et al. eNeuro. .

Abstract

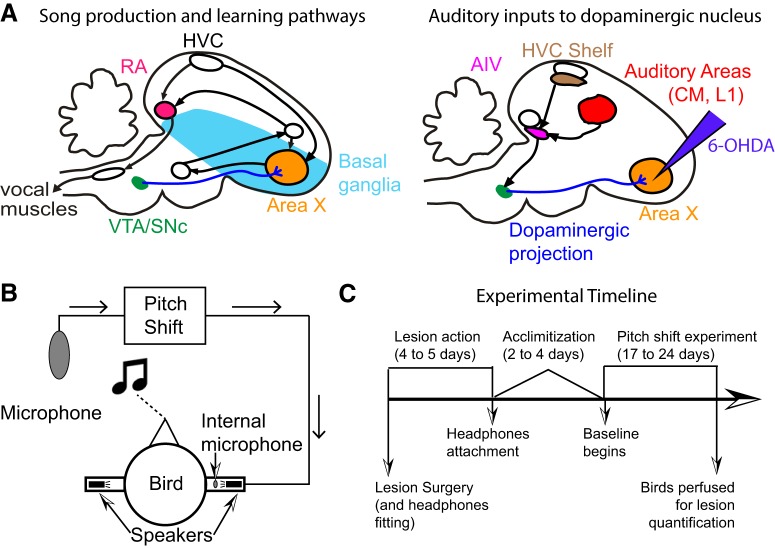
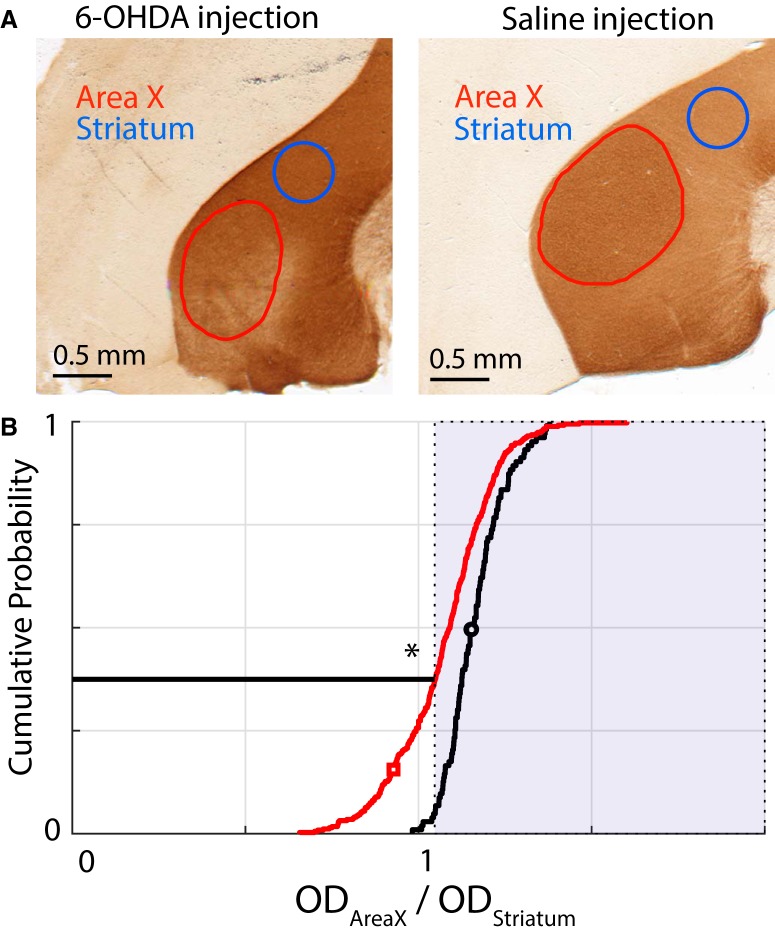
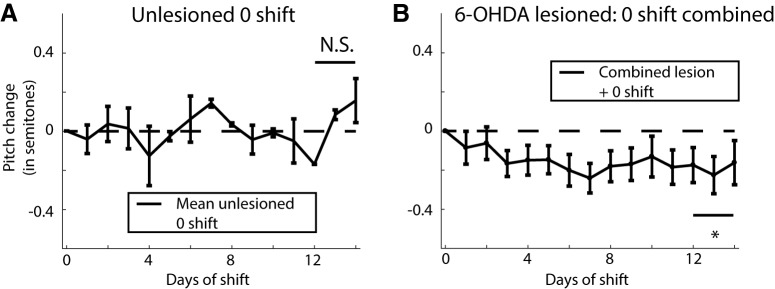
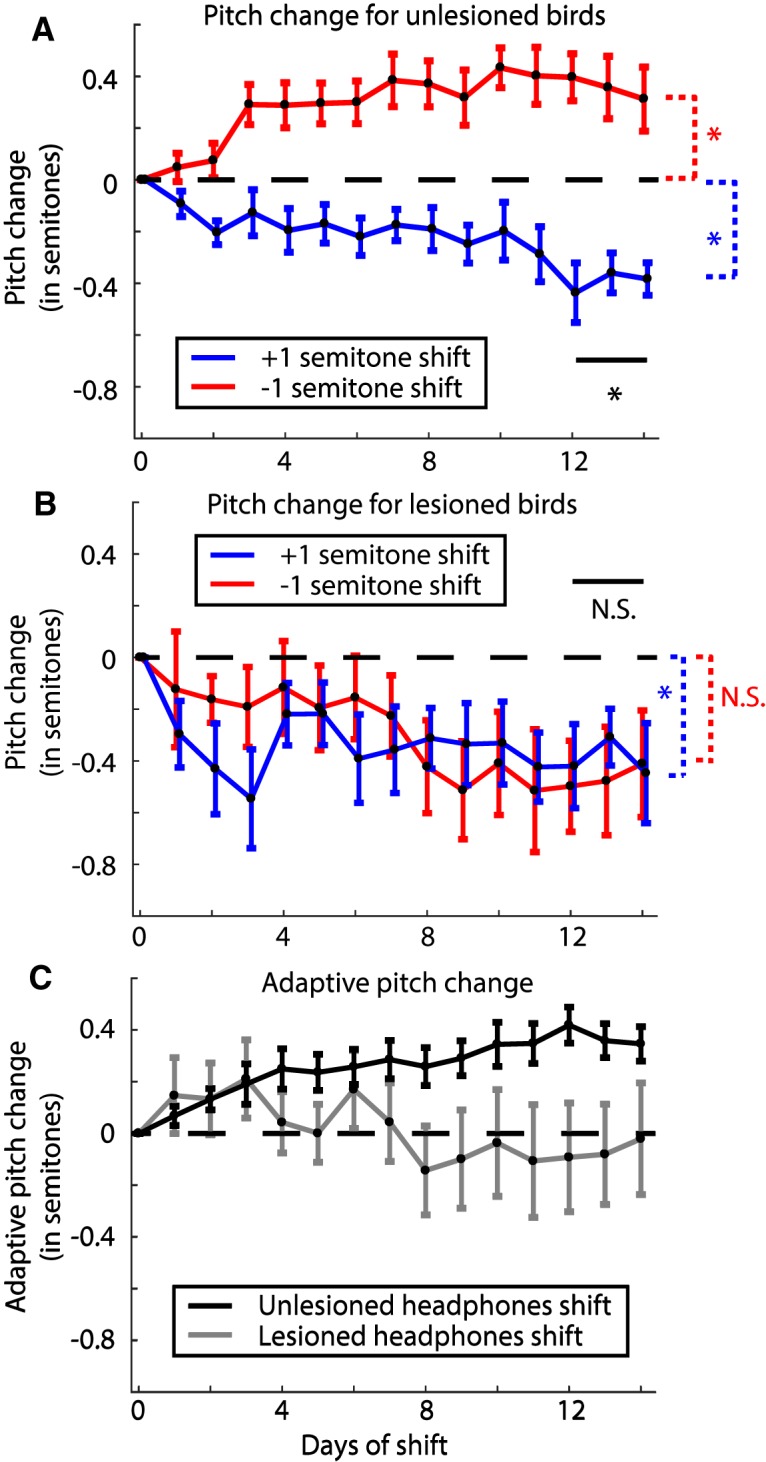
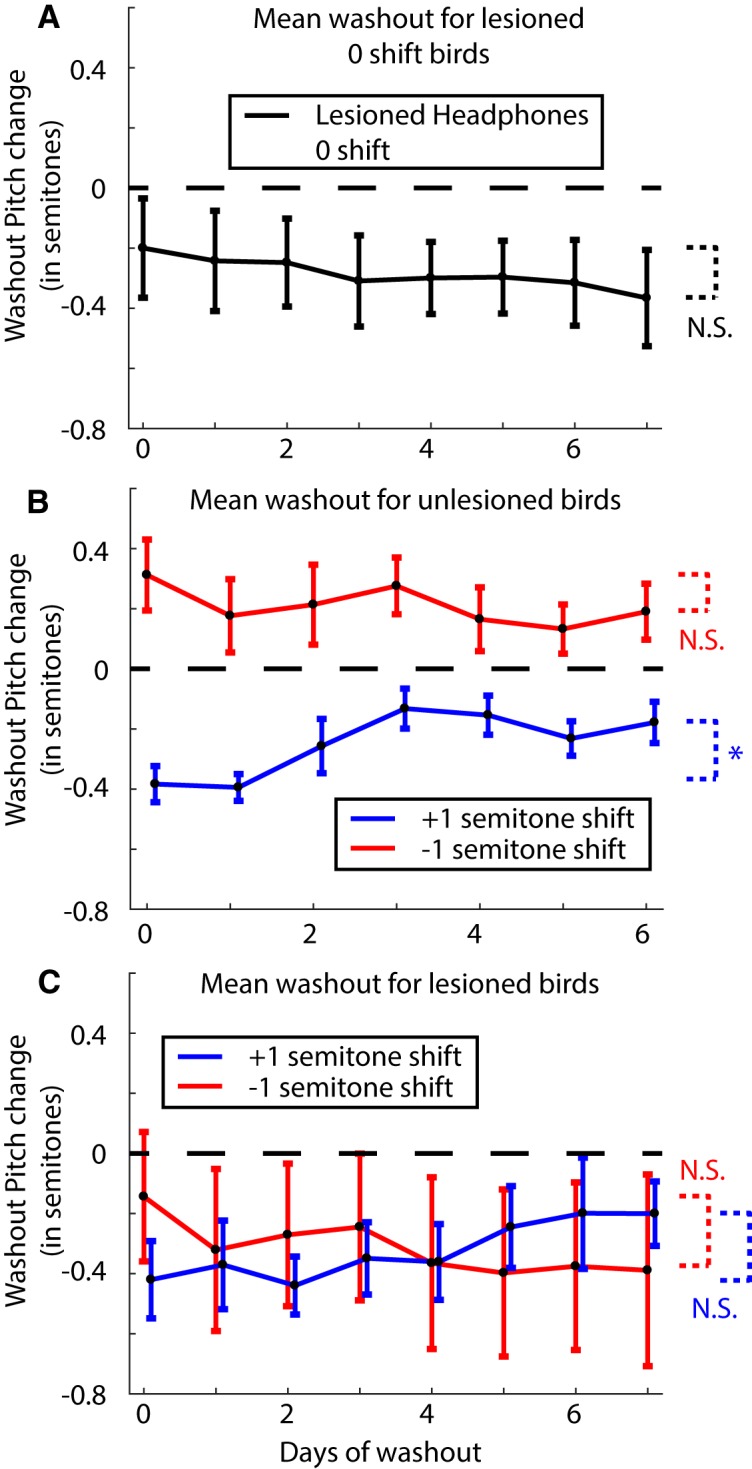
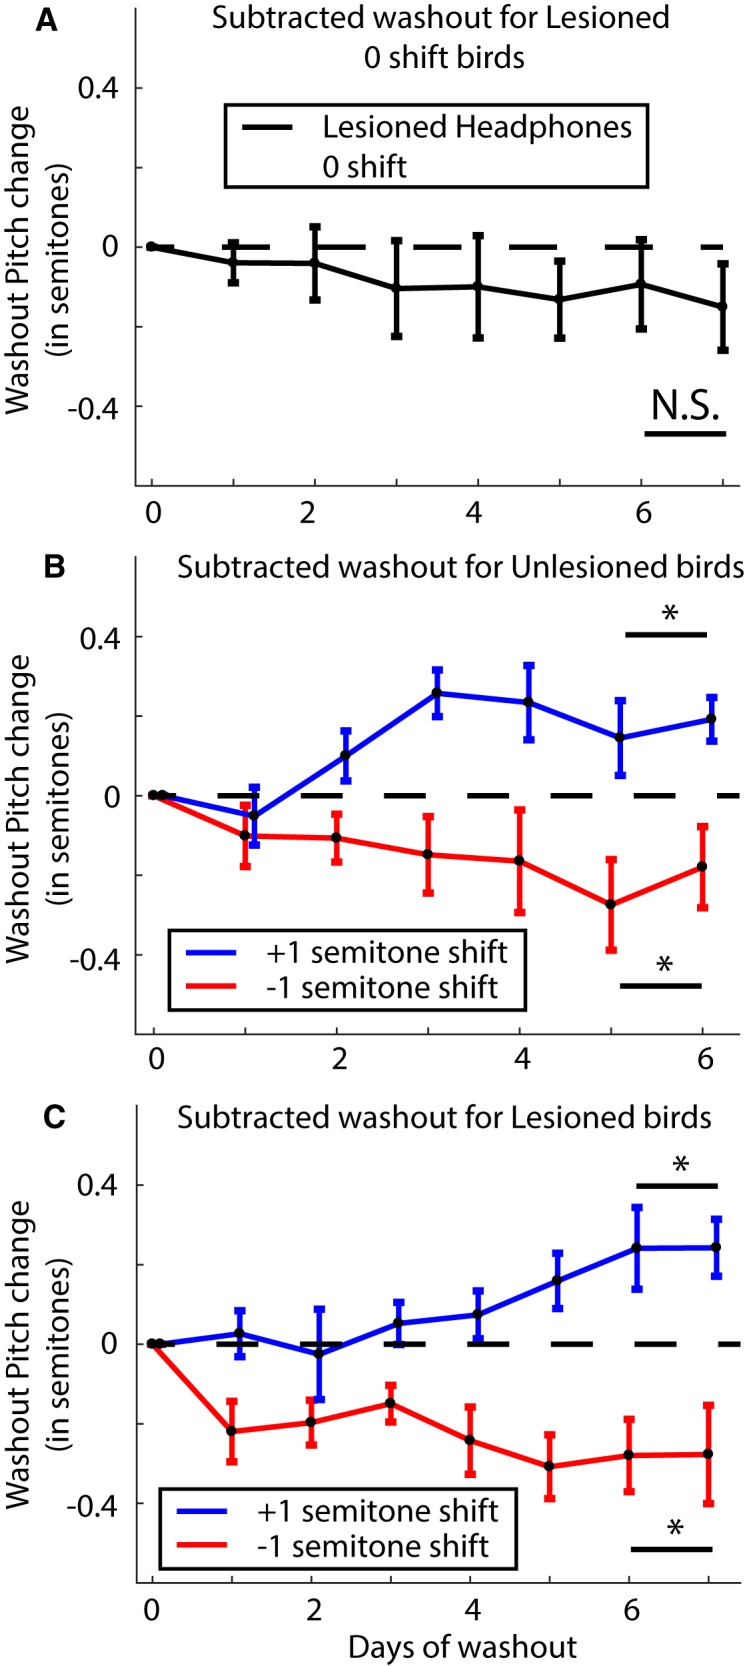
Dopamine is hypothesized to convey error information in reinforcement learning tasks with explicit appetitive or aversive cues. However, during motor skill learning feedback signals arise from an animal's evaluation of sensory feedback resulting from its own behavior, rather than any external reward or punishment. It has previously been shown that intact dopaminergic signaling from the ventral tegmental area/substantia nigra pars compacta (VTA/SNc) complex is necessary for vocal learning when songbirds modify their vocalizations to avoid hearing distorted auditory feedback (playbacks of white noise). However, it remains unclear whether dopaminergic signaling underlies vocal learning in response to more naturalistic errors (pitch-shifted feedback delivered via headphones). We used male Bengalese finches (Lonchura striata var. domestica) to test the hypothesis that the necessity of dopamine signaling is shared between the two types of learning. We combined 6-hydroxydopamine (6-OHDA) lesions of dopaminergic terminals within Area X, a basal ganglia nucleus critical for song learning, with a headphones learning paradigm that shifted the pitch of auditory feedback and compared their learning to that of unlesioned controls. We found that 6-OHDA lesions affected song behavior in two ways. First, over a period of days lesioned birds systematically lowered their pitch regardless of the presence or absence of auditory errors. Second, 6-OHDA lesioned birds also displayed severe deficits in sensorimotor learning in response to pitch-shifted feedback. Our results suggest roles for dopamine in both motor production and auditory error processing, and a shared mechanism underlying vocal learning in response to both distorted and pitch-shifted auditory feedback.

Keywords: Bengalese finch; basal ganglia; dopamine; sensorimotor adaptation; songbird; vocal learning.


Figures

Figure 1.
Figure 1.
Songbird neuroanatomy and experimental design. A, A theory for the role of dopamine in sensorimotor learning in songbirds. The left panel shows the brain nuclei in the songbird primarily involved in song production and learning. Area X, a songbird basal ganglia nucleus critical for song learning, receives dense dopaminergic projections from the VTA/SNc complex. The right panel shows the nuclei involved in auditory processing in the songbird. There are other inputs (data not shown) to the VTA/SNc complex from auditory areas and the ventral basal ganglia (vBG). One of the known pathways for auditory information to influence song learning is through the dopaminergic projections to Area X. We target these projections when we perform 6-OHDA lesions into Area X as depicted. B, A schematic for how the custom-built headphones introduce a pitch shifted auditory error to the birds. Briefly, a cage microphone records all sounds made within the cage and sends it through a pitch shifting program which is subsequently played back to the bird through miniature speakers attached to the headphones. The headphones also have an internal microphone to record output from the headphones speakers and to calibrate sound intensity. C, A detailed timeline for each of our experiments (see Materials and Methods).
Figure 2.
Figure 2.
Metric for quantifying the extent of our lesions in our population of birds. We used an OD ratio between Area X and the surrounding basal ganglia (see Materials and Methods) and compared the cumulative ratios between a saline-injected population (N = 4 birds) and our 6-OHDA lesioned population (N = 16 birds). A, Examples of 6-OHDA lesioned (left) and saline-injected (right) sections. The red trace demarcates the Area X boundary. The blue circle is chosen to represent a uniformly stained section of the rest of the striatum. The ratio for each section is calculated as the OD ratio between these two regions. B, Cumulative distribution plots for the saline-injected birds (black trace) and the 6-OHDA lesioned birds (red trace). The shaded portion represents ratios that are greater than the 5th percentile for the saline-injected birds. By this metric, 37.5% of all 6-OHDA lesioned sections have a smaller OD ratio. The black and red symbols correspond to the examples shown in A. The * represents a statistically significant difference between the red trace and the black trace (Kolmogorov–Smirnov test; p < 0.05; see Results for full description).
Figure 3.
Figure 3.
Quantifying the effect of headphones without any pitch shifts on the average change in pitch of the bird with or without lesions. A, Mean change in pitch of song for two unlesioned birds with headphones but no shifts through the headphones (reproduced from Sober and Brainard, 2009, their Supplemental Fig. 6). B, Mean change in pitch for 6-OHDA lesioned birds combining both birds with headphones but no shift in pitch (N = 5 birds) or without headphones (N = 3 birds) for a total of eight birds. The group averages for the two groups and the individual traces for all eight birds is shown in Extended Data Figure 3-1. N.S. represents not significantly different from zero, while the * represents a significant difference when comparing the last 3 d of shift combined from zero (p < 0.05).
Figure 4.
Figure 4.
Change in pitch in response to pitch shift errors through the headphones in unlesioned and 6-OHDA lesioned birds. A, Change in pitch from baseline over the period of pitch shift for unlesioned birds broken up by the direction of introduced shift in pitch (data reanalyzed from Sober and Brainard, 2009). The graph shows that birds increase their pitch over time in response to a downward pitch shift (red trace; N = 3 birds) and decrease their pitch to an upwards pitch shift (blue trace; N = 3 birds). Traces for individual birds are shown in Extended Data Figure 4-1A. B, Same graph as in A quantified for 6-OHDA lesioned birds (N = 4 birds for each trace). Individual birds are shown in Extended Data Figure 4-1B. C, Adaptive change in pitch (see Results) for unlesioned birds (black trace; N = 6 birds) and 6-OHDA lesioned birds (gray trace; N = 8 birds). For A, B, the * and N.S. in black represent significant and not significant differences, respectively, between the two shift conditions, while the color coded differences check difference of each group from zero (see Results; Table 1).
Figure 5.
Figure 5.
Analysis of change in pitch during washout for lesioned and unlesioned birds. A, Mean change in pitch during washout for lesioned birds with headphones but no pitch shift (N = 5 birds). Day 0 refers to the last day of the shift period. Pitch shift is turned off at the end of this day. Individual bird traces are shown in Extended Data Figure 5-1A. B, Mean change in pitch during washout for unlesioned birds (N = 3 birds for each trace). Individual bird traces are shown in Extended Data Figure 5-1B. C, Mean change in pitch during washout for 6-OHDA lesioned birds (N = 2 birds for each trace). The extremely large error bars are due in part to the bimodal nature of the data (see individual birds in Extended Data Fig. 5-1C). The statistical tests check the last 3 d of the shift period against the last 2 d of washout with * representing a significant difference (p < 0.05) and N.S. representing not significant (see Results for full tests).
Figure 6.
Figure 6.
Results when measuring the dynamics of the change in pitch or Δ(Pitch) during washout by subtracting out the pitch change on the last day of shift through the washout period. A, Δ(Pitch) during washout for lesioned no shift birds (N = 5 birds). B, The same analysis as in A for unlesioned birds subjected to ±1 semitone shift (N = 3 birds each). C, The same analysis as in A for lesioned birds subjected to ±1 semitone shift (N = 2 birds each). The * and N.S. refer to a significant difference versus not, respectively, for each group compared to zero over the last 2 d of washout.

Similar articles

Cited by

References

    1. Aarts E, Verhage M, Veenvliet JV, Dolan CV, van der Sluis S (2014) A solution to dependency: using multilevel analysis to accommodate nested data. Nat Neurosci 17:491–496. 10.1038/nn.3648 - DOI - PubMed
    1. Aarts E, Dolan CV, Verhage M, van der Sluis S (2015) Multilevel analysis quantifies variation in the experimental effect while optimizing power and preventing false positives. BMC Neurosci 16:94. 10.1186/s12868-015-0228-5 - DOI - PMC - PubMed
    1. Arlet M, Jubin R, Masataka N, Lemasson AJ (2015) Grooming-at-a-distance by exchanging calls in non-human primates. Biol Lett 11:20150711 10.1098/rsbl.2015.0711 - DOI - PMC - PubMed
    1. Balleine BW, O'doherty JP (2010) Human and rodent homologies in action control: corticostriatal determinants of goal-directed and habitual action. Neuropsychopharmacology 35:48 10.1038/npp.2009.131 - DOI - PMC - PubMed
    1. Beierholm U, Guitart-Masip M, Economides M, Chowdhury R, Düzel E, Dolan R, Dayan P (2013) Dopamine modulates reward-related vigor. Neuropsychopharmacology 38:1495–1503. 10.1038/npp.2013.48 - DOI - PMC - PubMed

Publication types

LinkOut - more resources