

Nutrient-sensitive transcription factors TFEB and TFE3 couple autophagy and metabolism to the peripheral clock
- PMID: 31126958
- PMCID: PMC6576167
- DOI: 10.15252/embj.2018101347
Nutrient-sensitive transcription factors TFEB and TFE3 couple autophagy and metabolism to the peripheral clock
Abstract
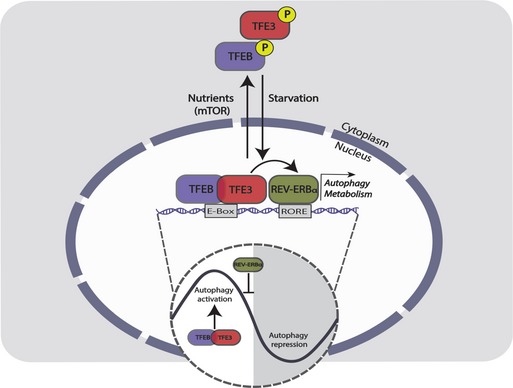
Autophagy and energy metabolism are known to follow a circadian pattern. However, it is unclear whether autophagy and the circadian clock are coordinated by common control mechanisms. Here, we show that the oscillation of autophagy genes is dependent on the nutrient-sensitive activation of TFEB and TFE3, key regulators of autophagy, lysosomal biogenesis, and cell homeostasis. TFEB and TFE3 display a circadian activation over the 24-h cycle and are responsible for the rhythmic induction of genes involved in autophagy during the light phase. Genetic ablation of TFEB and TFE3 in mice results in deregulated autophagy over the diurnal cycle and altered gene expression causing abnormal circadian wheel-running behavior. In addition, TFEB and TFE3 directly regulate the expression of Rev-erbα (Nr1d1), a transcriptional repressor component of the core clock machinery also involved in the regulation of whole-body metabolism and autophagy. Comparative analysis of the cistromes of TFEB/TFE3 and REV-ERBα showed an extensive overlap of their binding sites, particularly in genes involved in autophagy and metabolic functions. These data reveal a direct link between nutrient and clock-dependent regulation of gene expression shedding a new light on the crosstalk between autophagy, metabolism, and circadian cycles.
Keywords: MiT‐TFE; REV‐ERBα; circadian rhythm; gene oscillation.
© 2019 The Authors.
Conflict of interest statement
A. Ballabio is a co‐founder of CASMA Therapeutics, Boston, MA, USA.
Figures
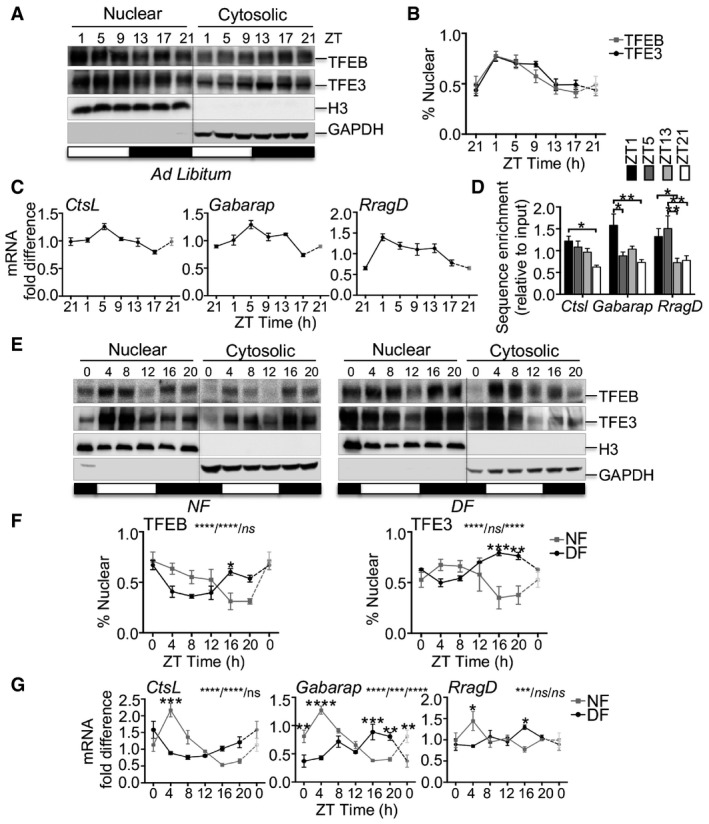
- A, B
Rhythmic activation of TFEB and TFE3 throughout the day determined by Western blot analysis of nuclear and cytosolic enriched liver fractions (A) and relative quantification (B) (n = 6 replicates/time point). The gray bars represent the dark cycle. Zeitgeber time ZT0: lights on; ZT14: light off. ZT21 is double‐plotted for visualization. Data are represented as mean ± SEM.
- C
mRNA expression levels of TFEB and TFE3 target genes in WT livers determined by qPCR analysis (n = 3 replicates/time point). ZT21 is double‐plotted for visualization. Data are represented as mean ± SEM.
- D
ChIP analysis of liver from WT mice for the indicated promoters (n = 4 per group). Bar graph represents the amount of immunoprecipitated DNA as detected by qPCR assay. Values were normalized to the input. Data are presented as mean ± SEM. (two‐way ANOVA test followed by the Bonferroni post hoc test: *P ≤ 0.05; **P < 0.01).
- E, F
Western blot analysis of nuclear and cytosolic liver fractions from mice fed exclusively during the night (NF) or during the day (DF) with relative quantification (n = 3 replicates/time point). The gray bars represent the dark cycle. Zeitgeber time ZT0: lights on; ZT12: light off. ZT0 is double‐plotted for visualization. Data are presented as mean ± SEM. (two‐way ANOVA test (interaction/time/group) followed by the Bonferroni post hoc test: ns non‐significant; *P ≤ 0.05; **P < 0.01; ***P < 0.001; ****P < 0.0001).
- G
Gene expression analysis of TFEB and TFE3 target genes in WT livers fed during the night or during the day (n = 3 replicates/time point). ZT0 is double‐plotted for visualization. Data are presented as mean ± SEM. (two‐way ANOVA test (interaction/time/group) followed by the Bonferroni post hoc test: ns non‐significant; *P ≤ 0.05; **P < 0.01; ***P < 0.001; ****P < 0.0001).
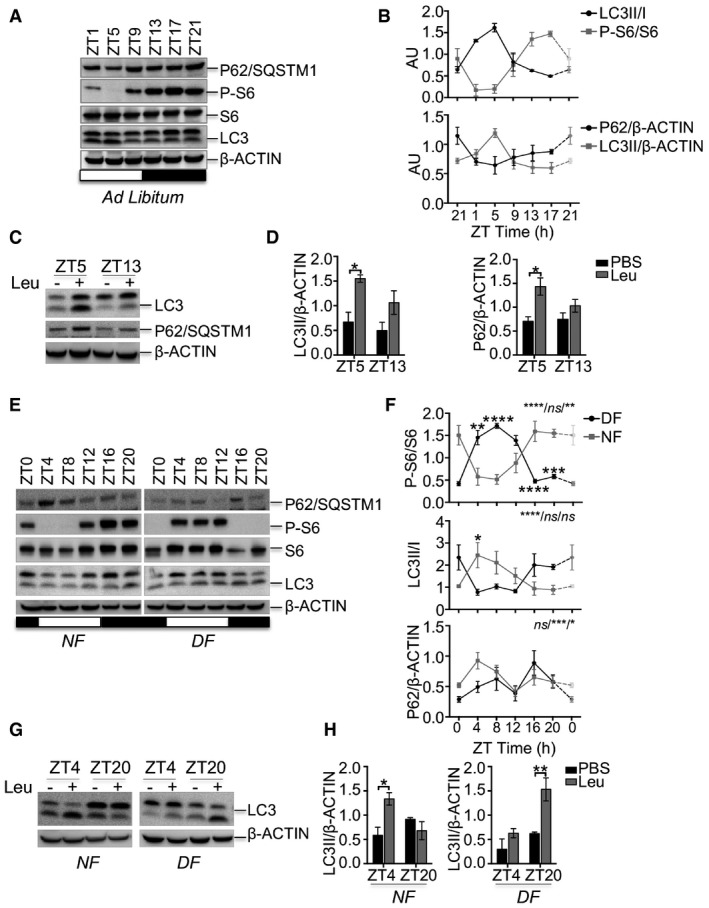
- A, B
Autophagy markers (LC3 and P62/SQSTM1) and mTORC1 activity as indicated by the phosphorylation of S6 ribosomal protein were measured during the 24‐h cycle in the liver from mice fed ad libitum. The plots represent average values of n = 3 for each time point expressed as ratio of LC3II/LC3I or LC3II/actin, p62/actin, and phosphorylated S6 versus pan‐S6. ZT21 is double‐plotted for visualization. Data are represented as mean ± SEM.
- C, D
Autophagy flux analysis in liver from WT mice fed ad libitum injected with leupeptin or PBS (C) and relative quantification (D) (n = 3 per group). Data are presented as mean ± SEM (two‐way ANOVA test followed by the Bonferroni post hoc test: *P < 0.05).
- E, F
Autophagy markers and mTORC1 activity as indicated by the phosphorylation of S6 ribosomal protein measured during the 24‐h cycle in the liver from mice fed during the night (NF) or during the day (DF). The plots represent average values of n = 3 for each time point. The gray bars represent the dark cycle. Zeitgeber time ZT0: lights on; ZT12: light off. ZT0 is double‐plotted for visualization. Data are presented as mean ± SEM (two‐way ANOVA test (interaction/time/group) followed by the Bonferroni post hoc test: (ns non‐significant; *P ≤ 0.05; **P < 0.01; ***P < 0.001; ****P < 0.0001).
- G, H
Autophagy flux analysis in liver from WT mice fed during the night (NF) or during the day (DF) injected with leupeptin or PBS (G) and relative quantification (H) (n = 3 per group). Data are presented as mean ± SEM. (two‐way ANOVA test followed by the Bonferroni post hoc test: *P < 0.05; **P < 0.01).
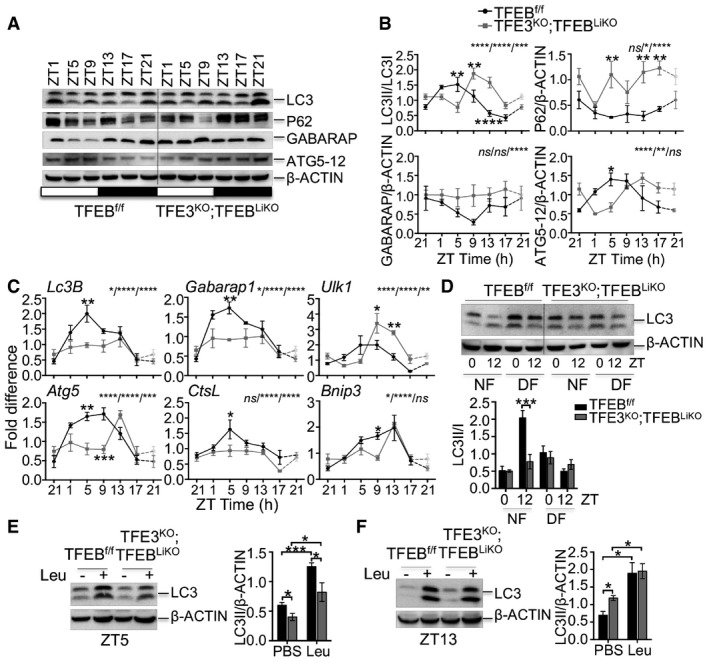
- A, B
Western blot analysis of autophagy protein throughout the day in liver samples collected every 4 h for 24 h from control and TFE3KO;TFEBLiKO mice (A) and relative quantification (B) (n = 3 per group/time point). ZT21 is double‐plotted for visualization. Data are presented as mean ± SEM. (two‐way ANOVA test (interaction/time/group) followed by the Bonferroni post hoc test: ns non‐significant; *P ≤ 0.05; **P < 0.01; ***P < 0.001; ****P < 0.0001).
- C
Diurnal mRNA expression of genes involved in autophagy in WT and TFE3KO;TFEBLiKO livers determined by qPCR analysis (n = 3 per group/time point). ZT21 is double‐plotted for visualization. Data are presented as mean ± SEM. (two‐way ANOVA test (interaction/time/group) followed by the Bonferroni post hoc test: ns non‐significant; *P ≤ 0.05; **P < 0.01; ***P < 0.001; ****P < 0.0001).
- D
Immunoblotting of liver lysates from mice undergoing restricted feeding and relative quantification (n = 3 per group/time point). Data are presented as mean ± SEM. (two‐way ANOVA test followed by the Bonferroni post hoc test: ***P < 0.001).
- E, F
LC3 protein levels in livers from mice kept under constant darkness and injected with PBS or leupeptin at ZT5 (E) and ZT13 (F) and relative quantification (n = 3 per group/time point). Data are represented as mean ± SEM (*P ≤ 0.05; ***P < 0.001 Student's t‐test).
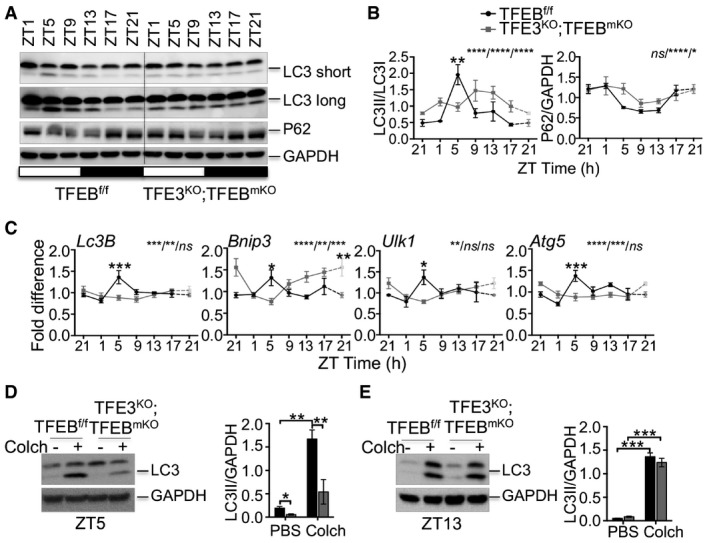
- A, B
Western blot analysis of autophagy protein throughout the day in muscle samples collected every 4 h for 24 h from control and TFE3KO;TFEBmKO mice (A) and relative quantification (B) (n = 3 per group/time point). ZT21 is double‐plotted for visualization. Data are presented as mean ± SEM. (two‐way ANOVA test (interaction/time/group) followed by the Bonferroni post hoc test: ns non‐significant; *P ≤ 0.05; **P < 0.01; ****P < 0.0001).
- C
mRNA expression analysis at different time points of genes involved in autophagy in WT and TFE3KO;TFEBmKO muscle determined by qPCR. (n = 3 per group/time point). ZT21 is double‐plotted for visualization. Data are presented as mean ± SEM (two‐way ANOVA test (interaction/time/group) followed by the Bonferroni post hoc test: ns non‐significant; *P ≤ 0.05; **P < 0.01; ***P < 0.001; ****P < 0.0001).
- D, E
LC3 protein levels in muscle from mice kept under constant darkness and injected with PBS or colchicine at ZT5 (D) and ZT13 (E) (n = 3 per group). Data are presented as mean ± SEM. (two‐way ANOVA test followed by the Bonferroni post hoc test: *P ≤ 0.05; **P < 0.01; ***P < 0.001).
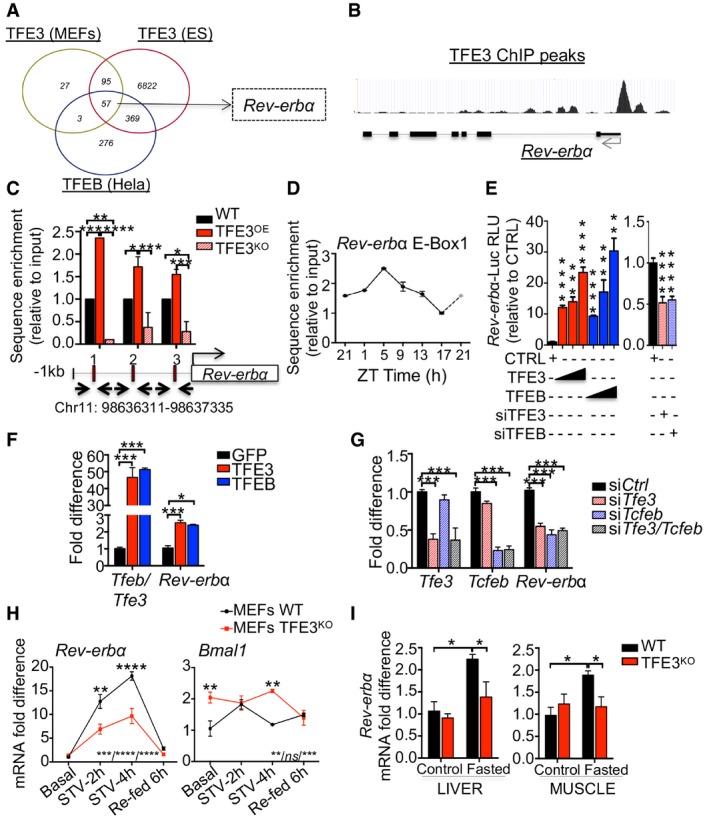
- A
Venn diagrams showing cross‐comparison of TFEB‐ and TFE3‐bound genes based on published ChIP‐seq dataset.
- B
TFE3 ChIP‐seq peaks in the promoter of Rev‐erbα in ES cells (Betschinger et al, 2013).
- C
ChIP analysis of livers from mice of the indicated genotypes (n = 2–4 per group). E‐Boxes in the promoter region of Rev‐erbα are indicated by squares. Bar graph represents the amount of immunoprecipitated DNA as detected by qPCR assay. Values were normalized to the input and plotted as relative enrichment over the WT control. Data are presented as mean ± SEM. (two‐way ANOVA test followed by the Bonferroni post hoc test: *P ≤ 0.05; **P < 0.01; ***P < 0.001).
- D
ChIP analysis for Rev‐erbα in WT livers at different time points (n = 3 per group/time point). Values were normalized to the input and plotted as relative enrichment over the ZT1 time point. ZT21 is double‐plotted for visualization. Data are represented as mean ± SEM.
- E
Luciferase activity for Rev‐erbα promoter measured after transfection of increasing amount of TFE3‐GFP or TFEB‐GFP or with siRNA against TFE3 and TFEB (n = 3 per group). Data are represented as mean ± SEM (**P < 0.01; ***P ≤ 0.001; ****P ≤ 0.0001 Student's t‐test).
- F, G
Quantification of mRNA levels of Rev‐erbα in Hepa1‐6 overexpressing (F) or knock‐down (G) for TFEB and TFE3 (n = 3 per group). Data are represented as mean ± SEM (*P ≤ 0.05; ***P ≤ 0.001 by Student's t‐test).
- H
mRNA levels of Rev‐erbα in WT and TFE3KO MEFs in response to nutrient starvation/stimulation at the indicated time points (n = 3 per group). Data are presented as mean ± SEM. (two‐way ANOVA test (interaction/time/group) followed by the Bonferroni post hoc test: ns non‐significant; **P < 0.01; ***P < 0.001; ****P < 0.0001).
- I
Transcript levels of Rev‐erbα in liver and muscle tissues isolated from mice with the indicated genotypes fasted for 24 h (n = 4–5 per group). Values were normalized to ribosomal protein S16 (Rps16) gene and expressed as fold change relative to control fed mice. Bars represent means ± SEM (two‐way ANOVA test followed by the Bonferroni post hoc test: *P ≤ 0.05).
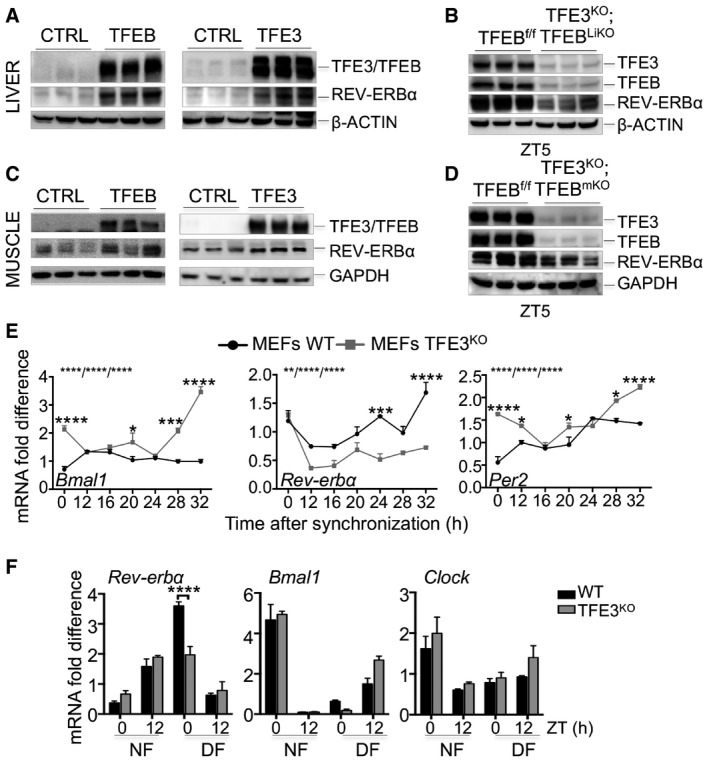
- A–D
TFEB and TFE3 overexpression results in increased levels of REV‐ERBα protein in liver (A) and muscle (C), while their depletion reduced REV‐ERBα protein amount (B, D).
- E
Time course expression of clock genes in WT and TFE3KO MEFs following dexamethasone synchronization (n = 3 per group/time point). Data are presented as mean ± SEM (two‐way ANOVA test (interaction/time/group) followed by the Bonferroni post hoc test: (*P ≤ 0.05; ***P < 0.001 ****P < 0.0001).
- F
qPCR analysis of total liver RNA isolated from control and TFE3KO mice subjected to night (NF) or day (DF) feeding as indicated in the method section (n = 3 per group/time point). Data are presented as mean ± SEM. (two‐way ANOVA test followed by the Bonferroni post hoc test: (***P < 0.001).
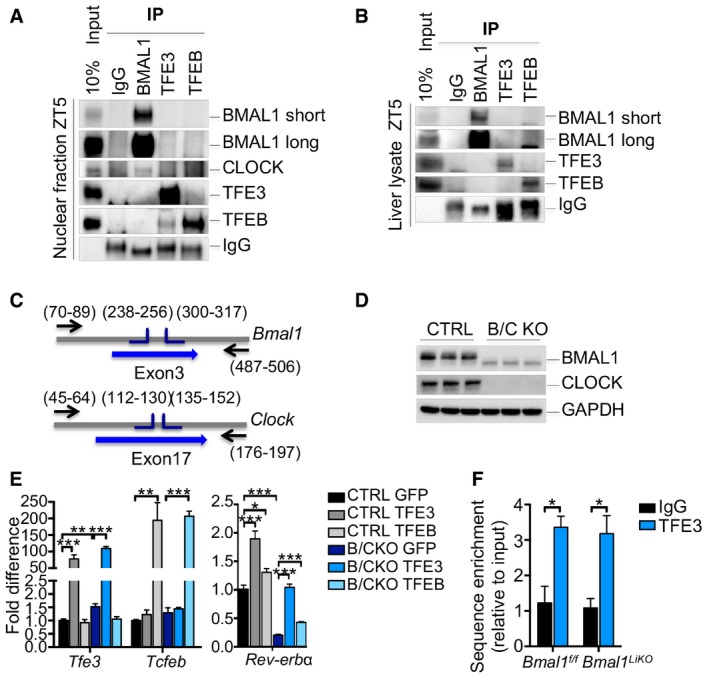
- A, B
Co‐immunoprecipitation analysis using the indicated antibodies in nuclear fraction (A) or whole lysate (B) from liver of WT mice fed ad libitum at ZT5.
- C
Representation of the strategy used for the generation of the BMAL1/CLOCK KO (B/C KO) Hepa1‐6 cells using CRISPR/Cas9 technology.
- D
Validation of the B/C KO cells by Western blot analysis.
- E
qPCR analysis of WT and B/C KO cells overexpressing TFEB and TFE3 (n = 3 per group). Data are represented as mean ± SEM (*P ≤ 0.05; **P ≤ 0.01; ***P ≤ 0.001 by Student's t‐test).
- F
ChIP analysis for Rev‐erbα in liver from mice of the indicated genotypes (n = 3 per group). Bar graph represents the amount of immunoprecipitated DNA as detected by qPCR assay. Values were normalized to the input and plotted as relative enrichment over the IgG control. Data are represented as mean ± SEM (*P ≤ 0.05 by Student's t‐test).
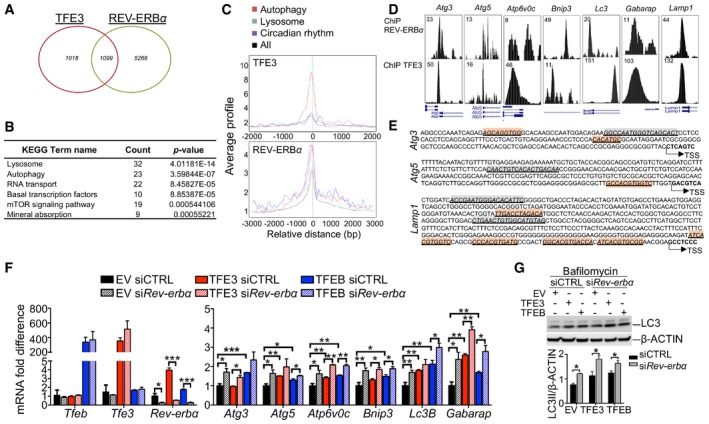
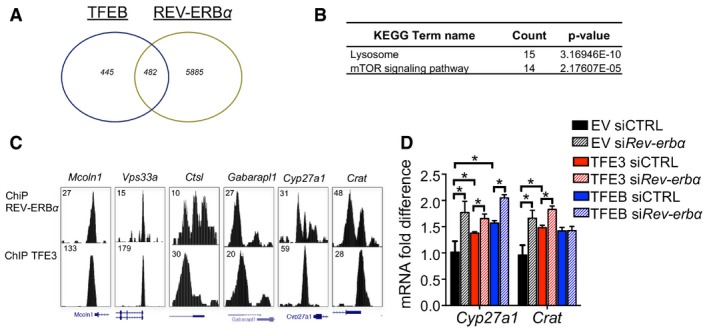
Venn diagram depicting the unique and shared TFE3 and REV‐ERBα binding peaks identified as reported in the Materials and Methods section. Fisher's exact test P‐value < 2.2e‐16.
KEGG analysis showing that shared TFE3 and REV‐ERBα peaks are enriched for genes involved in lysosome and metabolic pathway.
Average TFE3 and REV‐ERBα signals from −1 kb to +1 kb to the transcriptional start site (TSS).
TFE3 cistromes significantly overlap with REV‐ERBα in the promoter region of genes involved in autophagy and lysosome. Tag counts are shown in the corner.
E‐boxes/CLEAR (red) sites and RORE (green) location in the promoter of their target genes. Arrows indicate the number from transcriptional start site.
Expression analysis of autophagy‐related genes in Hepa1‐6 overexpressing TFEB or TFE3 and depleted for Rev‐erbα (n = 3 per group). mRNA levels were normalized using Rps16 and expressed as relative to cells transfected with scramble siRNA and empty vector. Data are represented as mean ± SEM (*P ≤ 0.05; **P ≤ 0.01; ***P ≤ 0.001 by Student's t‐test).
Western blot analysis of Hepa1‐6 overexpressing TFEB or TFE3 and depleted for Rev‐erbα (n = 3 per group). Cells were treated with bafilomycin for 4 h before collection to analyze the autophagy flux. Data are presented as mean ± SEM. (two‐way ANOVA test followed by the Bonferroni post hoc test: *P ≤ 0.05).
Venn diagram showing the unique and common TFEB and REV‐ERBα bindings. Fisher's exact test P‐value < 2.2e‐16.
KEGG analysis of the shared TFEB and REV‐ERBα peaks.
TFE3 and REV‐ERBα cistromes in the promoter region of genes involved in autophagy and lysosome. Tag counts are shown in the corner.
Expression analysis of circadian‐ and metabolism‐related genes in Hepa1‐6 overexpressing TFEB or TFE3 and depleted for Rev‐erbα (n = 3 per group). mRNA levels were normalized using Rps16 and expressed as relative to cells transfected with scramble siRNA and empty vector. Data are represented as mean ± SEM (*P ≤ 0.05; **P ≤ 0.01; ***P ≤ 0.001 by Student's t‐test).
- A
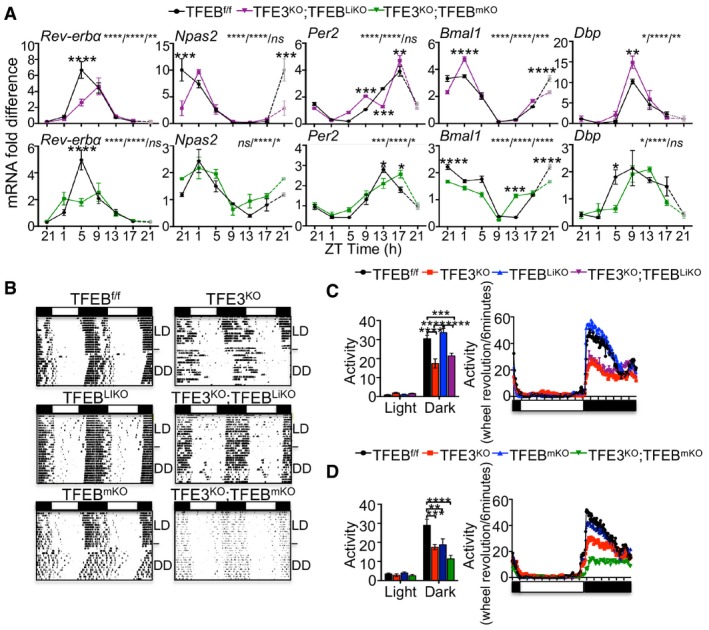
qPCR analysis of gene expression in liver (A) and muscle (B) from TFE3KO; TFEBcDKO and control mice over the 24‐h cycle (n = 3 per group/time point). ZT21 is double‐plotted for visualization. Data are presented as mean ± SEM (two‐way ANOVA test (interaction/time/group) followed by the Bonferroni post hoc test: ns non‐significant; *P ≤ 0.05; **P < 0.01; ***P < 0.001; ****P < 0.0001).
- B
Representative activity records (actograms) of mice of the indicated genotypes under normal light:dark cycles 14:10 (LD) or constant darkness (DD). Data were plotted in duplicate columns in each panel.
- C, D
Quantification of the overall activity during the LD period of mice at the indicated genotypes (n = 6–9 per group). Data are presented as mean ± SEM. (two‐way ANOVA test followed by the Bonferroni post hoc test: **P < 0.01; ***P < 0.001; ****P < 0.0001).
Comment in
-
Autophagy: clocking in for the night shift.EMBO J. 2019 Jun 17;38(12):e102434. doi: 10.15252/embj.2019102434. Epub 2019 May 27. EMBO J. 2019. PMID: 31133555 Free PMC article.
References
-
- Asher G, Schibler U (2011) Crosstalk between components of circadian and metabolic cycles in mammals. Cell Metab 13: 125–137 - PubMed
-
- Balsalobre A, Brown SA, Marcacci L, Tronche F, Kellendonk C, Reichardt HM, Schutz G, Schibler U (2000) Resetting of circadian time in peripheral tissues by glucocorticoid signaling. Science 289: 2344–2347 - PubMed
Publication types
MeSH terms
Substances
Grants and funding
LinkOut - more resources
Full Text Sources
Molecular Biology Databases
