. 2019 Jul 31;39(31):6162-6179.
doi: 10.1523/JNEUROSCI.2519-18.2019. Epub 2019 May 24.

Functional MRI and EEG Index Complementary Attentional Modulations

Affiliations

Functional MRI and EEG Index Complementary Attentional Modulations

Sirawaj Itthipuripat et al. J Neurosci. .

Abstract

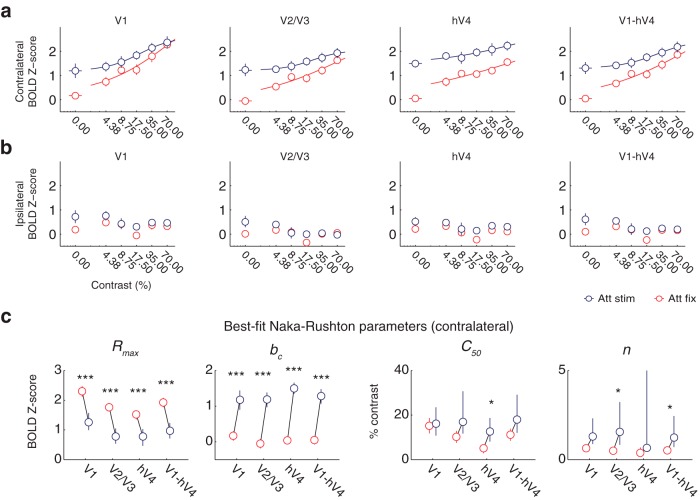
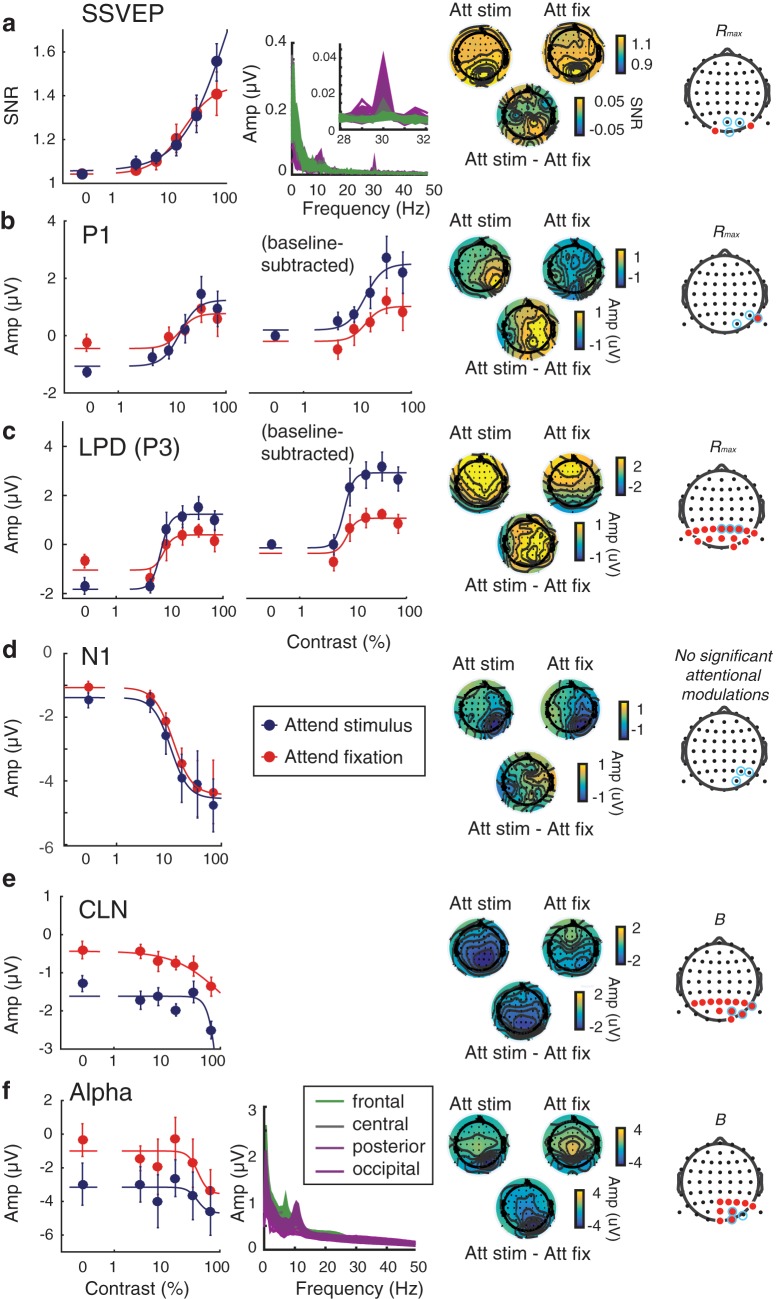
Functional magnetic resonance imaging (fMRI) and electroencephalography (EEG) are two noninvasive methods commonly used to study neural mechanisms supporting visual attention in humans. Studies using these tools, which have complementary spatial and temporal resolutions, implicitly assume they index similar underlying neural modulations related to external stimulus and internal attentional manipulations. Accordingly, they are often used interchangeably for constraining understanding about the impact of bottom-up and top-down factors on neural modulations. To test this core assumption, we simultaneously manipulated bottom-up sensory inputs by varying stimulus contrast and top-down cognitive modulations by changing the focus of spatial attention. Each of the male and female subjects participated in both fMRI and EEG sessions performing the same experimental paradigm. We found categorically different patterns of attentional modulation on fMRI activity in early visual cortex and early stimulus-evoked potentials measured via EEG (e.g., the P1 component and steady-state visually-evoked potentials): fMRI activation scaled additively with attention, whereas evoked EEG components scaled multiplicatively with attention. However, across longer time scales, a contralateral negative-going potential and oscillatory EEG signals in the alpha band revealed additive attentional modulation patterns like those observed with fMRI. These results challenge prior assumptions that fMRI and early stimulus-evoked potentials measured with EEG can be interchangeably used to index the same neural mechanisms of attentional modulations at different spatiotemporal scales. Instead, fMRI measures of attentional modulations are more closely linked with later EEG components and alpha-band oscillations. Considered together, hemodynamic and electrophysiological signals can jointly constrain understanding of the neural mechanisms supporting cognition.SIGNIFICANCE STATEMENT fMRI and EEG have been used as tools to measure the location and timing of attentional modulations in visual cortex and are often used interchangeably for constraining computational models under the assumption that they index similar underlying neural processes. However, by varying attentional and stimulus parameters, we found differential patterns of attentional modulations of fMRI activity in early visual cortex and commonly used stimulus-evoked potentials measured via EEG. Instead, across longer time scales, a contralateral negative-going potential and EEG oscillations in the alpha band exhibited attentional modulations similar to those observed with fMRI. Together, these results suggest that different physiological processes assayed by these complementary techniques must be jointly considered when making inferences about the neural underpinnings of cognitive operations.

Keywords: EEG; attention; contrast response functions; fMRI.


Figures

Figure 1.
Figure 1.
Predictions, behavioral task, and behavioral results. a, Different patterns of attentional gain modulations in CRFs measured in visual cortex. Past studies suggest that attention induces changes in response gain (Rmax), contrast gain (C50), or the CRF baseline activity (bc) depending on the size of the spatial scope of attention, stimulus properties, and training duration (Reynolds and Heeger, 2009; Herrmann et al., 2010; Itthipuripat et al., 2014a, 2017). Here, we predicted that measurement modality (e.g., fMRI vs EEG) was another source of differences in these modulatory patterns between studies. b, The spatial attention task. Each trial started with a color cue instructing human participants to attend to the central fixation point (i.e., attend-fixation) or to covertly attend to a stimulus on the left or the right of the fixation (i.e., attend-stimulus). The stimulus was flickered at 15 Hz (contrast-reversing) and its contrast was pseudo-randomly and uniformly drawn from one of six possible values (0, 4.38, 8.75, 17.50, 35, and 70% contrast values). Participants (n = 7) detected contrast changes at fixation or at the stimulus location in the attend-fixation and the attend-stimulus conditions, respectively (25% target trials). c, Behavioral performance was equated across all contrast levels, attention conditions, and measurement modalities. d, Contrast thresholds in the attend-stimulus condition were not different across measurement modalities. Error bars represent within-subject SEM.
Figure 2.
Figure 2.
BOLD response increases with stimulus contrast and spatial attention. a, Deconvolved HRFs from stimulus-activated voxels contralateral to the visual stimulus in each retinotopically-defined ROI (row), sorted by stimulus contrast (column), and attention condition (color). Directing attention to the attended stimulus increases BOLD response the most at lower stimulus contrasts, and BOLD responses scale with increasing stimulus contrast. b, Deconvolved HRFs for regions ipsilateral to stimulus presentation. BOLD responses do not strongly depend on contrast or attention, though negative deviations from baseline are prominent. Shaded interval indicates within-subjects SEM.
Figure 3.
Figure 3.
Univariate fMRI results across visual areas V1, V2/V3, hV4, and V1-hV4 (see corresponding statistical results in Table 1). a, Attentional modulations of the CRFs measured across visual areas contralateral to stimulus presentation. b, Same comparisons for ipsilateral areas. c, Corresponding fit parameters of the CRFs measured from contralateral areas shown in a. Significant differences between attention conditions (red, attend-fixation; blue, attend-stimulus) indicated with * for p values < 0.05 and *** for p values < 0.001. Error bars represent 68% CIs from resampling procedures.
Figure 4.
Figure 4.
Multivariate fMRI results across visual areas V1, V2/V3, hV4, and V1-hV4 (see corresponding statistical results Table 2). a, spatial reconstructions of visual stimuli across different contrast and attention conditions. b, plots of the amplitude, size, and reconstruction offset parameters of the spatial reconstructions shown in a as a function of stimulus contrast across different attention conditions. c, Corresponding Naka–Rushton fit parameters of the CRFs based on the amplitude (A) of surfaces fit to spatial reconstructions, shown in b (top). Significant differences between attention conditions (red, attend-fixation; blue, attend-stimulus) are indicated with * for p values < 0.05 and *** for p values < 0.001, respectively. Error bars represent 68% CIs from resampling procedures.
Figure 5.
Figure 5.
Spatial attention enhances response gain in evoked EEG components and CRF baseline activity in sustained components and induced alpha power. Spatial attention enhanced response gain (i.e., slope) of neural CRFs based on SSVEPs (a) and stimulus-evoked ERP components including the contralateral visual P1 (b) and the LPD (or P3; c). Spatial attention did not change the amplitude of the contralateral N1 component (d). However, it increased the CRF baseline activity of the CLN (e) and poststimulus alpha amplitude (f). The second panel in (a) demonstrates the frequency plot of the evoked oscillatory EEG signals where SSVEPs were sharply tuned at 30 Hz (i.e., a second harmonic of contrast-reversing stimulus flickering at 15 Hz) and peaked at the occipital electrodes. The second panels in b and c demonstrate the neural CRFs based on the P1 and LPD components where the best-fit baseline parameters were subtracted to better illustrate changes in the slopes of the CRFs. The second panel in f demonstrates the frequency plot of the induced oscillatory EEG signals where alpha activity peaked at ∼10–12 Hz in the occipital and posterior electrodes. The third panels of all figures show the topographical maps averaged across all contrast levels in the attend-stimulus and attend-fixation conditions (top left and right, respectively) and the difference between the two conditions (bottom). Blue rings in the fourth panels of all figures indicated the electrodes where the averaged CRF data in the first and second panels were obtained. These electrodes were selected because they exhibited the largest response based on the data collapsed across contrast and attention conditions. Red circles in the fourth panels of ac show electrodes in the occipital and parietal areas where differences in Rmax between attention conditions (multiplicative response gain increases) reached FDR-corrected significant levels (p values = 0–0.0044, 0, and 0–0.0272 for SSVEP, P1, and P3, respectively). Red circles in the fourth panels of e and f show electrodes in the occipital and parietal areas where CRF-baseline shifts (bc) between attention conditions reached FDR-corrected significant levels (p values = 0–0.0282 and 0–0.0138 for CNL and alpha, respectively). The left and right sides of all topographical maps represent positions ipsilateral and contralateral to the stimulus, respectively. Error bars represent 68% CIs from resampling procedures.
Figure 6.
Figure 6.
ERP traces evoked by stimuli of different contrast levels across different attention conditions. The ERP trace elicited on stimulus-absent trials (0% contrast) was subtracted from the ERPs evoked by stimuli of all other contrast levels (4.38–70%) to remove a slow-going negative potential that appeared to have an attention effect that was independent of stimulus contrast (Figs. 5e, 7). The subtracted waveforms contained the visual P1 component, the visual N1 component, and the LPD (or P3) that peaked from 120 to 130 ms at the contralateral posterior occipital electrodes, from 150 to 170 ms at the contralateral posterior occipital electrodes, and 250–350 ms at the midline posterior electrodes, respectively.
Figure 7.
Figure 7.
The slow-going negative waveform measured in the contralateral posterior occipital electrodes, termed here as CLN. This ERP component increased in amplitude when attention was directed to the stimulus location even in the absence of a visual stimulus (stimulus contrast of 0%). The topographical maps show the data from 0 to 2000 ms in 10 steps of 200 ms. The t values were thresholded to present only the data that passed a significance level of α ≤0.05, FDR-corrected (bottom-most panels). The left and right sides of the maps represent positions ipsilateral and contralateral to the stimulus, respectively.

References

    1. Andersen SK, Müller MM, Martinovic J (2012) Bottom-up biases in feature-selective attention. J Neurosci 32:16953–16958. 10.1523/JNEUROSCI.1767-12.2012 - DOI - PMC - PubMed
    1. Awh E, Jonides J (2001) Overlapping mechanisms of attention and spatial working memory. Trends Cogn Sci 5:119–126. - PubMed
    1. Awh E, Vogel EK, Oh SH (2006) Interactions between attention and working memory. Neuroscience 139:201–208. 10.1016/j.neuroscience.2005.08.023 - DOI - PubMed
    1. Benjamini Y, Hochberg Y (1995) Controlling the false discovery rate: a practical and powerful approach to multiple testing. J R Stat Soc B 57:289–300.
    1. Bosman CA, Schoffelen JM, Brunet N, Oostenveld R, Bastos AM, Womelsdorf T, Rubehn B, Stieglitz T, De Weerd P, Fries P (2012) Attentional stimulus selection through selective synchronization between monkey visual areas. Neuron 75:875–888. 10.1016/j.neuron.2012.06.037 - DOI - PMC - PubMed

Publication types