

Replisome activity slowdown after exposure to ultraviolet light in Escherichia coli
- PMID: 31127046
- PMCID: PMC6575178
- DOI: 10.1073/pnas.1819297116
Replisome activity slowdown after exposure to ultraviolet light in Escherichia coli
Abstract
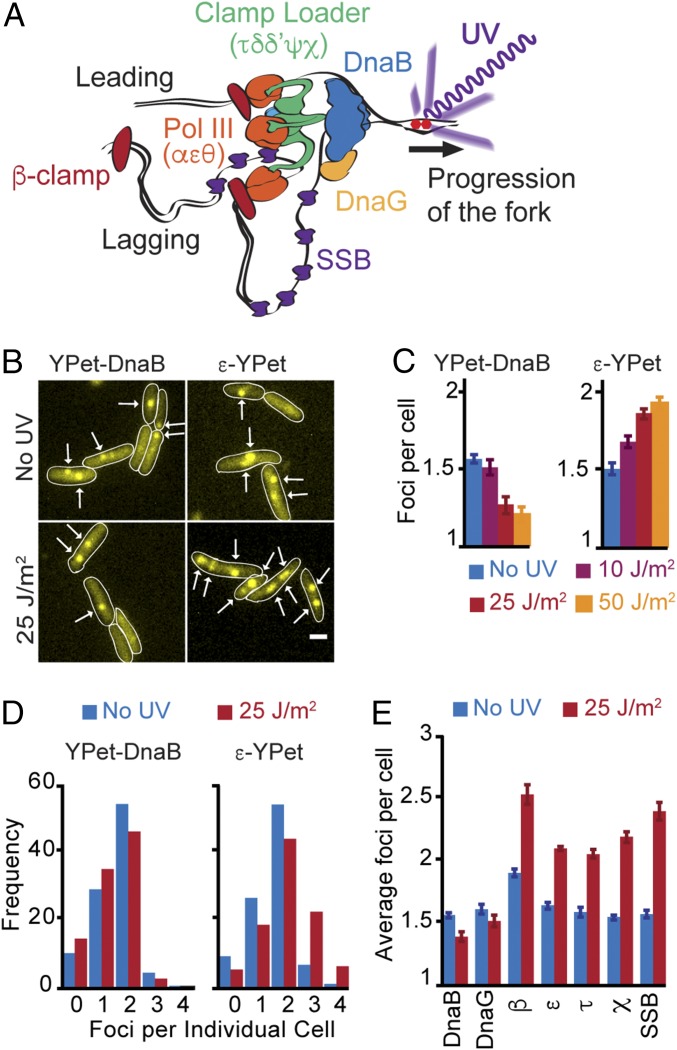
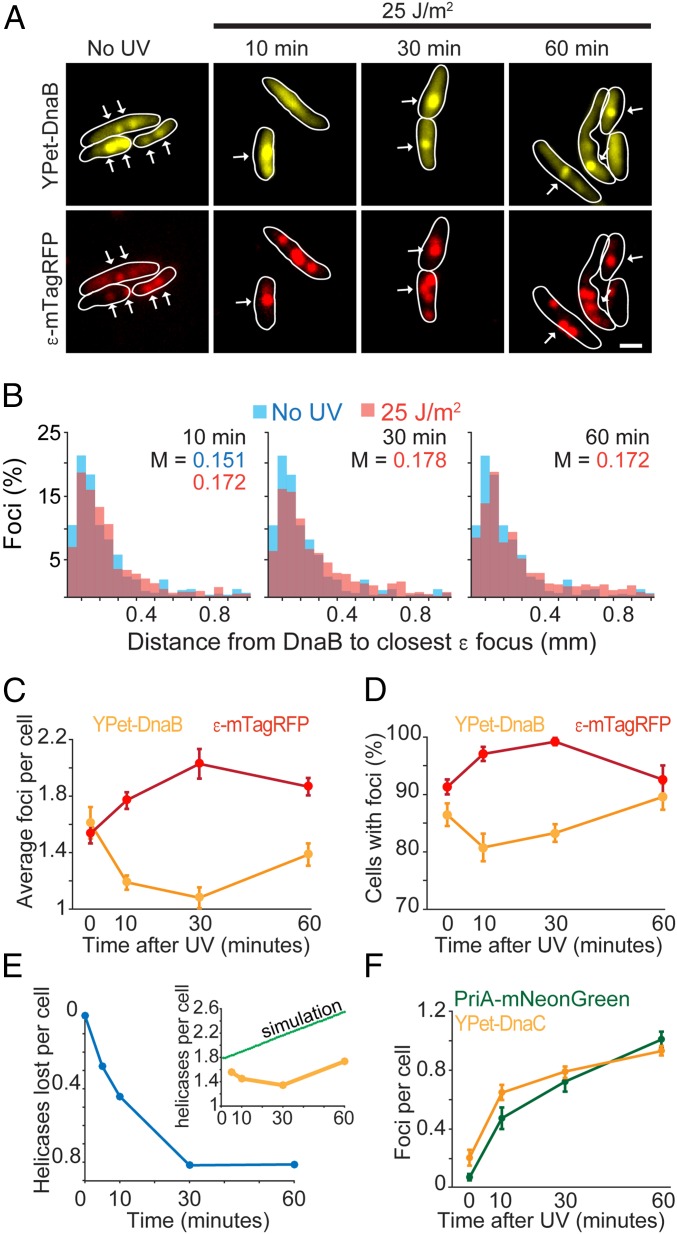
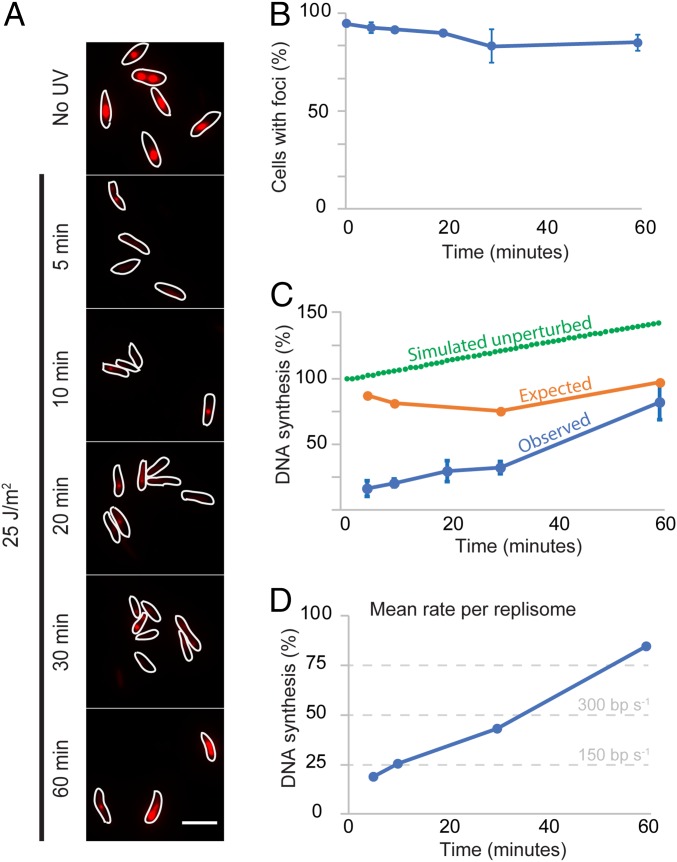
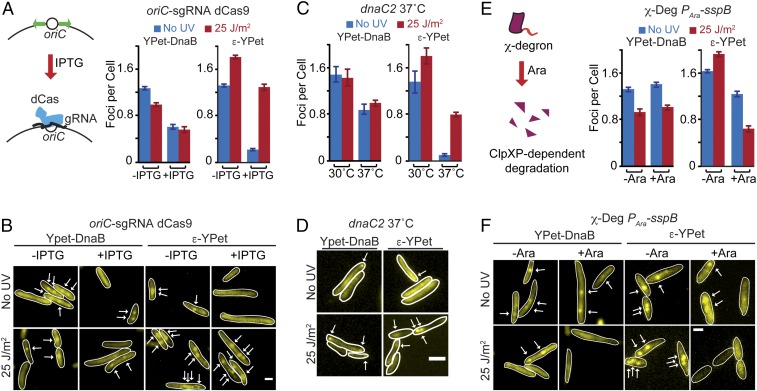
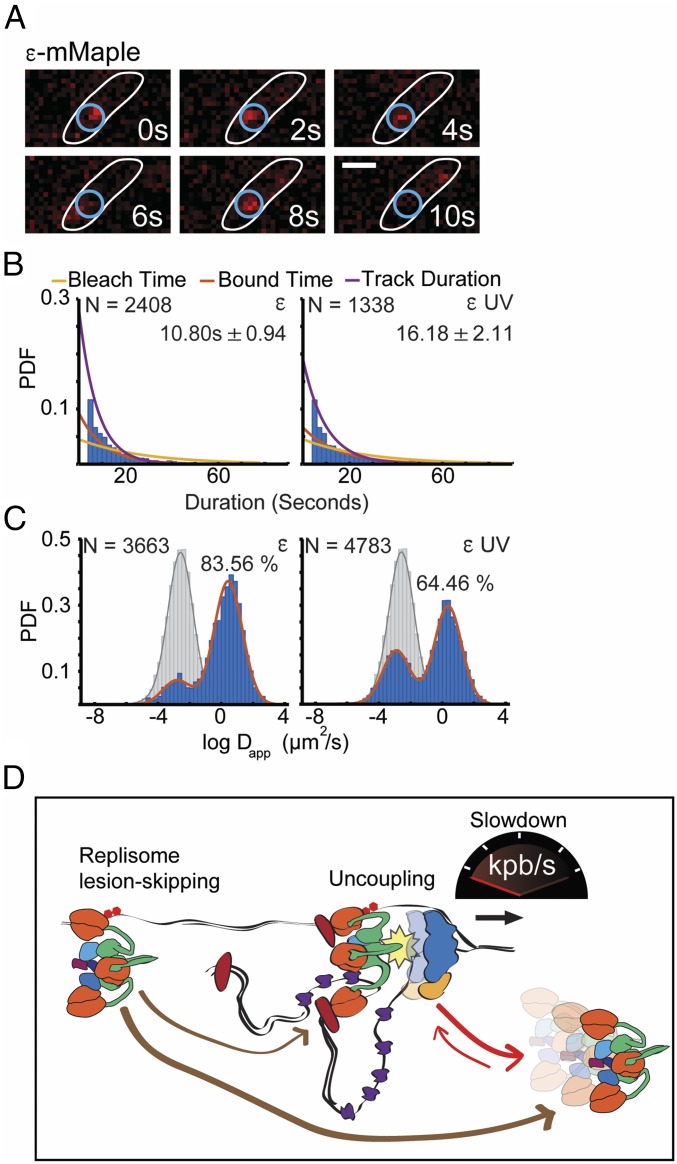
The replisome is a multiprotein machine that is responsible for replicating DNA. During active DNA synthesis, the replisome tightly associates with DNA. In contrast, after DNA damage, the replisome may disassemble, exposing DNA to breaks and threatening cell survival. Using live cell imaging, we studied the effect of UV light on the replisome of Escherichia coli Surprisingly, our results showed an increase in Pol III holoenzyme (Pol III HE) foci post-UV that do not colocalize with the DnaB helicase. Formation of these foci is independent of active replication forks and dependent on the presence of the χ subunit of the clamp loader, suggesting recruitment of Pol III HE at sites of DNA repair. Our results also showed a decrease of DnaB helicase foci per cell after UV, consistent with the disassembly of a fraction of the replisomes. By labeling newly synthesized DNA, we demonstrated that a drop in the rate of synthesis is not explained by replisome disassembly alone. Instead, we show that most replisomes continue synthesizing DNA at a slower rate after UV. We propose that the slowdown in replisome activity is a strategy to prevent clashes with engaged DNA repair proteins and preserve the integrity of the replication fork.
Keywords: DNA replication; Escherichia coli; UV; fluorescence microscopy; replisome.
Conflict of interest statement
The authors declare no conflict of interest.
Figures
Similar articles
-
Frequent exchange of the DNA polymerase during bacterial chromosome replication.Elife. 2017 Mar 31;6:e21763. doi: 10.7554/eLife.21763. Elife. 2017. PMID: 28362256 Free PMC article.
-
DnaB helicase dynamics in bacterial DNA replication resolved by single-molecule studies.Nucleic Acids Res. 2021 Jul 9;49(12):6804-6816. doi: 10.1093/nar/gkab493. Nucleic Acids Res. 2021. PMID: 34139009 Free PMC article.
-
The E. coli DNA Replication Fork.Enzymes. 2016;39:31-88. doi: 10.1016/bs.enz.2016.04.001. Epub 2016 May 13. Enzymes. 2016. PMID: 27241927 Review.
-
Translesion DNA polymerases remodel the replisome and alter the speed of the replicative helicase.Proc Natl Acad Sci U S A. 2009 Apr 14;106(15):6031-8. doi: 10.1073/pnas.0901403106. Epub 2009 Mar 11. Proc Natl Acad Sci U S A. 2009. PMID: 19279203 Free PMC article.
-
Whither the replisome: emerging perspectives on the dynamic nature of the DNA replication machinery.Cell Cycle. 2009 Sep 1;8(17):2686-91. doi: 10.4161/cc.8.17.9390. Epub 2009 Sep 29. Cell Cycle. 2009. PMID: 19652539 Free PMC article. Review.
Cited by
-
Visualizing mutagenic repair: novel insights into bacterial translesion synthesis.FEMS Microbiol Rev. 2020 Sep 1;44(5):572-582. doi: 10.1093/femsre/fuaa023. FEMS Microbiol Rev. 2020. PMID: 32556198 Free PMC article. Review.
-
Bacillus subtilis RadA/Sms-Mediated Nascent Lagging-Strand Unwinding at Stalled or Reversed Forks Is a Two-Step Process: RadA/Sms Assists RecA Nucleation, and RecA Loads RadA/Sms.Int J Mol Sci. 2023 Feb 25;24(5):4536. doi: 10.3390/ijms24054536. Int J Mol Sci. 2023. PMID: 36901969 Free PMC article.
-
Filamentous morphology of bacterial pathogens: regulatory factors and control strategies.Appl Microbiol Biotechnol. 2022 Sep;106(18):5835-5862. doi: 10.1007/s00253-022-12128-1. Epub 2022 Aug 22. Appl Microbiol Biotechnol. 2022. PMID: 35989330 Review.
-
Reactive oxygen species accumulation is synchronised with growth inhibition of temperature-sensitive recAts polA Escherichia coli.Arch Microbiol. 2022 Jun 16;204(7):396. doi: 10.1007/s00203-022-02957-z. Arch Microbiol. 2022. PMID: 35705748 Free PMC article.
-
Generation and Repair of Postreplication Gaps in Escherichia coli.Microbiol Mol Biol Rev. 2023 Jun 28;87(2):e0007822. doi: 10.1128/mmbr.00078-22. Epub 2023 May 22. Microbiol Mol Biol Rev. 2023. PMID: 37212693 Free PMC article. Review.
References
-
- Lewis J. S., Jergic S., Dixon N. E., The E. coli DNA replication fork. Enzymes 39, 31–88 (2016). - PubMed
-
- Tougu K., Marians K. J., The interaction between helicase and primase sets the replication fork clock. J. Biol. Chem. 271, 21398–21405 (1996). - PubMed
-
- Tougu K., Marians K. J., The extreme C terminus of primase is required for interaction with DnaB at the replication fork. J. Biol. Chem. 271, 21391–21397 (1996). - PubMed
-
- Gao D., McHenry C. S., Tau binds and organizes Escherichia coli replication through distinct domains. Partial proteolysis of terminally tagged tau to determine candidate domains and to assign domain V as the alpha binding domain. J. Biol. Chem. 276, 4433–4440 (2001). - PubMed
Publication types
MeSH terms
Substances
Grants and funding
LinkOut - more resources
Full Text Sources
