. 2019 Jun 11;116(24):11878-11887.
doi: 10.1073/pnas.1815601116. Epub 2019 May 24.

Predicting disease-causing variant combinations

Affiliations

Predicting disease-causing variant combinations

Sofia Papadimitriou et al. Proc Natl Acad Sci U S A. .

Abstract

Notwithstanding important advances in the context of single-variant pathogenicity identification, novel breakthroughs in discerning the origins of many rare diseases require methods able to identify more complex genetic models. We present here the Variant Combinations Pathogenicity Predictor (VarCoPP), a machine-learning approach that identifies pathogenic variant combinations in gene pairs (called digenic or bilocus variant combinations). We show that the results produced by this method are highly accurate and precise, an efficacy that is endorsed when validating the method on recently published independent disease-causing data. Confidence labels of 95% and 99% are identified, representing the probability of a bilocus combination being a true pathogenic result, providing geneticists with rational markers to evaluate the most relevant pathogenic combinations and limit the search space and time. Finally, the VarCoPP has been designed to act as an interpretable method that can provide explanations on why a bilocus combination is predicted as pathogenic and which biological information is important for that prediction. This work provides an important step toward the genetic understanding of rare diseases, paving the way to clinical knowledge and improved patient care.

Keywords: bilocus combination; oligogenic; pathogenicity; prediction; variants.


Conflict of interest statement

The authors declare no conflict of interest.

Figures

Fig. 1.
Fig. 1.
Examples of different cases of disease-causing bilocus variant combinations present in an individual, and which can be detected by the VarCoPP. (A) “True digenic” case, where mutations on both genes should be present to trigger any symptoms of the disease. Individuals with the mutation in either one of the two genes remain unaffected. (B) One example of a “composite” case, where one mutation at the most deleterious gene can be sufficient to show disease symptoms (affected parent), but the second mutation affects the severity of symptoms or the age of onset. (C) One example of a dual molecular diagnosis case, which concerns the simultaneous aggregation of variants that cause two independent Mendelian diseases, with or without overlapping phenotypes. It should be noted that dual molecular diagnosis cases can include different inheritance models (e.g., segregation of two recessive diseases).
Fig. 2.
Fig. 2.
Overlapping variants and bilocus combinations between the DIDA and 1KGP. (A) Statistics on 1KGP individuals carrying at least one DIDA independent variant or a disease-causing bilocus combination. (B) Histogram of 1KGP individuals carrying one or more DIDA variants (including those that carry DIDA combinations). (C) Histogram of the DIDA bilocus combinations found in the 1KGP and the diseases they are leading to.
Fig. 3.
Fig. 3.
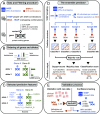
Summary of the methodology procedure for the construction of the VarCoPP and the validation process. (A) Genes and variants were filtered in the same way for both the 1KGP and DIDAv1. Individuals of the 1KGP carrying DIDAv1 combinations, as well as the overlapping combinations, were filtered out. Exonic variants [single-nucleotide polymorphism (SNPs) and indels] were used with a MAF frequency of ≤3%, including intronic and synonymous variants close to the exon edges (±13 nucleotides). The genes involved in the procedure were only confirmed protein-coding genes, following the gene types present in the DIDAv1. (B) Bilocus variant combination is represented always using four alleles (two alleles for gene A and two alleles for gene B), including wild-type alleles. This was done in accordance with the information present in the DIDA, where each bilocus combination contained, at maximum, two mutated alleles inside each gene. With this representation, the variant zygosity is also being considered (e.g., for a homozygous variant, both available alleles of the gene contain the same variant information). In this specific panel, we show a bilocus combination with a heterozygous variant in gene A (the second allele is wild-type) and two different heterozygous variants in gene B. Gene A is always the gene with the lowest Gene Damage Index (GDI) score, thus with the higher probability of being a deleterious gene. Different variant alleles inside the same gene were ordered based on their CADD pathogenicity score, with the variant present in the first allele of that gene always having the highest CADD score. (C) Initial number of biological features used for classification was 21, but the final selected and more relevant features were filtered to 11. These included information at the variant level [Flex1 and Hydr1 (i.e., flexibility and hydrophobicity amino acid differences of the first variant allele of gene A), as well as CADD1, CADD2, CADD3, and CADD4, (i.e., the CADD scores of the four different alleles of a bilocus combination)], gene level [RecA, RecB, HI_A, HI_B (i.e., recessiveness and haploinsufficiency probabilities for gene A and gene B)], and gene-pair level [BiolDist (i.e., biological distance, a metric of biological relatedness between two genes of a pair based on protein–protein interaction information)]. A more detailed explanation of the features is provided in SI Appendix, Table S4. (D) After the filtering process, the 1KGP dataset contained billions of bilocus combinations compared with the DIDAv1 set, which contained 200 bilocus combinations. To solve this class imbalance problem, 500 random 1KGP samples, each containing 200 bilocus combinations, were extracted using two types of stratification: Each sample contained an equal amount (41) of bilocus combinations from individuals of each continent as well as an equal distribution of degrees of separation (i.e., a metric of protein–protein interaction distance) between the genes of each pair, following the degrees of separation distribution of the DIDAv1. Each 1KGP sample was used against the complete DIDAv1 set to train an individual classifier that gives a class probability for each bilocus combination. Based on a majority vote among the individual classifiers, the output of the VarCoPP for each tested bilocus combination is the final class (“neutral” or “disease-causing”), the SS (i.e., the percentage of the classifiers agreeing about the pathogenic class), and the CS (i.e., the median probability among the individual predictors that the bilocus combination is pathogenic). (E) To validate the VarCoPP on new disease-causing data, we collected 23 bilocus combinations from independent scientific papers, which included gene pairs not used during the training phase. To perform confidence testing, we extracted three different random sets of 100, 1,000 and 10,000 bilocus combinations from the 1KGP set, which included gene pairs not used during the training phase of the VarCoPP. By exploring the number of FPs predicted with these neutral sets, we defined 95% and 99% confidence zones that provide the minimum SS and CS boundaries above, of which a bilocus combination has a 5% or 1% probability, respectively, of being a FP.
Fig. 4.
Fig. 4.
Distribution of the predictions of the DIDAv1 and of the independent test bilocus combinations, based on the CS on the x axis and the SS on the y axis. (A) SS > 50 and CS > 0.489 were required to label a bilocus combination as disease-causing. The red box represents the area where a bilocus combination is predicted as disease-causing, while the blue box represents the area where a bilocus combination is predicted as neutral. (B) Distribution of disease-causing bilocus combinations of the DIDAv1 during a cross-validation procedure. (C) Distribution of the 23 disease-causing bilocus combinations of the validation set. (D) Distribution of the 1,000 neutral test set combinations. The 95% confidence zone has a minimal boundary of CS = 0.55 and SS = 75, and contains combinations with a 5% probability of being FPs, while the 99% confidence zone has a minimal boundary of CS = 0.74 and SS = 100, and contains combinations with a 1% probability of being FPs.
Fig. 5.
Fig. 5.
Boxplot of the Gini importance for each feature among all 500 individual predictors of the VarCoPP using the training DIDA and 1KGP data.
Fig. 6.
Fig. 6.
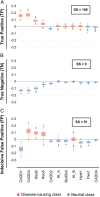
Decision profile (DP) boxplots that show the class preference (or decision) gradients of each feature used for the classification of test bilocus combinations. Features whose median decision gradient values, among all classifiers of the VarCoPP, fall above zero on the y axis are in favor of the disease-causing class (red color), whereas features whose median decision gradient values fall below zero on the y axis are in favor of the neutral class (blue color). (A) DP boxplot for a TP bilocus combination with SS = 100 (Dataset S1, testpos_21), where the vast majority of features have a median decision value above zero. (B) DP boxplot for a TN bilocus combination with SS = 0 (Dataset S3, testneg_769), where all features have a median decision value below zero agreeing for the neutral class. (C) Example of an indecisive DP boxplot for a neutral bilocus combination of the set of 1,000 test neutral combinations, which was predicted as disease-causing with SS = 51 (Dataset S3, testneg_358).

References

    1. ENCODE Project Consortium , An integrated encyclopedia of DNA elements in the human genome. Nature 489, 57–74 (2012). - PMC - PubMed
    1. Fu W., et al. ; NHLBI Exome Sequencing Project , Analysis of 6,515 exomes reveals the recent origin of most human protein-coding variants. Nature493, 216–220 (2013). Erratum in: Nature495, 270 (2013). - PMC - PubMed
    1. Lek M., et al. ; Exome Aggregation Consortium , Analysis of protein-coding genetic variation in 60,706 humans. Nature 536, 285–291 (2016). - PMC - PubMed
    1. NHLBI GO Exome Sequencing Project (ESP) , Exome Variant Server. http://evs.gs.washington.edu/EVS/. Accessed 15 May 2019.
    1. 1000 Genomes Project Consortium , Auton A., et al. , A global reference for human genetic variation. Nature 526, 68–74 (2015). - PMC - PubMed

Publication types

MeSH terms

Substances