. 2019 May 24;10(1):2299.
doi: 10.1038/s41467-019-10055-w.

The cell-wide web coordinates cellular processes by directing site-specific Ca2+ flux across cytoplasmic nanocourses

Affiliations

The cell-wide web coordinates cellular processes by directing site-specific Ca2+ flux across cytoplasmic nanocourses

Jingxian Duan et al. Nat Commun. .

Abstract

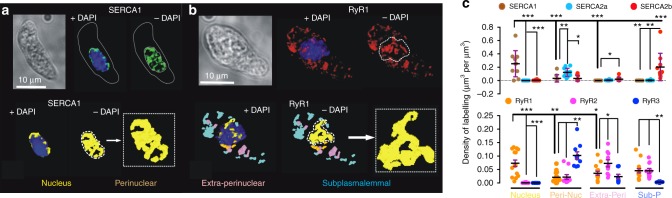
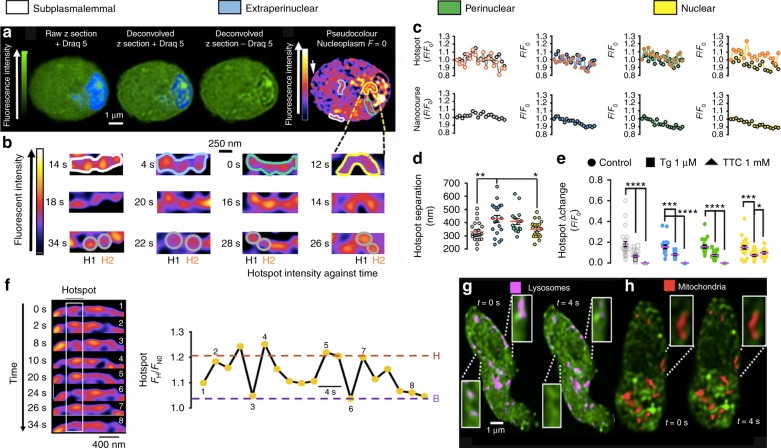
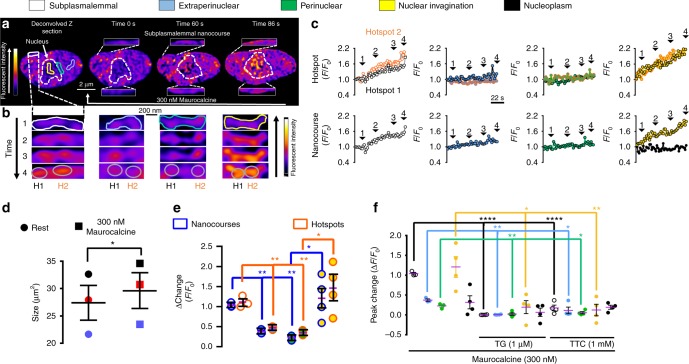
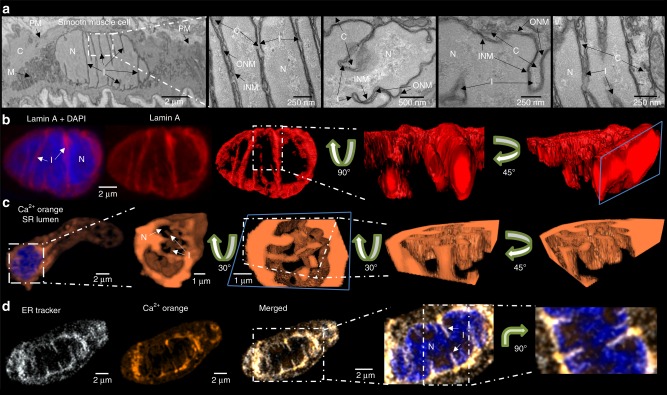
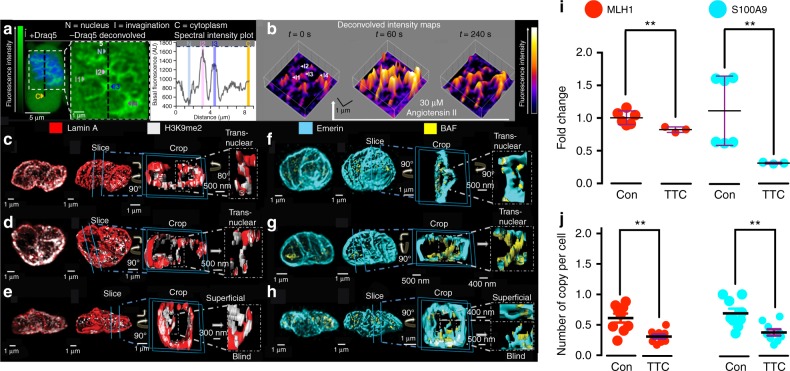
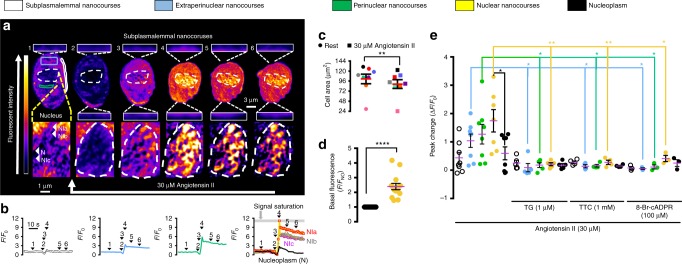
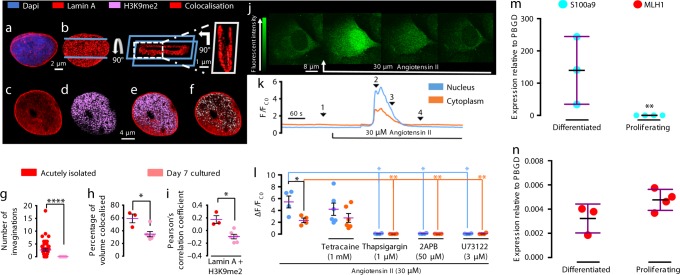
Ca2+ coordinates diverse cellular processes, yet how function-specific signals arise is enigmatic. We describe a cell-wide network of distinct cytoplasmic nanocourses with the nucleus at its centre, demarcated by sarcoplasmic reticulum (SR) junctions (≤400 nm across) that restrict Ca2+ diffusion and by nanocourse-specific Ca2+-pumps that facilitate signal segregation. Ryanodine receptor subtype 1 (RyR1) supports relaxation of arterial myocytes by unloading Ca2+ into peripheral nanocourses delimited by plasmalemma-SR junctions, fed by sarco/endoplasmic reticulum Ca2+ ATPase 2b (SERCA2b). Conversely, stimulus-specified increases in Ca2+ flux through RyR2/3 clusters selects for rapid propagation of Ca2+ signals throughout deeper extraperinuclear nanocourses and thus myocyte contraction. Nuclear envelope invaginations incorporating SERCA1 in their outer nuclear membranes demarcate further diverse networks of cytoplasmic nanocourses that receive Ca2+ signals through discrete RyR1 clusters, impacting gene expression through epigenetic marks segregated by their associated invaginations. Critically, this circuit is not hardwired and remodels for different outputs during cell proliferation.


Conflict of interest statement

The authors declare no competing interests.

Figures

Fig. 1
Fig. 1
Discrete clusters of SERCA1 and RyR1 are targeted to the nuclear envelope. a Upper panels, left to right, bright field image of an arterial myocyte and 3D deconvolved fluorescence images (Deltavision, doconvolution) of SERCA1 labelling (green). Lower panels, left to right, digital skin encapsulating SERCA1 labelling ± nuclear labelling (blue, DAPI). b As for (a) but for RyR1 labelling (red). c Dot plot shows density of labelling (μm3 per μm3, mean ± SEM) for (upper panels) SERCA1 (n = 10 cells from 3 rats), SERCA2a (n = 12 cells from 3 rats) and SERCA2b (n = 10 cells from 3 rats) and (lower panels) RyR1 (n = 15 cells from 3 rats), RyR2 (n = 12 cells from 3 rats) and RyR3 (n = 10 cells from 3 rats) within the 4 designated regions of the cell; one-way ANOVA followed by a Tukey post-hoc test: *p < 0.05, **p < 0.01, ***p < 0.001
Fig. 2
Fig. 2
SR Ca2+ flux within a cell-wide circuit of cytoplasmic nanocourses of arterial myocytes. a (left to right), confocal z sections through acutely isolated arterial myocyte loaded with Fluo-4 (green, calcium indicator) and Draq 5 (blue, nucleus), then deconvolved, and pseudocolor applied to show relative Fluo-4 intensity. Regions of interest identify exemplar subplaslemmal (white), extraperinuclear (blue), perinuclear (green) and nuclear (yellow) nanocourses. b (left to right), nanocourses in (a) at higher magnification and different time points; note, thresholds set independently to visualise hotspots. Grey circles identify hotspots (H1, black; H2, orange) of Ca2+ flux in exemplar nanocourses. c Fluo-4 fluorescence ratio (Fx/F0; where F0 = fluorescence at time 0 and Fx = fluorescence at time = x) versus time (sampling frequency = 0.5 Hz) for H1 and H2 (upper panels, left to right) and the average for the whole nanocourse (lower panels, left to right). d Scatter plot shows distances separating hotspots (mean ± SEM; ≥36 hotspots, n = 7 cells from 7 rats) within subplasmalemmal (white), extraperinuclear (blue), perinuclear (green) and nuclear (yellow) nanocourses. e Dot plots show the effect of thapsigargin (1 µM; 30 min pre-incubation; n = 3 cells from 3 rats) and tetracaine (1 mM; 4 h pre-incubation; n = 5 cells from 4 rats) on the amplitude (mean ± SEM) of Fluo-4 fluorescence ratio change (ΔFX/F0); t-test with Welch’s correction: *p < 0.05, **p < 0.01, ***p < 0.001, ****p < 0.0001. f Image time series highlights (white rectangle) time-dependent intensity fluctuation of one hotspot in a different subplasmalemmal nanocourse (arrow in (a), upper panel, right most image), with a record of fluorescence intensity against time (ΔFH/FN0; H = hotspot, N0 = nanocourse at time = 0) from basal (B) to high intensity (H) states; note prolonged sub-state. g Deconvolved time series of z sections (0.25 Hz) show LysoTracker Red labelled endolysosomes in cytoplasmic nanocourses identified by Fluo-4 (confirmed in 3 cells from 3 different animals). h As for (g), but for mitochondria labelled with MitoTracker Red (confirmed in 3 cells from 3 different animals). Pseudocolour look up tables in (a) and (b) indicate relative fluorescence intensity in arbitrary units
Fig. 3
Fig. 3
Maurocalcine gates Ca2+ flux into subplasmalemmal nanocourses and nuclear invaginations. a (upper panels) Deconvolved confocal images show pseudocolour representations of Fluo-4 fluorescence intensity in z sections through an acutely isolated arterial myocyte (white broken line identifies nucleus) before and during application of 300 nM Maurocalcine (white arrow). White boxes inset show example subplasmalemmal nanocourses at higher magnification. b From left to right, high magnification examples of subplasmalemmal (white), extraperinuclear (blue), perinuclear (green) and nuclear (yellow) nanocourses identified by regions of interest in (a), at three different time points. Grey circles identify for each nanocourse, two hotspots (H1, black; H2, orange) of Ca2+ flux. c Fluo-4 fluorescence ratio (Fx/F0; where F0 = fluorescence at time 0 and Fx = fluorescence at time = x) versus time (sampling frequency = 0.5 Hz) for H1 and H2 of each nanocourse (upper panels, from left to right) compared to the average for the whole nanocourse (lower panels, from left to right). d Dot plot shows cell area (µm2; mean ± SEM) before and after extracellular application of 300 nM Maurocalcine (n = 3 cells from 3 rats). e Dot plot shows peak change (ΔFx/F0; mean ± SEM; n = 3 cells from 3 rats) for Fluo-4 intensity for hotspots and nanocourses within each region of interest at the peak of the response to Maurocalcine (300 nM). f As for (e) but for whole nanocourses in the absence and presence of thapsigargin (1 µM, 30 min pre-incubation; n = 4 cells from 3 rats) or tetracaine (1 mM; 4 h pre-incubation; n = 4 cells from 4 rats); t-test with Welch’s correction: *p < 0.05, **p < 0.01, ***p < 0.001, ****p < 0.0001. The pseudocolour look up tables in (a) and (b) indicate relative fluorescence intensity in arbitrary units
Fig. 4
Fig. 4
Nuclear invaginations demarcate a releasable Ca2+ store and cytoplasmic nanotubes. a Electron micrographs of artery sections, show (left to right) arterial smooth muscle cells at low and high magnification and identify invaginations (I) of the inner (INM) and outer (ONM) nuclear membrane: PM plasma membrane, C cytoplasm, M mitochondria, N nucleus; confirmed in 4 arteries from 4 rats. b Left hand panel shows 3D reconstruction of a deconvolved z stack of confocal images through the nucleus of an arterial myocyte labelled for lamin A (red) with (left panel) and without (middle panel) DAPI (blue) to identify the nucleus (N) and its invaginations (I); confirmed in 54 cells from 14 rats. Right panel, higher threshold and ‘digital surface skin’ applied to select for nuclear invaginations by way of their higher density of labelling for lamin A. Then, higher magnification transverse section through the 3D image of lamin A labelling shown at 2 different angles. c (left to right), 3D reconstruction of a deconvolved z stack of confocal images showing Calcium Orange fluorescence (orange) from within the lumen of the sarcoplasmic (SR) and nucleoplasmic reticulum (SR) of an arterial myocyte, with the nucleoplasm identified (Draq5, blue), higher magnification transverse section through the nucleus of same cell without Draq5 (N, nucleus; I, invaginations), application of digital skin (30° image rotation) and longitudinal section through the centre of the nucleus, then a transverse section through the nucleus (45° image rotation); confirmed in 5 cells from 3 rats. d (from left to right), Deconvolved confocal z section through the middle of a pulmonary arterial myocyte showing ER-tracker identified SR and outer nuclear membrane (white), Calcium Orange fluorescence (orange), merged image showing ER-tracker and Calcium Orange fluorescence, higher magnification images with Draq5 identifying the nucleus and its invaginations (N, nucleus; I, invaginations), and a 90° rotation; confirmed in 4 cells from 3 rats
Fig. 5
Fig. 5
Ca2+ flux into nuclear invaginations regulates gene expression. a (from left to right) Confocal z section of Fluo-4 fluorescence in an arterial myocyte (green) ± nuclear label (blue, Draq5), indicating perinuclear cytoplasm (C), nuclear invaginations (I1, I2, I3, I4) and nucleoplasm (N), and fluorescence intensity plot along vertical dashed black line marked in images. b Time series of 3D intensity maps for nuclear region of cell in (a) during application of Angiotensin II (30 μM, white arrow). c (from left to right) 3D reconstruction of section through the nucleus of a myocyte labelled for lamin A (red; confirmed in 54 cells from 14 rats) and showing co-localisation with H3K9me2 (white; confirmed in 14 cells from 5 rats), then same image with digital skin, sectioned and rotated to identify a transnuclear invagination. d, e As in (c) but different cells. fh As in (ce), but showing BAF co-localisation with emerin; confirmed in 10 cells from 4 rats. i, j Dot plots show (mean ± SEM) the effect of blocking RyRs with tetracaine (TTC, 1 mM, 90 min pre-incubation) on MLH1 and S100A9 expression in acutely isolated pulmonary arterial myocytes, assessed by i q-RT-PCR (assayed in triplicate, for n = 3 rats) and j RNAscope (counts per cell, 14–57 cells per plate, n = 9 independent experiments from 3 rats); t-test with Welch’s correction: **p < 0.01. The green and pseudocolour look up tables in (a) and (b) indicate relative fluorescence intensity in arbitrary units
Fig. 6
Fig. 6
Angiotensin II induces myocyte contraction by directing propagating Ca2+ signals through nanocourses. a (upper panels), Time series of deconvolved z sections shows pseudocolour representations of Fluo-4 fluorescence intensity in an arterial myocyte (white broken line indicates nucleus) during Angiotensin II application (30 µM, white arrow). Insets above and below image show example subplasmalemmal nanocourses at higher magnification. Lower panels as in upper panels but showing changes in Fluo-4 fluorescence intensity within nuclear nanocourses (white arrows indicate: nucleoplasm, N; Nuclear nanocourses, NI1, NI2 and NI3). Note, with cell-wide acquisition of Angiotensin II responses, signal saturation (grey bar) in some nuclear nanocourses was unavoidable (excluded from quantitative analysis). b Fluo-4 fluorescence ratio (Fx/F0; where F0 = fluorescene at time 0 and Fx = fluorescence at time = x) versus time (sampling frequency 0.5 Hz) for a subplasmalemmal nanocourse (white), regions of interest within the extraperinuclear (blue) and perinuclear (green) areas of the cell (extra/perinuclear nanocourses could not be followed during contraction), and for nuclear nanocourses (NI1–3, yellow) and nucleoplasm (N, black). c Dot plot shows cell area (µm2; mean ± SEM) before and after Angiotensin II (30 µM; n = 8 cells from 4 rats). d Dot plot shows basal Fluo-4 intensity (F/FNO; mean ± SEM; n = 8 cells from 4 rats) within the nucleoplasm (black) and nuclear nanocourses (yellow). e Dot plots show peak change (ΔFx/FNO; mean ± SEM) for Fluo-4 intensity within specified region of interest after Angiotensin II (30 µM; n = 8 cells from 4 rats), in the absence and presence of thapsigargin (1 µM; 30 min pre-incubation; n = 5 cells from 5 rats), tetracaine (1 mM; 4 h pre-incubation; n = 4 cells from 4 rats) and 8-bromo-cADPR (100 µM; 30 min pre-incubation; n = 3 cells from 3 rats); t-test with Welch’s correction: *p < 0.05, **p < 0.01, ***p < 0.001, ****p < 0.0001. The pseudocolour look up table in (a) indicates relative fluorescence intensity in arbitrary units
Fig. 7
Fig. 7
Nuclear invaginations and nanocourses are dismantled during myocyte proliferation. a (left to right), 3D reconstruction of deconvolved confocal z stack through the nucleus (DAPI, blue) of a proliferating arterial myocyte labelled for lamin A (red). b Digital skin applied, a transverse then longitudinal section through and rotations of the nucleus. c Different proliferating myocyte. d As in (c) labelled for H3K9me2 (magenta). e (c) and (d) merged. f Merged image showing lamin A (red) labelling and H3K9me2 co-localisation (white). g Dot plot shows number of lamin A labelled nuclear invaginations per cell in acutely isolated arterial myocytes (red; n = 54 cells from 14 rats) and proliferating cells (pink; n = 9 cells from 5 rats). h Dot plot shows percentage volume of lamin A and H3K9me2 colocalization (n = 3 acutely isolated cells from 3 rats; n = 6 cultured cells, from 3 rats). i Dot plot shows Pearson’s correlation coefficient colocalization (n = 3 acutely isolated cells from 3 rats; n = 6 cultured cells, from 3 rats). j Deconvolved z sections of Fluo-4 fluorescence in a proliferating myocyte (left to right) before and during application of (white arrow) 30 µM Angiotensin II. k Records of Fluo-4 fluorescence (Fx/FC0; FC0 = cytoplasm fluorescence at time = 0, Fx = fluorescence at time = x) against time for the cytoplasm (orange) and nucleus (blue). l Dot plot for peak change (ΔFx/FC0; mean ± SEM; n = 8 cells from 4 rats) induced by 30 µM Angiotensin II in the absence and presence of: tetracaine (1 mM; 4 h pre-incubation; n = 5 cells from 3 rats); thapsigargin (1 µM; 30 min pre-incubation; n = 4 cells from 3 rats), 2-Aminoethoxydiphenyl-borate (2APB, 50 µM; 30 min pre-incubation; n = 4 cells from 3 rats) and U73122 (3 µM; 30 min pre-incubation; n = 4 cells from 3 rats); one-way ANOVA with Dunnett’s multiple comparisons test: *p < 0.05, ** p < 0.01, ***p < 0.001, ****p < 0.0001. m, n Dot plots show (mean ± SEM) q-RT-PCR measures of S100A9 (m) and MLH1 (n) expression in proliferating myocytes; n = 3 rats (in triplicate); one-way ANOVA with Dunnett’s multiple comparisons test: **p < 0.01

Similar articles

Cited by

References

    1. Plattner H, Verkhratsky A. Evolution of calcium signalling. Cell Caclium. 2015;57:121–122. doi: 10.1016/j.ceca.2015.02.007. - DOI - PubMed
    1. Berridge MJ. Smooth muscle cell calcium activation mechanisms. J. Physiol. 2008;586:5047–5061. doi: 10.1113/jphysiol.2008.160440. - DOI - PMC - PubMed
    1. Cheng H, Lederer WJ, Cannell MB. Calcium sparks: elementary events underlying excitation–contraction coupling in heart muscle. Science. 1993;262:740–744. doi: 10.1126/science.8235594. - DOI - PubMed
    1. Asada Y, Yamazawa T, Hirose K, Takasaka T, Iino M. Dynamic Ca2+ signalling in rat arterial smooth muscle cells under the control of local renin–angiotensin system. J. Physiol. 1999;521:497–505. doi: 10.1111/j.1469-7793.1999.00497.x. - DOI - PMC - PubMed
    1. Wang SQ, et al. Imaging microdomain Ca2+ in muscle cells. Circ. Res. 2004;94:1011–1022. doi: 10.1161/01.RES.0000125883.68447.A1. - DOI - PubMed

Publication types

MeSH terms

Substances