

The stability of multitrophic communities under habitat loss
- PMID: 31127118
- PMCID: PMC6534601
- DOI: 10.1038/s41467-019-10370-2
The stability of multitrophic communities under habitat loss
Abstract
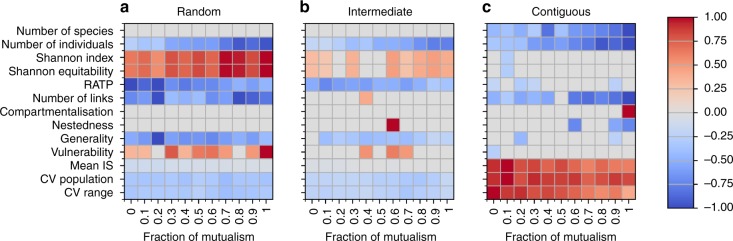
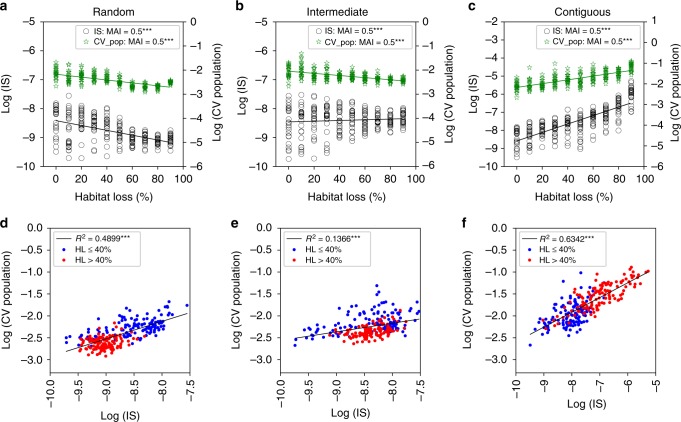
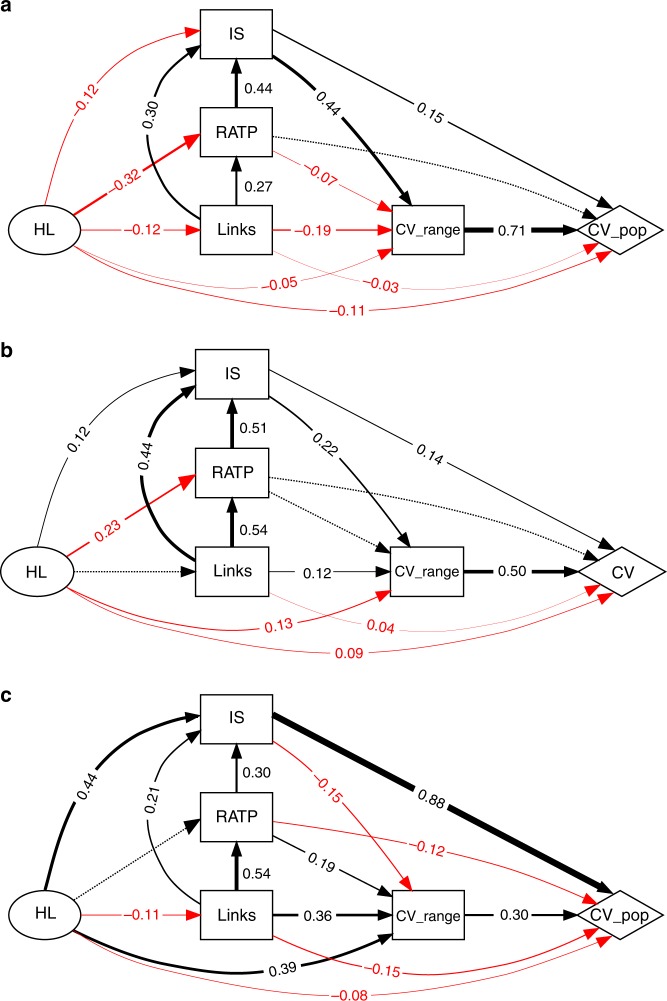
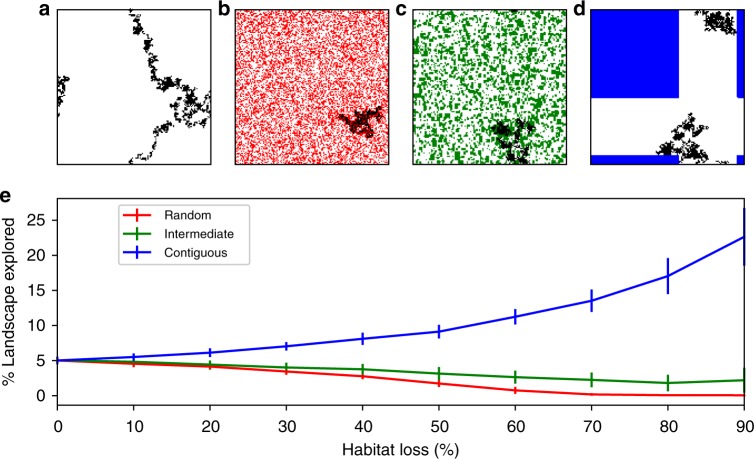
Habitat loss (HL) affects species and their interactions, ultimately altering community dynamics. Yet, a challenge for community ecology is to understand how communities with multiple interaction types-hybrid communities-respond to HL prior to species extinctions. To this end, we develop a model to investigate the response of hybrid terrestrial communities to two types of HL: random and contiguous. Our model reveals changes in stability-temporal variability in population abundances-that are dependent on the spatial configuration of HL. Our findings highlight that habitat area determines the variability of populations via changes in the distribution of species interaction strengths. The divergent responses of communities to random and contiguous HL result from different constraints imposed on individuals' mobility, impacting diversity and network structure in the random case, and destabilising communities by increasing interaction strength in the contiguous case. Analysis of intermediate HL suggests a gradual transition between the two extreme cases.
Conflict of interest statement
The authors declare no competing interests.
Figures
Similar articles
-
Locally dispersing populations in heterogeneous dynamic landscapes with spatiotemporal correlations. I. Block disturbance.J Theor Biol. 2016 Oct 21;407:212-224. doi: 10.1016/j.jtbi.2016.07.031. Epub 2016 Jul 25. J Theor Biol. 2016. PMID: 27460587
-
Contrasting spatial and temporal responses of bird communities to landscape changes.Oecologia. 2013 Jun;172(2):563-74. doi: 10.1007/s00442-012-2498-2. Epub 2012 Oct 19. Oecologia. 2013. PMID: 23080303
-
Predators mitigate the destabilising effects of heatwaves on multitrophic stream communities.Glob Chang Biol. 2022 Jan;28(2):403-416. doi: 10.1111/gcb.15956. Epub 2021 Nov 3. Glob Chang Biol. 2022. PMID: 34689388
-
Biotic homogenisation and differentiation as directional change in beta diversity: synthesising driver-response relationships to develop conceptual models across ecosystems.Biol Rev Camb Philos Soc. 2023 Aug;98(4):1388-1423. doi: 10.1111/brv.12958. Epub 2023 Apr 18. Biol Rev Camb Philos Soc. 2023. PMID: 37072381
-
Consequences of dominance: a review of evenness effects on local and regional ecosystem processes.Ecology. 2008 Jun;89(6):1510-20. doi: 10.1890/07-1053.1. Ecology. 2008. PMID: 18589516 Review.
Cited by
-
The spatial scaling of food web structure across European biogeographical regions.Ecography. 2021 May;44(5):653-664. doi: 10.1111/ecog.05229. Epub 2021 Feb 25. Ecography. 2021. PMID: 36620425 Free PMC article.
-
Spatial scaling of soil microbial co-occurrence networks in a fragmented landscape.mLife. 2023 Jun 26;2(2):209-215. doi: 10.1002/mlf2.12073. eCollection 2023 Jun. mLife. 2023. PMID: 38817624 Free PMC article.
-
Colonization-competition dynamics of basal species shape food web complexity in island metacommunities.Mar Life Sci Technol. 2023 May 9;5(2):169-177. doi: 10.1007/s42995-023-00167-0. eCollection 2023 May. Mar Life Sci Technol. 2023. PMID: 37275541 Free PMC article.
-
Eco-evolutionary consequences of habitat warming and fragmentation in communities.Biol Rev Camb Philos Soc. 2021 Oct;96(5):1933-1950. doi: 10.1111/brv.12732. Epub 2021 May 16. Biol Rev Camb Philos Soc. 2021. PMID: 33998139 Free PMC article.
-
A roadmap towards predicting species interaction networks (across space and time).Philos Trans R Soc Lond B Biol Sci. 2021 Nov 8;376(1837):20210063. doi: 10.1098/rstb.2021.0063. Epub 2021 Sep 20. Philos Trans R Soc Lond B Biol Sci. 2021. PMID: 34538135 Free PMC article. Review.
References
-
- Janzen DH. The deflowering of Central America. La deforestación de. Cent. Nat. Hist. 1974;83:48–53.
-
- Valiente-Banuet A, et al. Beyond species loss: the extinction of ecological interactions in a changing world. Func. Ecol. 2015;29:299–307. doi: 10.1111/1365-2435.12356. - DOI
-
- Hagen M, et al. Biodiversity, species interactions and ecological networks in a fragmented world. Adv. Ecol. Res. 2012;46:89–120. doi: 10.1016/B978-0-12-396992-7.00002-2. - DOI
Publication types
MeSH terms
Grants and funding
- AgreenSkills+ #609398)/EC | EC Seventh Framework Programm | FP7 People: Marie-Curie Actions (FP7-PEOPLE - Specific Programme "People" Implementing the Seventh Framework Programme of the European Community for Research, Technological Development and Demonstration Activities (2007 to 2013))/International
- ANR-10-LABX-45/Agence Nationale de la Recherche (French National Research Agency)/International
- ANR-10-LABX-41/Agence Nationale de la Recherche (French National Research Agency)/International
- ANR-11-IDEX-002-02/Agence Nationale de la Recherche (French National Research Agency)/International
- ERC Concolidator grant #726176/EC | Horizon 2020 Framework Programme (EU Framework Programme for Research and Innovation H2020)/International
LinkOut - more resources
Full Text Sources
