

Enhanced auditory disembedding in an interleaved melody recognition test is associated with absolute pitch ability
- PMID: 31127171
- PMCID: PMC6534562
- DOI: 10.1038/s41598-019-44297-x
Enhanced auditory disembedding in an interleaved melody recognition test is associated with absolute pitch ability
Abstract
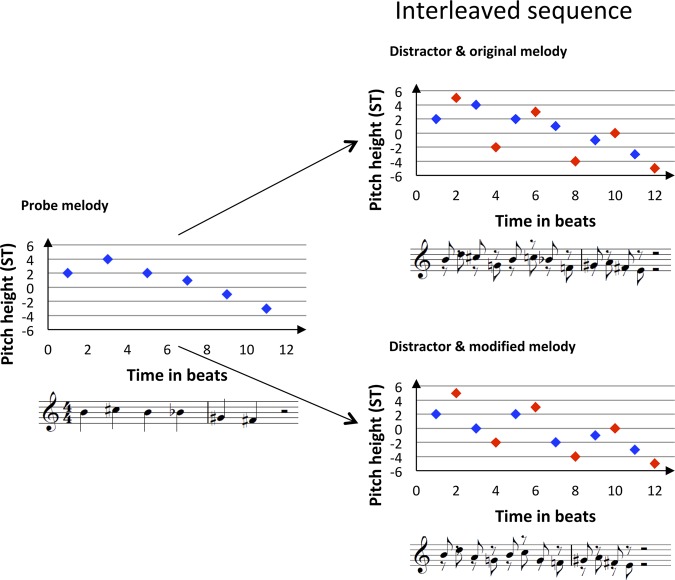
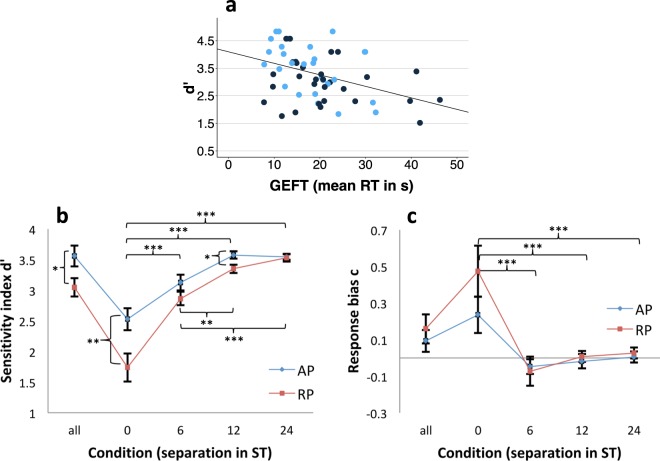
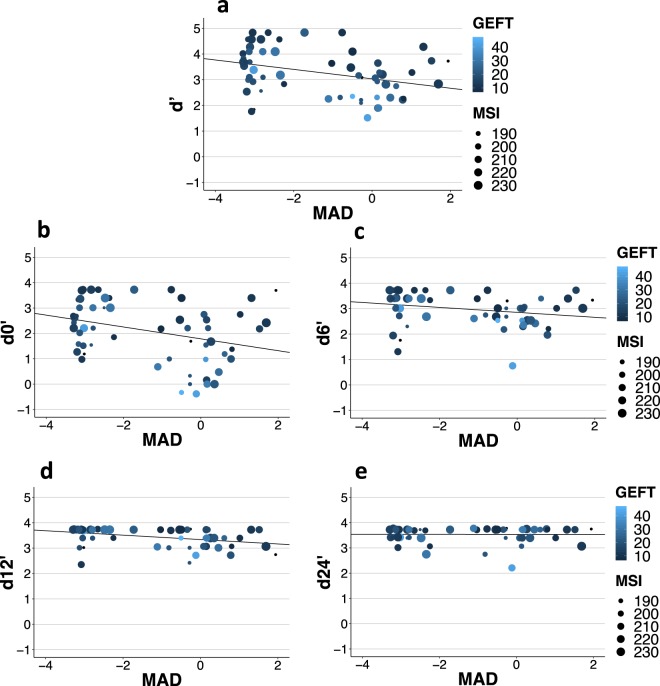
Absolute pitch (AP) and autism have recently been associated with each other. Neurocognitive theories of autism could perhaps explain this co-occurrence. This study investigates whether AP musicians show an advantage in an interleaved melody recognition task (IMRT), an auditory version of an embedded figures test often investigated in autism with respect to the these theories. A total of N = 59 professional musicians (AP = 27) participated in the study. In each trial a probe melody was followed by an interleaved sequence. Participants had to indicate as to whether the probe melody was present in the interleaved sequence. Sensitivity index d' and response bias c were calculated according to signal detection theory. Additionally, a pitch adjustment test measuring fine-graded differences in absolute pitch proficiency, the Autism-Spectrum-Quotient and a visual embedded figures test were conducted. AP outperformed relative pitch (RP) possessors on the overall IMRT and the fully interleaved condition. AP proficiency, visual disembedding and musicality predicted 39.2% of variance in the IMRT. No correlations were found between IMRT and autistic traits. Results are in line with a detailed-oriented cognitive style and enhanced perceptional functioning of AP musicians similar to that observed in autism.
Conflict of interest statement
The authors declare no competing interests.
Figures

Similar articles
-
Autistic traits, resting-state connectivity, and absolute pitch in professional musicians: shared and distinct neural features.Mol Autism. 2019 May 2;10:20. doi: 10.1186/s13229-019-0272-6. eCollection 2019. Mol Autism. 2019. PMID: 31073395 Free PMC article.
-
Audio-visual interactions uniquely contribute to resolution of visual conflict in people possessing absolute pitch.PLoS One. 2017 Apr 5;12(4):e0175103. doi: 10.1371/journal.pone.0175103. eCollection 2017. PLoS One. 2017. PMID: 28380058 Free PMC article.
-
Do musicians with perfect pitch have more autism traits than musicians without perfect pitch? An empirical study.PLoS One. 2012;7(5):e37961. doi: 10.1371/journal.pone.0037961. Epub 2012 May 30. PLoS One. 2012. PMID: 22666425 Free PMC article.
-
Pitch discrimination and melodic memory in children with autism spectrum disorders.Autism. 2014 Feb;18(2):137-47. doi: 10.1177/1362361312462905. Epub 2012 Nov 13. Autism. 2014. PMID: 23150888
-
Absolute pitch: music and beyond.Epilepsy Behav. 2005 Dec;7(4):578-601. doi: 10.1016/j.yebeh.2005.05.019. Epub 2005 Aug 15. Epilepsy Behav. 2005. PMID: 16103017 Review.
Cited by
-
Domain-specific hearing-in-noise performance is associated with absolute pitch proficiency.Sci Rep. 2022 Sep 29;12(1):16344. doi: 10.1038/s41598-022-20869-2. Sci Rep. 2022. PMID: 36175508 Free PMC article.
-
A Tendency Towards Details? Inconsistent Results on Auditory and Visual Local-To-Global Processing in Absolute Pitch Musicians.Front Psychol. 2019 Jan 22;10:31. doi: 10.3389/fpsyg.2019.00031. eCollection 2019. Front Psychol. 2019. PMID: 30723441 Free PMC article.
-
Conceptual coherence but methodological mayhem: A systematic review of absolute pitch phenotyping.Behav Res Methods. 2025 Jan 21;57(2):61. doi: 10.3758/s13428-024-02577-z. Behav Res Methods. 2025. PMID: 39838215 Free PMC article.
References
-
- Bregman, A. S. Auditory scene analysis: The perceptual organization of sound. (MIT press, 1994).
-
- Dowling WJ. The perception of interleaved melodies. Cognit. Psychol. 1973;5:322–337. doi: 10.1016/0010-0285(73)90040-6. - DOI
Publication types
MeSH terms
LinkOut - more resources
Full Text Sources
