. 2019 May 24;9(1):7826.
doi: 10.1038/s41598-019-44346-5.

Stress-induced tunneling nanotubes support treatment adaptation in prostate cancer

Affiliations

Stress-induced tunneling nanotubes support treatment adaptation in prostate cancer

Alexander Kretschmer et al. Sci Rep. .

Abstract

Tunneling nanotubes (TNTs) are actin-based membranous structures bridging distant cells for intercellular communication. We define roles for TNTs in stress adaptation and treatment resistance in prostate cancer (PCa). Androgen receptor (AR) blockade and metabolic stress induce TNTs, but not in normal prostatic epithelial or osteoblast cells. Co-culture assays reveal enhanced TNT formation between stressed and unstressed PCa cells as well as from stressed PCa to osteoblasts. Stress-induced chaperones clusterin and YB-1 localize within TNTs, are transported bi-directionally via TNTs and facilitate TNT formation in PI3K/AKT and Eps8-dependent manner. AR variants, induced by AR antagonism to mediate resistance to AR pathway inhibition, also enhance TNT production and rescue loss of clusterin- or YB-1-repressed TNT formation. TNT disruption sensitizes PCa to treatment-induced cell death. These data define a mechanistic network involving stress induction of chaperone and AR variants, PI3K/AKT signaling, actin remodeling and TNT-mediated intercellular communication that confer stress adaptative cell survival.


Conflict of interest statement

By the way of disclosure of conflict of interest, the University of British Columbia has submitted patent applications on OGX-011, listing Dr. Gleave as inventor.

Figures
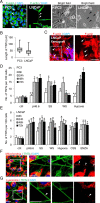
Figure 1
Figure 1
AR blockade and metabolic stresses induce TNTs in PCa cells. (A) Exponentially growing PC3 and LNCaP cells were fixed and stained with Alexa Fluor 488-labeled phalloidin (for F-actin) to visualize TNTs under fluorescent confocal microscope or under the bright field (40x lens). Arrows indicate TNTs. (B) Lengths of TNTs in PC3 and LNCaP cells were measured and presented as average +/− standard deviation (SD). (C) LNCaP xenografts were stained with Alexa Fluor 594-labbeled phalloidin. Right panel is cropped from the white box of the left panel. (D) PC3 and (E) LNCaP cells receiving stress treatments were stained for TNTs as in (A). TNTs were quantified as described in Methods. *p < 0.001 vs. ctrl of the respective group, **p = 0.01 vs. ctrl. Data is presented as average +/− SD from 3 independent experiments. (F) LNCaP cells labeled with MitoTracker Deep Red FM (for mitochondria) were treated with 10 μM ENZA for 24 hours and then stained with phalloidin. Co-localization of mitochondria and TNTs was captured by confocal microscopy. Right panel is cropped from the white box of the left panel. (G) LNCaP cells treated with 10 μM ENZA for 24 hours were stained for phalloidin and lysosome protein LAMP1. Co-localization of lysosome and TNTs was captured by confocal microscopy. Right panel is cropped from the white frame from the left panel. All scale bars: 20 μm.
Figure 2
Figure 2
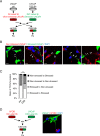
TNTs form between stressed and non-stressed cells. (A) Schema illustrating co-culture assays for stressed and non-stressed LNCaP cells. (B) Images of TNT formation between co-cultured populations: stressed to stressed cells (green to green), non-stressed to non-stressed cells (red to red), non-stressed to stressed cells (red to green) and stressed to non-stressed cells (green to red). (C) TNT formation between co-cultured populations was quantified; percentage of each category is shown. *p < 0.05. (D) DiO-labeled LNCaP cells (green) and Dil-labelled hFOB cells (red) were co-cultured in CSS-containing medium for 24 hours. Image shows a TNT from a LNCaP cell (green) towards an osteoblast cell (red). Scale bar: 20 µm.
Figure 3
Figure 3
Disruption of TNT formation sensitizes PCa cells to AR blockade and metabolic stress. (A) LNCaP cells were treated with androgen deprivation (CSS) combined with TNT disruption by gentle shaking (250 rpm) or actin inhibitor Cytochalasin D and TNT formation was quantified. ***p < 0.001. (B,C) Cell survival of LNCaP cells after combined treatment with CSS and TNT-disruption was assessed by crystal violate (c.v.) staining (B, **p = 0.001, ***p < 0.001) or automated cell counter (C, *p = 0.024, ** p = 0.005). (D,E,F) PC3 cells were treated with SS in combination with TNT-disruption, and TNT formation and cell survival estimated as described for LNCaP cells. *p = 0.002 for shaking, and **p = 0.007 for Cytochalasin D. ***p < 0.001 compared to ctrl. All data is presented as average +/− SD from 3 independent experiments.
Figure 4
Figure 4
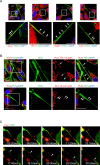
Stress-associated proteins co-localize with and are transported via TNTs. (A) PC3 cells treated with SS for 24 hours were co-stained for TNTs (F-actin) and CLU, YB-1, Hsp27 or LC3. Images were taken using confocal fluorescent microscopy (60x). The bottom panel is cropped from the white box of the top panel. (B) PLA staining for F-actin and the respective stress-associated proteins (red) was combined with TNT staining (Phalloidin, green) in SS-treated PC3 cells. The right panel is cropped from the white box of the left images. (C) LNCaP cells were co-transfected with plasmids expressing mCherry-CLU and eGFP and treated in CSS for 24 hours. Live imaging assay was performed to capture CLU transport along TNTs. Still images created from live cell imaging are shown. In the top panel, red arrows indicate movement of a CLU-positive particle (red) along the TNT (green) from the bottom cell to the top cell. In the bottom panel, white arrows highlight movement of a CLU-positive particle transported in the opposite direction from the top cell to the bottom one. All scale bars: 20 µm.
Figure 5
Figure 5
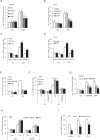
Stress-associated proteins facilitate TNT formation. LNCaP (A) and PC3 (B) cells were transfected with siRNAs followed with CSS or SS treatment and number of TNTs were quantified. *p < 0.001 compared to siScr. (C) PC3 cells were first transfected with siYB-1 and then with CLU-expressing plasmid followed with SS treatment for 24 hours. *p < 0.001 compared to mock. (D) PC3 cells were first transfected with siCLU and then with YB-1-expressing plasmid followed with SS treatment for 24 hours. *p < 0.001 compared to mock. (E) PC3 cells transfected with siAKT or treated with LY294002 were challenged with SS for 24 hours and then processed for quantification of TNT formation. *p < 0.001 compared to ctrl. (F) PC3 cells transfected with vectors for CLU, YB-1 or mock were treated with SS +/− LY294002. *p < 0.001 compared to mock. (G) LNCaP cells transfected with siAKT or treated with LY294002 were exposed to CSS or ENZA for 24 hours and then processed for TNT quantification. *p < 0.001 compared to ctrl. (H) PC3 cells were transfected with CLU, YB-1 or mock vector; 24 hours later cells were transfected again with siScr or siEsp8, followed with another 24 hours of SS treatment. TNTs formation was quantified. *p < 0.05 compared to SS condiction in the siScr group. (I) PC3 cells transfected with CLU, YB-1 or mock vector were challenged with the Eps8 inhibitor mithramycin A in the presence os SS for 24 hours. TNTs formation was quantified. *p < 0.001 compared to ctrl. All data is presented as average +/− SD from 3 independent experiments.
Figure 6
Figure 6
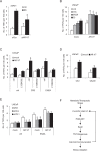
AR variant protein is involved in stress-induced TNTs formation. (A) 22Rv1 cells were transfected with siAR-V7 followed with treatment with SS. *p < 0.001 compared to siScr. (B) AR-V7 was overexpressed in LNCaP cells and TNT formation was quantified after CSS, ENZA or SS treatments. *p < 0.001 compared to mock. (C) LNCaP cells were transfected with AR-V7-expressing plasmid and then treated with CSS or ENZA +/− LY294002 for 24 hours. *p < 0.001 compared to mock. (D) LNCaP cells were transfected with plasmids for mock vector or AR-V7, and 24 hours later cells were transfected with siScr or siEps8. Cells were then treated with ENZA for 24 hours and TNTs formation was quantified. *p < 0.001 compared to siScr. (E) After CLU or YB-1 silencing in LNCaP cells, AR-V7 plasmid was transfected into the cells, followed with ENZA treatment. *p < 0.001 compared to mock. (F) A schema illustrating how ARPI stress induction of CLU/YB-1/AR-V7, via PI3K/AKT modulates Eps8-facilitated TNT production and intercellular communication for cancer cell survival under metabolic and therapeutic stress. All data is presented as average +/− SD from 3 independent experiments.

References

    1. Knudsen KE, Scher HI. Starving the addiction: new opportunities for durable suppression of AR signaling in prostate cancer. Clin Cancer Res. 2009;15:4792–4798. doi: 10.1158/1078-0432.CCR-08-2660. - DOI - PMC - PubMed
    1. Gleave M, et al. Progression to androgen independence is delayed by adjuvant treatment with antisense Bcl-2 oligodeoxynucleotides after castration in the LNCaP prostate tumor model. Clin Cancer Res. 1999;5:2891–2898. - PubMed
    1. Miyake H, Nelson C, Rennie PS, Gleave ME. Acquisition of chemoresistant phenotype by overexpression of the antiapoptotic gene testosterone-repressed prostate message-2 in prostate cancer xenograft models. Cancer Res. 2000;60:2547–2554. - PubMed
    1. Rocchi P, et al. Heat shock protein 27 increases after androgen ablation and plays a cytoprotective role in hormone-refractory prostate cancer. Cancer Res. 2004;64:6595–6602. doi: 10.1158/0008-5472.CAN-03-3998. - DOI - PubMed
    1. Wyatt AW, Gleave ME. Targeting the adaptive molecular landscape of castration-resistant prostate cancer. EMBO Mol Med. 2015;7:878–894. doi: 10.15252/emmm.201303701. - DOI - PMC - PubMed

Publication types

MeSH terms