Review
. 2019 Jun 1;160(6):1515-1535.
doi: 10.1210/en.2019-00001.

Follicle-Stimulating Hormone Glycobiology

Affiliations
Review

Follicle-Stimulating Hormone Glycobiology

George R Bousfield et al. Endocrinology. .

Abstract

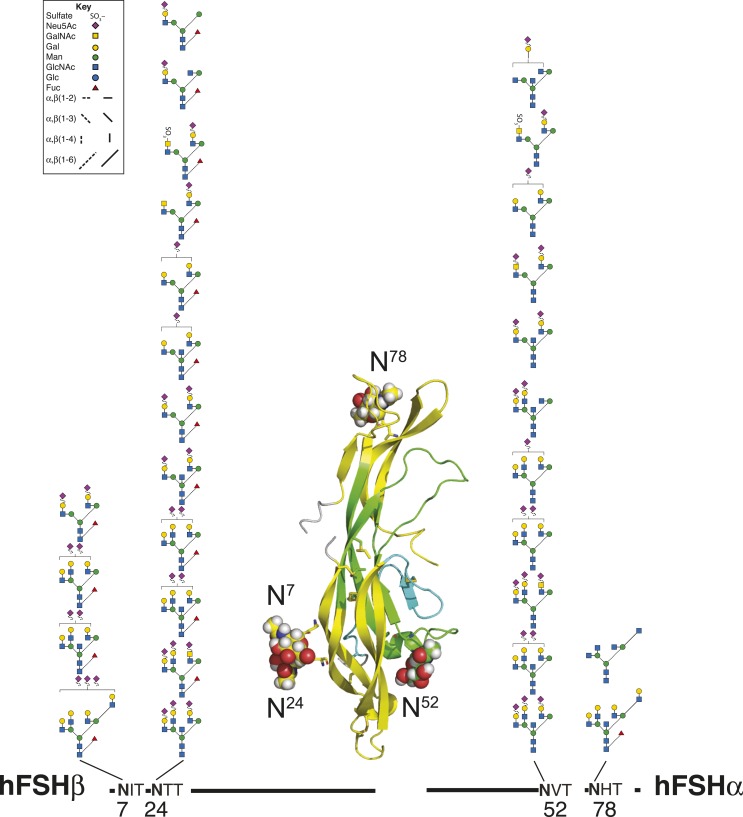
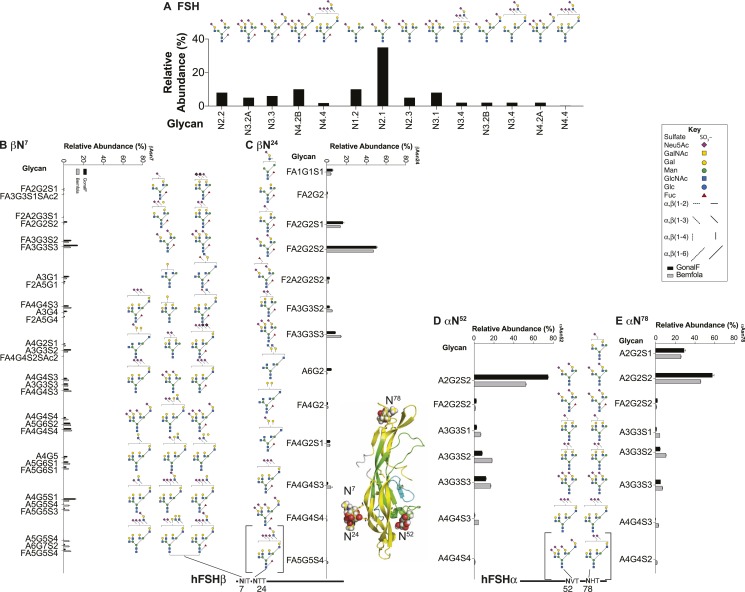
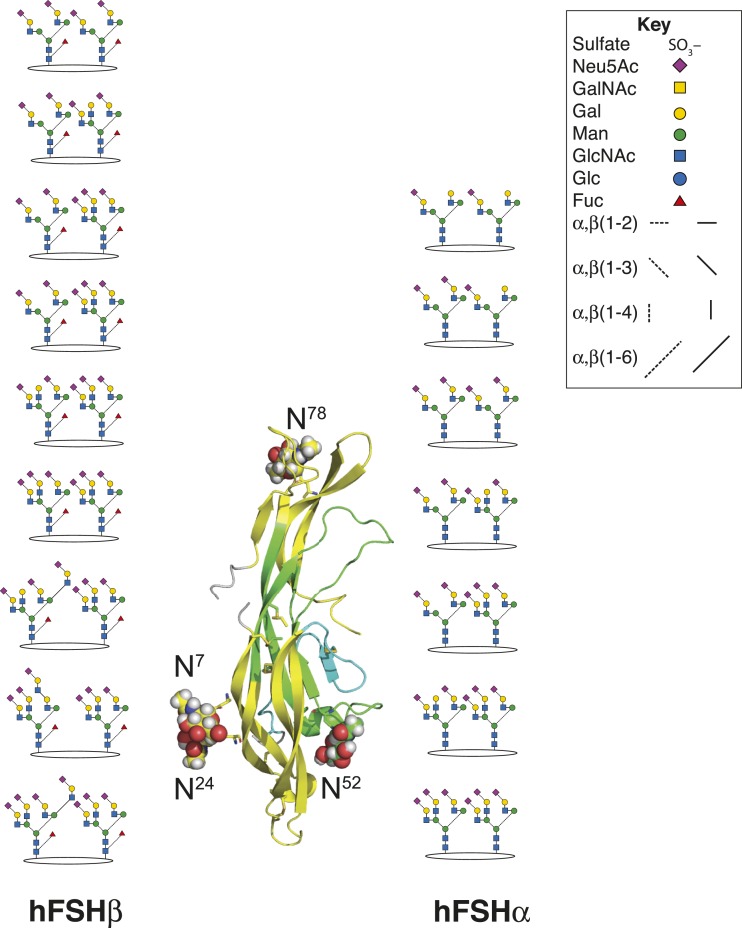
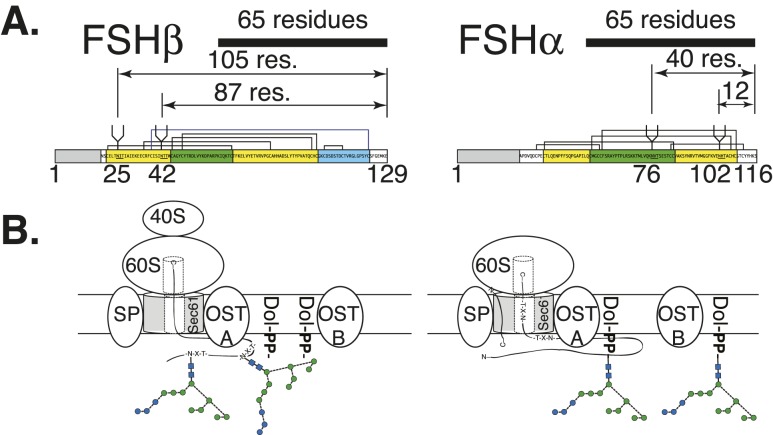
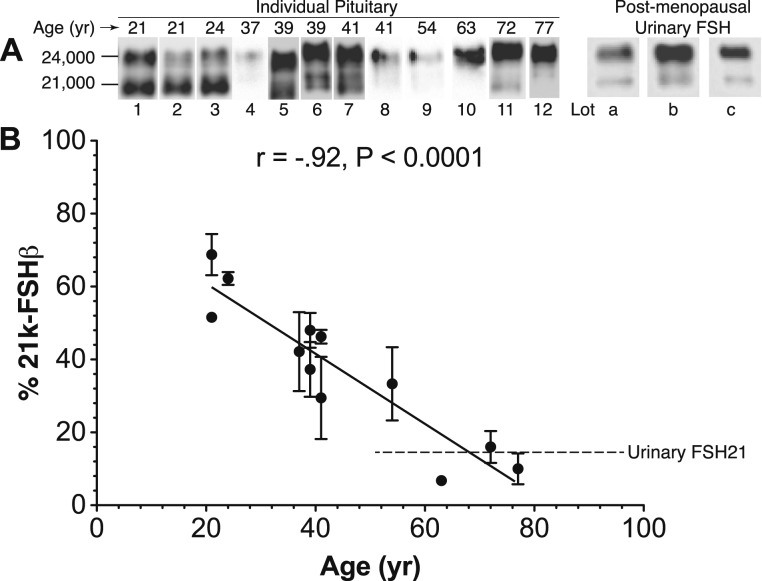
FSH glycosylation varies in two functionally important aspects: microheterogeneity, resulting from oligosaccharide structure variation, and macroheterogeneity, arising from partial FSHβ subunit glycosylation. Although advances in mass spectrometry permit extensive characterization of FSH glycan populations, microheterogeneity remains difficult to illustrate, and comparisons between different studies are challenging because no standard format exists for rendering oligosaccharide structures. FSH microheterogeneity is illustrated using a consistent glycan diagram format to illustrate the large array of structures associated with one hormone. This is extended to commercially available recombinant FSH preparations, which exhibit greatly reduced microheterogeneity at three of four glycosylation sites. Macroheterogeneity is demonstrated by electrophoretic mobility shifts due to the absence of FSHβ glycans that can be assessed by Western blotting of immunopurified FSH. Initially, macroheterogeneity was hoped to matter more than microheterogeneity. However, it now appears that both forms of carbohydrate heterogeneity have to be taken into consideration. FSH glycosylation can reduce its apparent affinity for its cognate receptor by delaying initial interaction with the receptor and limiting access to all of the available binding sites. This is followed by impaired cellular signaling responses that may be related to reduced receptor occupancy or biased signaling. To resolve these alternatives, well-characterized FSH glycoform preparations are necessary.


Figures

Figure 1.
Figure 1.
FSH subunit primary structures. (A) FSHα primary and tertiary structures. (B) FSHβ primary and tertiary structures. Amino acid sequences of FSHα and FSHβ subunits indicated by single-letter amino acid code. Cystine knot loops in primary and tertiary structures are indicated by yellow highlighting for loops L1 and L3 and green for loop L2. The seatbelt loop is colored cyan. Lines above the subunit sequences connecting Cys residues (C) indicate disulfide bonds. Cys residue numbers are shown below. Cys knot disulfides are indicated by thick lines. N-glycosylation site sequons of the type NXT (N, Asn; X, any residue except Pro; T, Thr) are underlined, and oligosaccharide structures are shown below each subunit. Key to oligosaccharide structures can be found in Fig. 3. FSH subunit three-dimensional structures were extracted from pdb file 4ay9 using PyMol. Known FSH glycans were added to the FSH polypeptide backbone using GLYCAM.
Figure 2.
Figure 2.
Functions of specific Asn-linked oligosaccharides in FSH. Polypeptide moiety of FSH extracted from pdb file 1ay9 and the heterodimer rendered as cartoon using PyMol. The subunits are colored as in Fig. 1 (yellow indicates cystine knot loops L1 and L3, cyan indicates the seatbelt loop, green indicates remaining FSHα and FSHβ). Oligosaccharides are rendered as sticks colored green for αAsn52 and αAsn78, cyan for βAsn7 and βAsn24.
Figure 3.
Figure 3.
Pituitary FSH glycans. (A) Enzymatically released human FSH oligosaccharides characterized by nano-electrospray mass spectrometry (53, 54). Only the nonfucosylated forms are shown. Of these, ∼90 have fucosylated counterparts (see Fig. 5C). (B) Chemically released, nonfucosylated human FSH oligosaccharide core structures (50). (C) Enzymatically released human FSH oligosaccharides characterized by nano-electrospray mass spectrometry (53, 54). A total of 91 structures were identified, most of which had nonfucosylated counterparts (Fig. 5A). (D) Chemically released, fucosylated human FSH oligosaccharides (50).
Figure 3.
Figure 3.
Pituitary FSH glycans. (A) Enzymatically released human FSH oligosaccharides characterized by nano-electrospray mass spectrometry (53, 54). Only the nonfucosylated forms are shown. Of these, ∼90 have fucosylated counterparts (see Fig. 5C). (B) Chemically released, nonfucosylated human FSH oligosaccharide core structures (50). (C) Enzymatically released human FSH oligosaccharides characterized by nano-electrospray mass spectrometry (53, 54). A total of 91 structures were identified, most of which had nonfucosylated counterparts (Fig. 5A). (D) Chemically released, fucosylated human FSH oligosaccharides (50).
Figure 4.
Figure 4.
Site-specific analysis of pituitary FSH N-glycosylation by glycopeptide mass spectrometry. Reduced carboxymethylated hFSH was exhaustively digested with 10% (w/w) proteinase K, and glycopeptides were isolated by gel filtration and analyzed by electrospray mass spectrometry. Composite results are from an analysis of purified hFSH and purified hFSH isoforms separated by chromatofocusing (32, 63).
Figure 5.
Figure 5.
Analysis of recombinant CHO-expressed hFSH glycosylation by NMR and glycopeptide mass spectrometry. (A) PNGaseF-released oligosaccharides from recombinant FSH provided by Organon. Structures were determined by NMR (58). Glycans with lactosamine repeats were detected, but complete structures were not defined. The bar graph shows relative glycan abundance determined by NMR. (B–E) Reduced, carboxamidomethylated recombinant hFSH samples were digested with 5% (w/w) chymotrypsin and glycopeptides analyzed by ethylene bridged hybrid amide chromatography–electrospray ionization mass spectrometry (57). Oligosaccharide structural diagrams are shown, and the adjacent graphs show relative abundance of each. The bars are means of either duplicate (Bemfola) or triplicate (GonalF) determinations (±SD). (B) GonalF and Bemfola βAsn7 glycosylation. (C) βAsn24 glycosylation. (D) αAsn52 glycosylation. (E) αAsn78 glycosylation. The bracketed oligosaccharides were found in Bemfola but not in GonalF. The remainder were found in both.
Figure 6.
Figure 6.
FSH subunit glycan pairs. LC-MS of reduced, carboxamidomethyl GonalF provided several pairs of FSH subunit glycan masses (56). In contrast to the original analysis of subunit glycosylation, ions consistent with two triantennary glycans were observed for both subunits.
Figure 7.
Figure 7.
Cotranslational and posttranslational glycosylation of FSH subunits. (A) Distance of subunit C terminus from N-glycosylation sites. The 65-residue bar indicates the distance from the ribosomal P site to the Asn residue of the FSH subunit sequon (90). Prepeptide numbering is used for each subunit diagram. (B) Potential cotranslational glycosylation of FSHβ and posttranslational glycosylation of FSHα. OSTA indicates isoform possessing STT3A associated with Sec61 translocon. OSTB indicates isoform possessing STT3B not associated with Sec61 translocon that can perform posttranslational N-glycosylation. For the oligosaccharide diagrams, the blue circles represent Glc residues, green circles represent mannose, and blue squares represent GlcNAc. Connecting lines show linkages as in Fig. 6 key.
Figure 8.
Figure 8.
Age-related decline in pituitary FSH21 abundance. (A) Representative Western blots of pituitary hFSH isolated from individual human pituitary glands by immunoaffinity followed by gel filtration chromatography. The immunoaffinity column employed anti-FSHβ monoclonal antibody 46.3H6.B7 (99), and the Western blot primary antibody was anti-FSHβ monoclonal RFSH20 (74). The age at autopsy is indicated. Each FSH sample was evaluated in three to four independent Western blots. Postmenopausal hFSH derived from three lots of Pergonal is shown. (B) Linear regression of FSH21 abundance based on relative density of 21k-FSHβ bands. The dotted line indicates the average relative abundance of FSH21 in the Pergonal lots. [Reproduced from Bousfield GR, Butnev VY, Rueda-Santos MA, Brown A, Smalter Hall A, Harvey DJ. Macro and micro heterogeneity in pituitary and urinary follicle-stimulating hormone glycosylation. J Glycomics Lipidomics. 2014;4:125. Copyright: © 2014 Bousfield GR, et al. This is an open-access article distributed under the terms of the Creative Commons Attribution License, which permits unrestricted use, distribution, and reproduction in any medium, provided the original author and source are credited.]

Similar articles

Cited by

References

    1. Hunzicker-Dunn M, Mayo KE. Gonadotropin signaling in the ovary. In: Plant TM, Zeleznik AJ, eds. Knobil and Neill’s Physiology of Reproduction. Vol 1. 4th ed. Amsterdam, Netherlands: Elsevier; 2015:895–946.
    1. Lee LB, Walker WH. Hormone signaling in the testis. In: Plant TM, Zeleznik AJ, eds. Knobil and Neill’s Physiology of Reproduction. Vol 1. 4th ed. Amsterdam, Netherlands: Elsevier; 2015:637–690.
    1. Kumar TR, Wang Y, Lu N, Matzuk MM. Follicle stimulating hormone is required for ovarian follicle maturation but not male fertility. Nat Genet. 1997;15(2):201–204. - PubMed
    1. Zheng J, Mao J, Cui M, Liu Z, Wang X, Xiong S, Nie M, Wu X. Novel FSHβ mutation in a male patient with isolated FSH deficiency and infertility. Eur J Med Genet. 2017;60(6):335–339. - PubMed
    1. Huhtaniemi I. A short evolutionary history of FSH-stimulated spermatogenesis. Hormones (Athens). 2015;14(4):468–478. - PubMed

Publication types

Substances