. 2019 Aug 22;47(14):7402-7417.
doi: 10.1093/nar/gkz459.

Microhomologies are prevalent at Cas9-induced larger deletions

Affiliations

Microhomologies are prevalent at Cas9-induced larger deletions

Dominic D G Owens et al. Nucleic Acids Res. .

Abstract

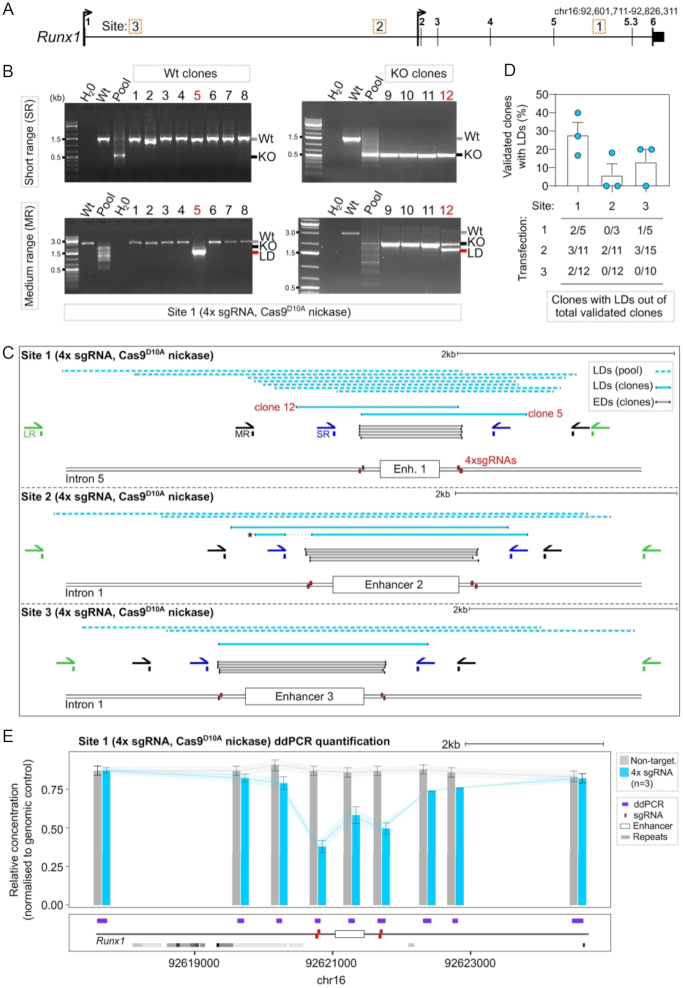
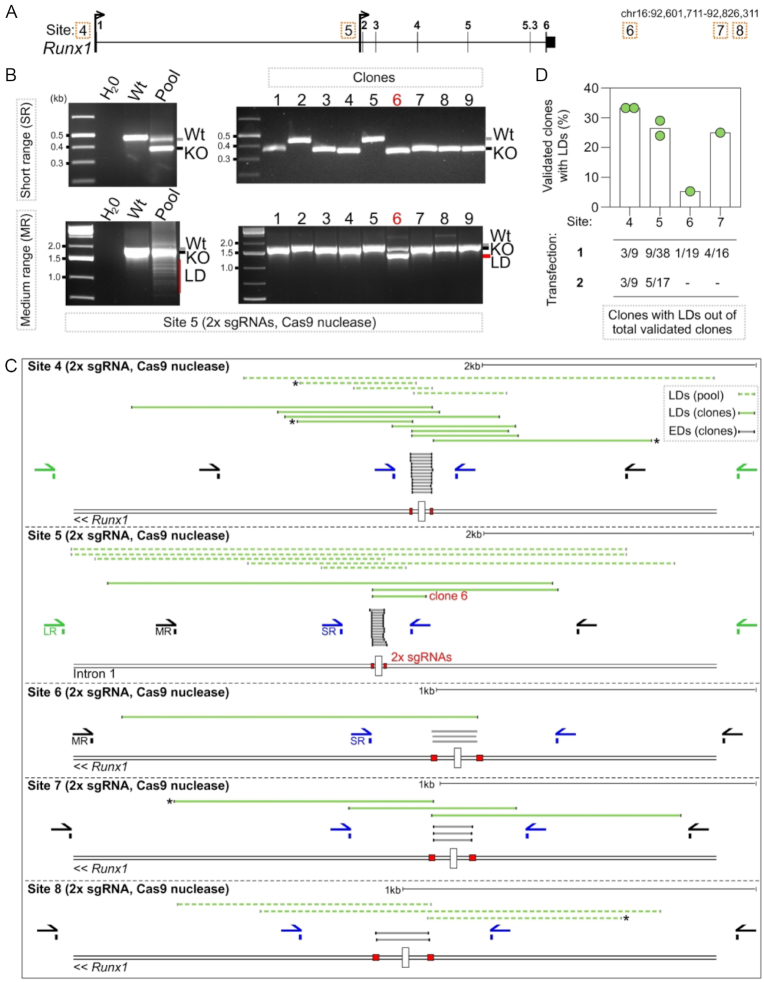
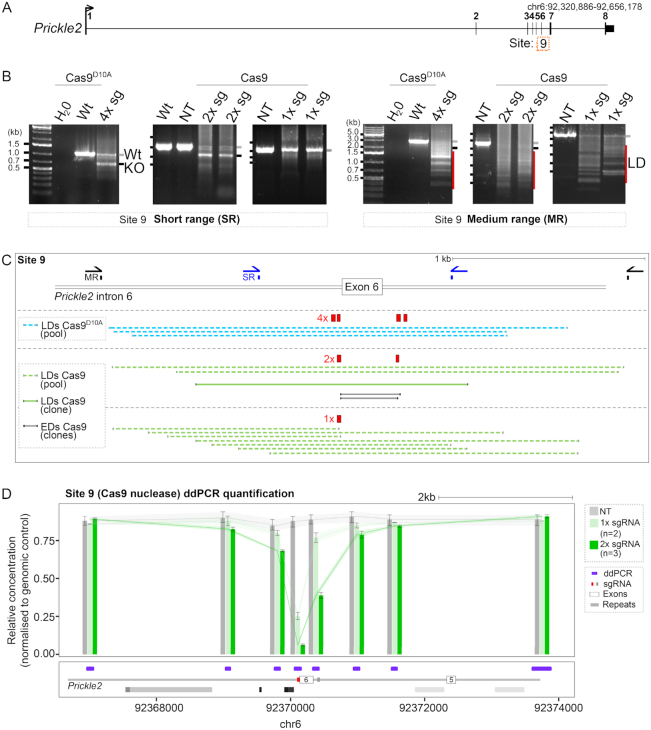
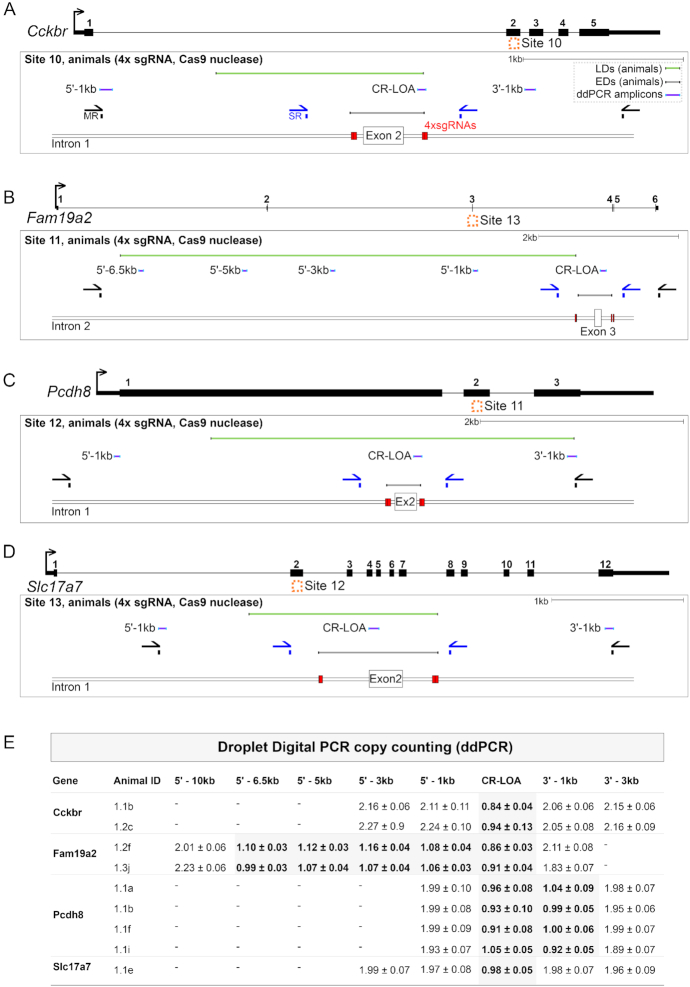
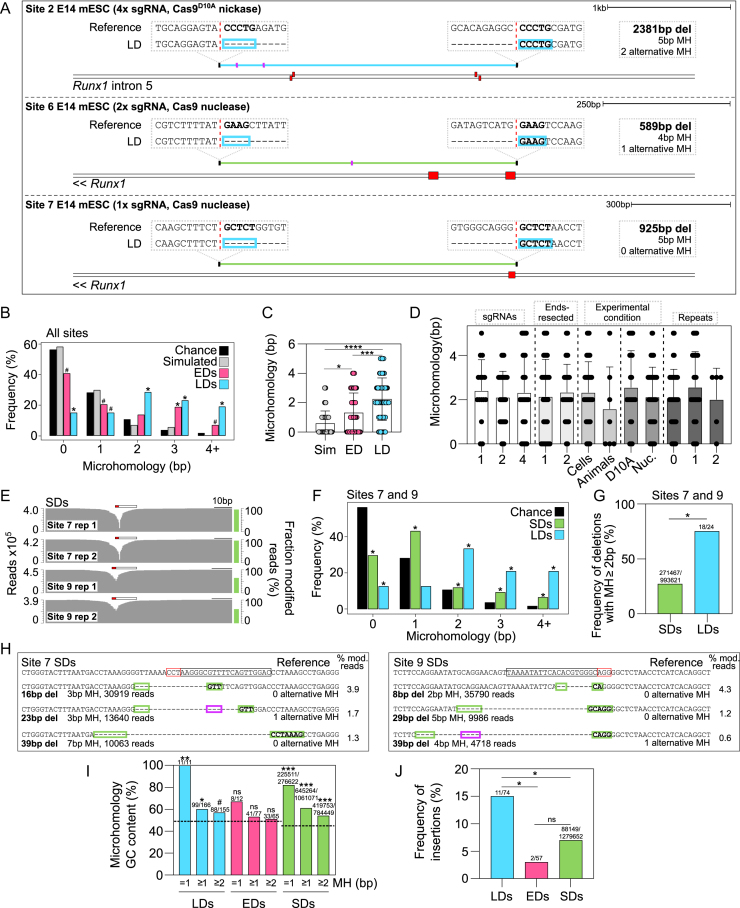
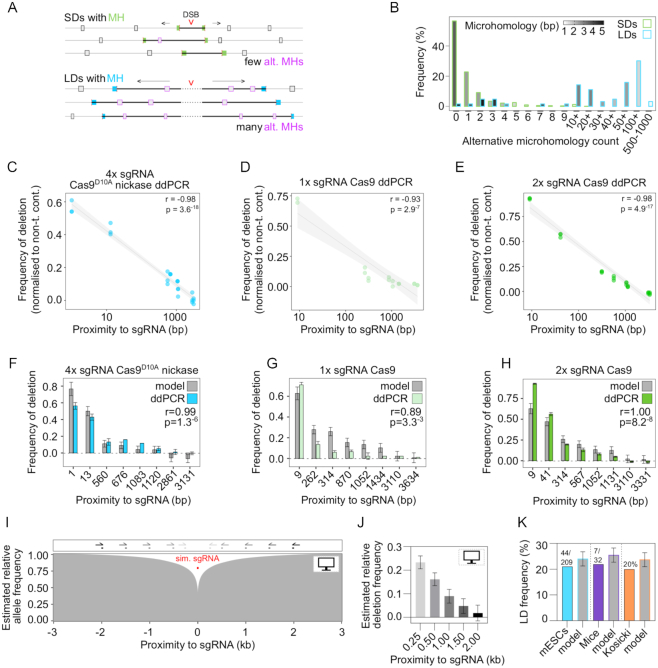
The CRISPR system is widely used in genome editing for biomedical research. Here, using either dual paired Cas9D10A nickases or paired Cas9 nuclease we characterize unintended larger deletions at on-target sites that frequently evade common genotyping practices. We found that unintended larger deletions are prevalent at multiple distinct loci on different chromosomes, in cultured cells and mouse embryos alike. We observed a high frequency of microhomologies at larger deletion breakpoint junctions, suggesting the involvement of microhomology-mediated end joining in their generation. In populations of edited cells, the distribution of larger deletion sizes is dependent on proximity to sgRNAs and cannot be predicted by microhomology sequences alone.


Figures

Figure 1.
Figure 1.
Characterisation of larger deletions at three sites targeted by CRISPR/Cas9D10A nickase. (A) Locus map of the Runx1 gene showing the positions of evolutionarily conserved cis-regulatory elements (Site 1–3, corresponding to Enhancer 1–3) that were targeted in E14-TG2a-RV mESCs using CRISPR/Cas9D10A nickase. (B) Example gel images from one experiment targeting Site 1. Gel images show PCR amplification from gDNA of isolated wild type (wt) clones (left hand gels) and knock-out (KO) clones (right hand gels) with SR primers (top gels) and MR primers (bottom gels). Wt next to the gel image indicates the size of the wild type allele, KO indicates the size of alleles harbouring the expected deletion, and LD indicates the size of alleles in clones identified as harbouring LDs. (C) Schematic showing the positions of S-R PCR primers (SR, blue), M-R PCR primers (MR, black), L-R PCR primers (LR, green), sgRNAs (red boxes), and LDs isolated from clones (dark blue lines) and pools of cells (light blue dashed lines) at each of the three sites. The allele marked with a star contained a secondary deletion at Site 2 distal to the primary cut site that destroyed a primer binding site. (D) Quantification of clone frequencies with homozygous wild type or knock-out genotypes by S-R PCR (validated clones) that were later found to contain a LD on another allele by M-R PCR. Quantification of clone numbers for each transfection that were homozygous knock-out or wild type and contained a LD on the other allele (n = 3 independent transfections per site, each dot is one independent experiment). (E) ddPCR quantification of deletions across a 7 kb window centred on Enhancer 1. Each bar represents the mean relative concentration of the target DNA sequence (±95% confidence interval). mESCs were targeted with 4× sgRNA (blue bars, n = 3) and a non-targeting control (grey bar).
Figure 2.
Figure 2.
Frequency of larger deletions when genome editing with Cas9 nuclease. (A) Locus maps of CRISPR/Cas9 nuclease strategies to delete Sites 4–8, corresponding to transcription factor binding sites at the Runx1 locus. (B) Gel images showing PCR amplification of gDNA isolated from a pool of selected cells (left-hand gels) or isolated clones (right-hand gels) targeted with Cas9 nuclease at Site 5. PCR screening was performed with SR primers (top gels) and MR primers (bottom gels). Wt next to the gel image indicates the size of the wild type allele, KO indicates the size of alleles harbouring the expected deletion, and LD indicates the size of alleles identified harbouring larger deletions. (C) Schematic showing the positions of S-R PCR primers (SR blue), M-R PCR primers (MR, black), L-R PCR primers (LR, green), sgRNAs (red boxes), and LDs isolated from clones (dark green lines) and pools of cells (light green dashed lines). (D) Quantification of clone frequencies with homozygous wild type or knock-out genotypes by S-R PCR (validated clones) that contained a LD on one allele only detected by medium-range or longer-range PCR (n = 1–2 independent transfections per site, each dot is one independent experiment).
Figure 3.
Figure 3.
Larger deletions are generated in a variety of genome-editing contexts. (A) Locus schematic showing Site 9 (Prickle2 exon 6) on mouse chromosome 6. (B) Gel images showing PCR amplification products from gDNA harvested from a pool of transfected cells targeted using the CRISPR/Cas9 strategies indicated. Left gel images correspond to SR primers and right gel images correspond to MR primers. Wt and a grey line next to the gel image indicates the size of the wild type allele, KO and a black line indicates the size of alleles harbouring the expected deletion (based on the location of 2× or 4× sgRNAs), and LD and a red line indicates the size of alleles identified harbouring LDs. (C) Schematic showing the 4× sgRNA CRISPR/Cas9D10A nickase, 1× and 2× sgRNA Cas9 nuclease strategies targeting Prickle2 exon 6. Sequenced PCR products amplified from pools of cells (light blue and light green dashed lines) and one isolated clone (dark green line). Mapped deletions of expected size (EDs) based on the location of the 2× sgRNA cut sites are shown (grey lines). (D) ddPCR quantification of deletions targeting exon 6 with Cas9 nuclease and 1x sgRNA (red box) or 2× sgRNAs (red and grey boxes). Each bar represents the mean ±95% confidence interval. mESCs were targeted with 1× sgRNA (light green bars, n = 2), 2× sgRNA (dark green bars, n = 3) and non-targeting control (grey bar).
Figure 4.
Figure 4.
Larger deletions when genome editing in mouse embryos. (AD) Locus maps of CRISPR/Cas9 strategies to delete Sites 10–13, corresponding to the genes Cckbr, Fam19a2, Pcdh8 and Slc17a7 respectively. Schematics show the positions of S-R PCR primers (SR, blue), M-R PCR primers (MR, black), sgRNAs (red boxes), ddPCR amplicons (purple lines) and LDs (green lines). (E) Copy counting results from ddPCR experiments. Assays against the wild type genomic sequence were designed in the critical region (CR-LOA) and at 1–3 kb intervals in the 5′ or 3′ direction distal to sgRNA cut sites (e.g. a 5′-1 kb amplicon is located 1 kb in the 5′ direction of the sgRNA cut sites). Each row corresponds to an animal where no deletion was detected by S-R PCR.
Figure 5.
Figure 5.
Microhomologies consistent with MMEJ are prevalent at Cas9-induced larger deletions. (A) Examples of LDs (blue and green lines) with microhomologies and corresponding reference sequences shown (mm9). Sequences outlined with blue boxes represent microhomologies. Red dashed vertical lines represent the exact breakpoint junctions in the repaired alleles and sgRNAs are shown (red boxes). Total deletion size, microhomology amount, and number of alternative (more proximal) microhomologies are shown (pink lines in deleted sequence). (B) Frequency distribution histogram of microhomologies at 74 LD breakpoint junctions (LDs) across 16 sites, 59 EDs across 16 sites (EDs), 74 simulated deletions (Simulated), and the chance expectation of finding at two locations a k-mer of a given length (Chance) (χ2 test, *, P< 6−7, #, P< 0.02). (C) Microhomology at 74 LDs compared to 59 EDs, and 74 simulated deletions (Sim) (two-tailed Kruskal–Wallis test, ****, P<0.0001, ***, P = 0.0007, *, P = 0.0105). (D) Comparison of microhomology at LDs generated with one, two or four sgRNAs, with ends resected in one or two directions, generated under different experimental conditions, or intersecting with 0, 1 or 2 repeat elements (two-tailed Kruskal–Wallis test, P> 0.9999). (E) Short-amplicon sequencing from pools of mESCs targeted using one sgRNA. Fraction of modified reads and read counts are shown. Protospacer (black outlined bar) and PAM (red outlined bar) are indicated. (F) Microhomology quantification in 24 LDs and all SDs mapped at Sites 7 and 9 compared to the chance expectation of finding a k-mer of a given length (χ2 test, *, P< 0.0003). (G) Quantification of deletions containing microhomology ≥2 bp in all SDs and LDs generated at Sites 7 and 9 using one sgRNA (χ2 test, *, P = 5.4−7). (H) Reference sequence and Cas9-induced deletion alleles containing significant microhomologies at their breakpoints. The total number of reads and the percentage of modified reads is shown. Protospacer (black outlined bar) and PAM (red outlined bar) are indicated. Short microhomologies that abut the deletion (green boxes) and alternative microhomologies located within the deleted region (pink boxes) are shown. (I) Quantification of microhomology GC base pair content in microhomologies of different lengths at all LDs, EDs, and SDs at Site 7 and 9. The expected background GC base pair content is shown as a black dashed line. (χ2 test, ns, P> 0.2, #, P = 0.059, *, P< 0.01, **, P< 0.001, ***, P< 10−10). (J) The number of total LDs, total EDs and SDs at Sites 7 and 9 containing a short insertion (χ2 test, *, P< 0.003, ns, P = 0.2395).
Figure 6.
Figure 6.
Larger deletion breakpoints do not occur at proximal microhomology sequences but are dependent on proximity to sgRNAs. (A) Schematic representation of LDs and SDs undergoing end-resection and bypassing alternative more proximal microhomologies during DNA repair. SD microhomologies are shown in green, LD microhomologies are shown in blue, and alternative microhomologies are indicated by pink boxes. The sequence included in the deletion is shown as a bold black line. (B) Quantification of alternative microhomologies that were found in the deleted sequences at Sites 7 and 9 SDs and across all LDs with microhomologies at their breakpoints. The colour gradient represents the mean microhomology score of all deletions within each bin. (CE) Correlation between frequency of deletion determined by ddPCR and sgRNA proximity. Pearson correlation r and P values are indicated and a linear regression with 95% confidence interval is shown. (FH) Deletion frequencies of real ddPCR data and model estimates with Pearson correlation r and P values indicated. (I) Model estimate of deletion frequency over a 6 kb window around a simulated sgRNA cut site with simulated PCR primers indicated as grey to black half arrows above the plot. (J) Relative predicted deletion frequencies at each of the simulated primer sites with 95% confidence intervals indicated. (K) Comparison between estimated and empirically determined deletion frequencies in two of our own independent data sets and one recent experiment reported in the literature (17).

References

    1. Sander J.D., Joung J.K.. CRISPR-Cas systems for editing, regulating and targeting genomes. Nat. Biotechnol. 2014; 32:347–355. - PMC - PubMed
    1. Slaymaker I.M., Gao L., Zetsche B., Scott D.A., Yan W.X., Zhang F.. Rationally engineered Cas9 nucleases with improved specificity. Science. 2016; 351:84–88. - PMC - PubMed
    1. Ran F.A., Hsu P.D., Lin C.Y., Gootenberg J.S., Konermann S., Trevino A.E., Scott D.A., Inoue A., Matoba S., Zhang Y. et al. .. Double nicking by RNA-guided CRISPR Cas9 for enhanced genome editing specificity. Cell. 2013; 154:1380–1389. - PMC - PubMed
    1. Caldecott K.W. DNA single-strand break repair. Exp. Cell Res. 2014; 329:2–8. - PubMed
    1. Dai W.J., Zhu L.Y., Yan Z.Y., Xu Y., Wang Q.L., Lu X.J.. CRISPR-Cas9 for in vivo gene therapy: promise and hurdles. Mol. Ther. Nucleic Acids. 2016; 5:e349. - PMC - PubMed

Publication types