

CarD and RbpA modify the kinetics of initial transcription and slow promoter escape of the Mycobacterium tuberculosis RNA polymerase
- PMID: 31127308
- PMCID: PMC6648326
- DOI: 10.1093/nar/gkz449
CarD and RbpA modify the kinetics of initial transcription and slow promoter escape of the Mycobacterium tuberculosis RNA polymerase
Abstract
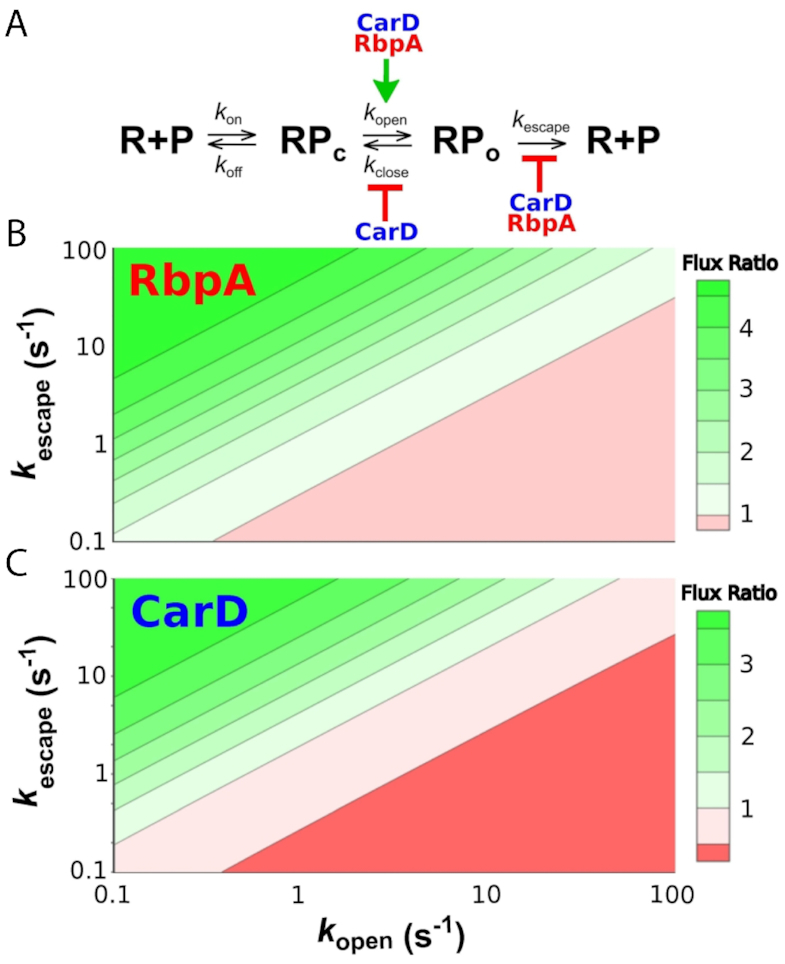
The pathogen Mycobacterium tuberculosis (Mtb), the causative agent of tuberculosis, enacts unique transcriptional regulatory mechanisms when subjected to host-derived stresses. Initiation of transcription by the Mycobacterial RNA polymerase (RNAP) has previously been shown to exhibit different open complex kinetics and stabilities relative to Escherichia coli (Eco) RNAP. However, transcription initiation rates also depend on the kinetics following open complex formation such as initial nucleotide incorporation and subsequent promoter escape. Here, using a real-time fluorescence assay, we present the first in-depth kinetic analysis of initial transcription and promoter escape for the Mtb RNAP. We show that in relation to Eco RNAP, Mtb displays slower initial nucleotide incorporation but faster overall promoter escape kinetics on the Mtb rrnAP3 promoter. Furthermore, in the context of the essential transcription factors CarD and RbpA, Mtb promoter escape is slowed via differential effects on initially transcribing complexes. Finally, based on their ability to increase the rate of open complex formation and decrease the rate of promoter escape, we suggest that CarD and RbpA are capable of activation or repression depending on the rate-limiting step of a given promoter's basal initiation kinetics.
© The Author(s) 2019. Published by Oxford University Press on behalf of Nucleic Acids Research.
Figures


Similar articles
-
Cooperative stabilization of Mycobacterium tuberculosis rrnAP3 promoter open complexes by RbpA and CarD.Nucleic Acids Res. 2016 Sep 6;44(15):7304-13. doi: 10.1093/nar/gkw577. Epub 2016 Jun 24. Nucleic Acids Res. 2016. PMID: 27342278 Free PMC article.
-
CarD stabilizes mycobacterial open complexes via a two-tiered kinetic mechanism.Nucleic Acids Res. 2015 Mar 31;43(6):3272-85. doi: 10.1093/nar/gkv078. Epub 2015 Feb 19. Nucleic Acids Res. 2015. PMID: 25697505 Free PMC article.
-
RbpA relaxes promoter selectivity of M. tuberculosis RNA polymerase.Nucleic Acids Res. 2018 Nov 2;46(19):10106-10118. doi: 10.1093/nar/gky714. Nucleic Acids Res. 2018. PMID: 30102406 Free PMC article.
-
Promoter clearance and escape in prokaryotes.Biochim Biophys Acta. 2002 Sep 13;1577(2):191-207. doi: 10.1016/s0167-4781(02)00452-9. Biochim Biophys Acta. 2002. PMID: 12213652 Review.
-
The σ Subunit-Remodeling Factors: An Emerging Paradigms of Transcription Regulation.Front Microbiol. 2020 Jul 29;11:1798. doi: 10.3389/fmicb.2020.01798. eCollection 2020. Front Microbiol. 2020. PMID: 32849409 Free PMC article. Review.
Cited by
-
Diverse and unified mechanisms of transcription initiation in bacteria.Nat Rev Microbiol. 2021 Feb;19(2):95-109. doi: 10.1038/s41579-020-00450-2. Epub 2020 Oct 29. Nat Rev Microbiol. 2021. PMID: 33122819 Free PMC article. Review.
-
High-throughput, fluorescent-aptamer-based measurements of steady-state transcription rates for the Mycobacterium tuberculosis RNA polymerase.Nucleic Acids Res. 2023 Oct 27;51(19):e99. doi: 10.1093/nar/gkad761. Nucleic Acids Res. 2023. PMID: 37739412 Free PMC article.
-
Recent Progress and Challenges for Drug-Resistant Tuberculosis Treatment.Pharmaceutics. 2021 Apr 21;13(5):592. doi: 10.3390/pharmaceutics13050592. Pharmaceutics. 2021. PMID: 33919204 Free PMC article. Review.
-
Mycobacterium tuberculosis DNA repair helicase UvrD1 is activated by redox-dependent dimerization via a 2B domain cysteine.Proc Natl Acad Sci U S A. 2022 Feb 22;119(8):e2114501119. doi: 10.1073/pnas.2114501119. Proc Natl Acad Sci U S A. 2022. PMID: 35173050 Free PMC article.
-
A systematic survey of TF function in E. coli suggests RNAP stabilization is a prevalent strategy for both repressors and activators.Nucleic Acids Res. 2025 Feb 8;53(4):gkaf058. doi: 10.1093/nar/gkaf058. Nucleic Acids Res. 2025. PMID: 39921566 Free PMC article.
References
-
- Browning D.F., Busby S.J.W.. Local and global regulation of transcription initiation in bacteria. Nat. Rev. Microbiol. 2016; 14:638–650. - PubMed
-
- Feklístov A., Sharon B.D., Darst S.A., Gross C.A.. Bacterial sigma factors: a historical, structural, and genomic perspective. Annu. Rev. Microbiol. 2014; 68:357–376. - PubMed
-
- Borukhov S., Nudler E.. RNA polymerase: the vehicle of transcription. Trends Microbiol. 2008; 16:126–134. - PubMed
Publication types
MeSH terms
Substances
Grants and funding
LinkOut - more resources
Full Text Sources
