. 2019 Dec;35(6):1126-1137.
doi: 10.1007/s12264-019-00393-6. Epub 2019 May 24.

Imaging and Spectral Characteristics of Amyloid Plaque Autofluorescence in Brain Slices from the APP/PS1 Mouse Model of Alzheimer's Disease

Affiliations

Imaging and Spectral Characteristics of Amyloid Plaque Autofluorescence in Brain Slices from the APP/PS1 Mouse Model of Alzheimer's Disease

Yunling Gao et al. Neurosci Bull. 2019 Dec.

Abstract

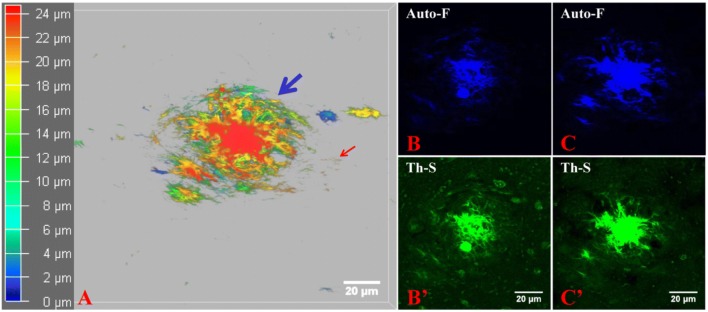
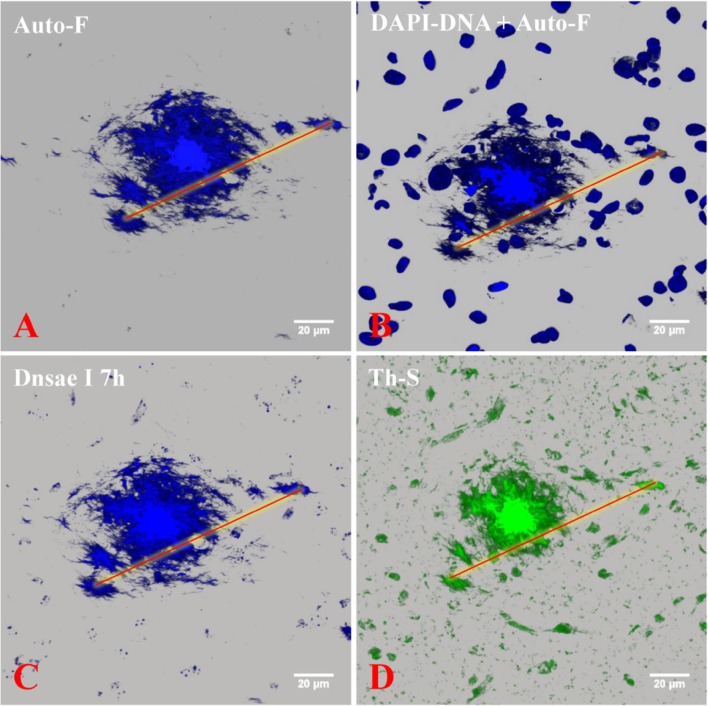
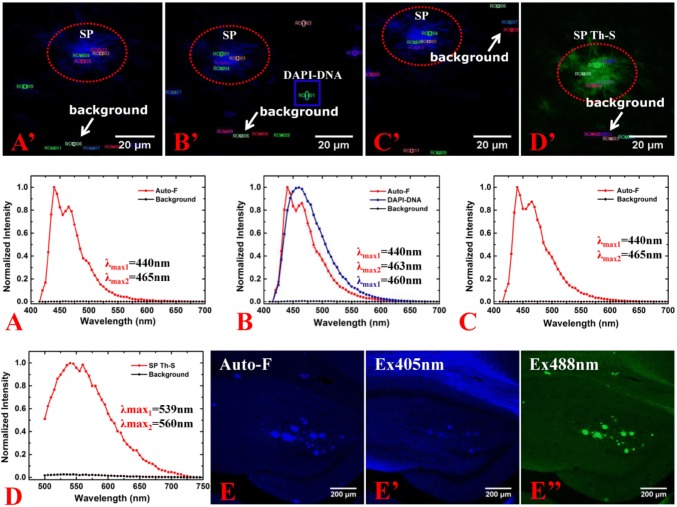
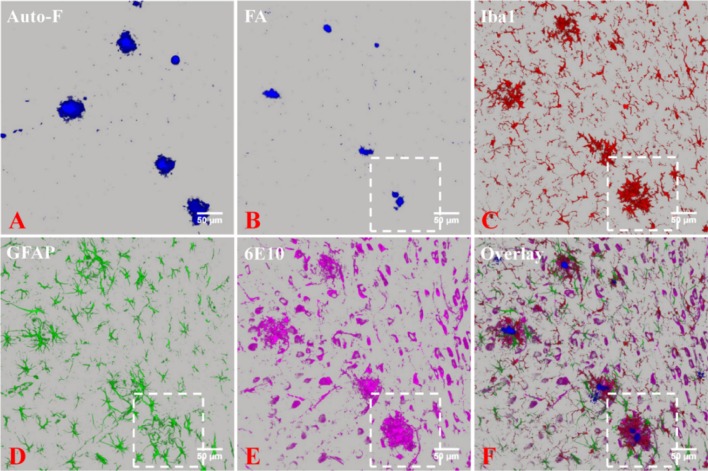
Amyloid deposits are one of the hallmark pathological lesions of Alzheimer's disease (AD). They can be visualized by thioflavin-S, silver impregnation, Congo red staining, and immunohistochemical reactions. However, that amyloid deposits generate blue autofluorescence (auto-F) has been ignored. Here, we report that visible light-induced auto-F of senile plaques (SPs) was detected and validated with conventional methods. Brain slices from APP/PS1 (amyloid precursor protein/presenilin 1) transgenic mice were mounted on slides, rinsed, coverslipped and observed for details of the imaging and spectral characteristics of the auto-F of SPs. Then the slices were treated with the above classic methods for comparative validation. We found that the SP auto-F was greatest under blue-violet excitation with a specific emission spectrum, and was much easier, more sensitive, and reliable than the classic methods. Because it does not damage slices, observation of auto-F can be combined with all post-staining techniques in slices and for brain-wide imaging in AD.

Keywords: Alzheimer’s disease; Amyloid deposits; Autofluorescence; Glial activation; Senile plaques; Spectral imaging.


Conflict of interest statement

The authors claim that there are no conflicts of interest.

Figures

Fig. 1
Fig. 1
Autofluorescence (auto-F) detected by visible light in brain slices from APP/PS1 transgenic mice under a conventional fluorescence microscope. A Intense blue auto-F was induced in the hippocampus using U-FUN (UN, BP 360–370, BA 420IF). B, C Only faint auto-F in the hippocampus was excited by U-FBW (BW, BP 460–495, BA 510IF) and U-FGW (GW, BP 530–550, BA 575IF). D Overlapped images showing a blue dense core surrounded by halo-shaped green and red signals. EH Amyloid plaque auto-F in piriform cortex under visible light at different wavelengths. Scale bars, 50 µm; insets, 10 µm.
Fig. 2
Fig. 2
Auto-F visualized under a laser scanning confocal microscope and their excitation spectra in the AD mouse brain sections. AF The intensity of auto-F was maximum at 405 nm excitation (A); the plaque core showed strong auto-F, whereas the corona was only faintly fluorescent. As the excitation wavelength increased from 488 nm to 552 nm and 638 nm (BD), the SP auto-F showed smaller dense cores and loose halos. They were very similar when overlaid (E), but were quite different from that at 405 nm excitation (F). G Typical excitation spectra of the auto-F in AD mouse brain sections excited from 700 nm to 1040 nm in 20-nm steps using a two-photon confocal microscope. The emission intensity at 400 nm–500 nm (red) and 500 nm–600 nm (black) bands were obtained. Scale bars, 20 µm.
Fig. 3
Fig. 3
Auto-F identified to be senile plaques by thioflavin-S staining. The 3D images of auto-F at 405 nm showed that it was irregularly spherical with a dense core and loose halo, which was then identified to be a senile plaque by Th-S staining from both superficial (B, B’) and core (C, C’) images of the auto-F. Auto-F, autofluorescence; Th-S, thioflavin-S staining; scale bars, 20 µm.
Fig. 4
Fig. 4
SP auto-F was not attributable to DNA. A, B The blue SP auto-F was weakened after DAPI staining compared with the unstained section. C, D After DNase I treatment, strong blue SP fluorescence still occurred (C), which was further confirmed by Th-S staining (D), but the fluorescence of the cell nuclei diminished significantly (C). Auto-F, autofluorescence; Th-S, thioflavin-S staining; scale bars, 20 µm.
Fig. 5
Fig. 5
SP fluorescence emission spectra under different conditions. The SP auto-F spectrum imaging (A, A’), after DAPI staining (B, B’), after DNase I treatment (C, C’), and after Th-S staining (D, D’). Th-S-stained SP fluorescence excited at 488 nm (E’’) was significantly brighter than that excited at 405 nm (E’) and the auto-F in unstained brain slices (E). Ex 405 nm, excited at 405 nm; Ex 488 nm, excited at 488 nm, scale bars, 20 µm (A’D’) and 200 µm (EE’’).
Fig. 6
Fig. 6
Relationships between amyloid deposits and reactive microglia and astrocytes. Brain sections were pretreated with formic acid, and then triple-labeled with 6E10, GFAP, and Iba1 for immunohistochemistry. The SP auto-F was diminished after formic acid treatment (A, B). The Iba1- (C), GFAP- (D), and 6E10-positive (E) signals all occurred in the vicinity of SP auto-F. When the images were overlaid, it was evident that the auto-F was in the center, then the 6E10 signal was closely wrapped round with a certain overlap, then surrounding reactive microglia, and outermost were the activated astrocytes (F). FA, formic acid; scale bars, 50 µm.
Fig. 7
Fig. 7
Comparison of modified Bielschowsky’s silver staining, Congo red staining, and Th-S staining with auto-F images of SP. SPs had a low signal-to-noise ratio with very high background after modified Bielschowsky’s silver staining (A, D). SPs were much smaller with a low signal-to-noise ratio after Congo red staining (B, E), and were similar to their auto-F images with a high signal-to-noise ratio after Th-S staining (C, F). Auto-F, autofluorescence; Th-S; thioflavin-S staining; scale bars, 100 µm.
Fig. 8
Fig. 8
SP auto-F in sections from AD mouse brain with cortical vessel walls, cortex, and pia mater at 405 nm excitation (A, B), and no SP auto-F was detected in control mice (C). The magnified horizontal (A’), coronal (A”), and surrounding (B’) images showed thick plate-like aggregations that were identified with Th-S (D, E). Auto-F, autofluorescence; Th-S, thioflavin-S; scale bars, 200 µm (AC), 20 µm (A’, A’’, B’, D, E).

References

    1. Ferrari C, Lombardi G, Polito C, Lucidi G, Bagnoli S, Piaceri I, et al. Alzheimer’s disease progression: factors influencing cognitive decline. J Alzheimers Dis. 2018;61:785–791. doi: 10.3233/JAD-170665. - DOI - PubMed
    1. Blennow K, de Leon MJ, Zetterberg H. Alzheimer’s disease. Lancet. 2006;368:387–403. doi: 10.1016/S0140-6736(06)69113-7. - DOI - PubMed
    1. Navarro A, del Valle E, Martinez E, Ordonez C, Perez C, Tolivia J. Highly selective and fast diagnosis of Alzheimer’s disease hallmark lesions using congo red in isopropyl alcoholic solution. J Alzheimers Dis. 2013;35:589–597. doi: 10.3233/JAD-122386. - DOI - PubMed
    1. Mavrogiorgou P, Gertz HJ, Ferszt R, Wolf R, Bar KJ, Juckell G. Are routine methods good enough to stain senile plaques and neurofibrillary tangles in different brain regions of demented patients? Psychiatr Danub. 2011;23:334–339. - PubMed
    1. Wisniewski HM, Wen GY, Kim KS. Comparison of four staining methods on the detection of neuritic plaques. Acta Neuropathol. 1989;78:22–27. doi: 10.1007/BF00687398. - DOI - PubMed

LinkOut - more resources