

Prediction of IDH genotype in gliomas with dynamic susceptibility contrast perfusion MR imaging using an explainable recurrent neural network
- PMID: 31127834
- PMCID: PMC7594560
- DOI: 10.1093/neuonc/noz095
Prediction of IDH genotype in gliomas with dynamic susceptibility contrast perfusion MR imaging using an explainable recurrent neural network
Abstract
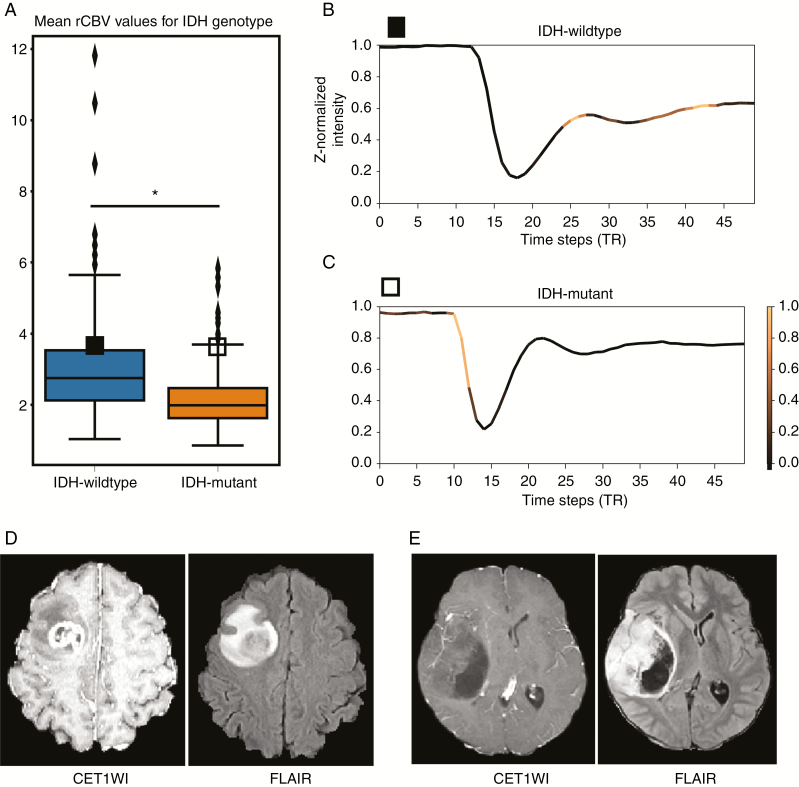
Background: The aim of this study was to predict isocitrate dehydrogenase (IDH) genotypes of gliomas using an interpretable deep learning application for dynamic susceptibility contrast (DSC) perfusion MRI.
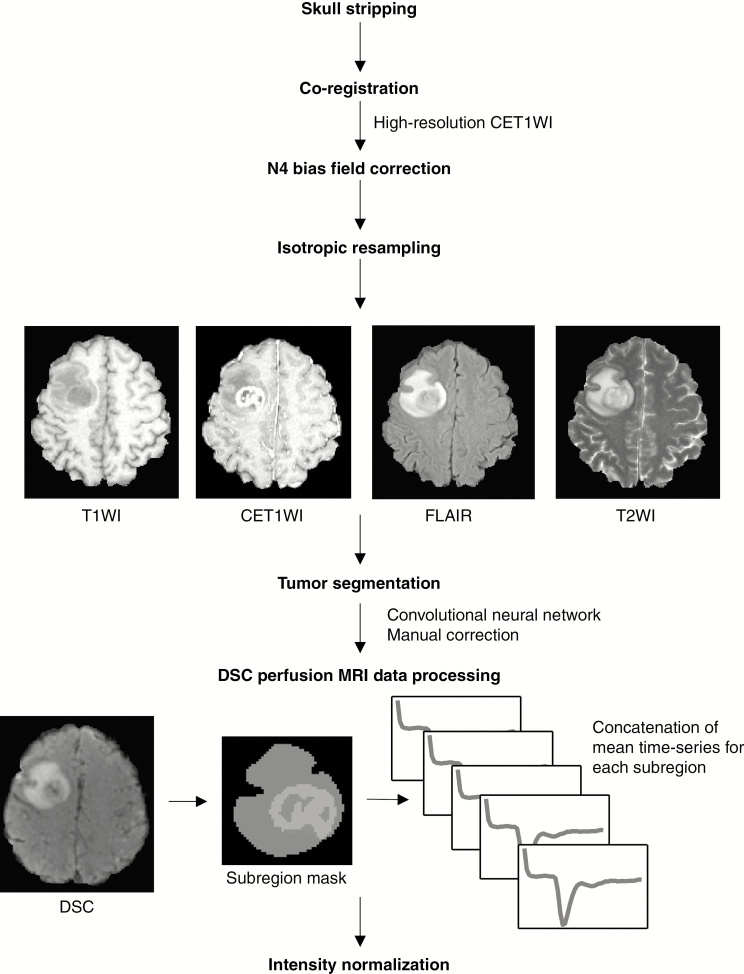
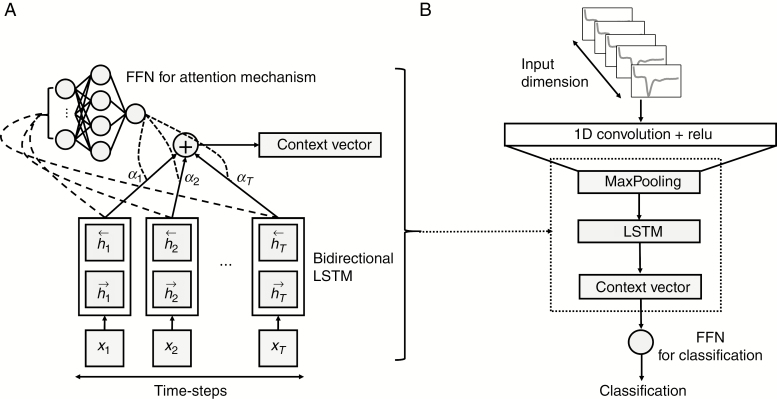
Methods: Four hundred sixty-three patients with gliomas who underwent preoperative MRI were enrolled in the study. All the patients had immunohistopathologic diagnoses of either IDH-wildtype or IDH-mutant gliomas. Tumor subregions were segmented using a convolutional neural network followed by manual correction. DSC perfusion MRI was performed to obtain T2* susceptibility signal intensity-time curves from each subregion of the tumors: enhancing tumor, non-enhancing tumor, peritumoral edema, and whole tumor. These, with arterial input functions, were fed into a neural network as multidimensional inputs. A convolutional long short-term memory model with an attention mechanism was developed to predict IDH genotypes. Receiver operating characteristics analysis was performed to evaluate the model.
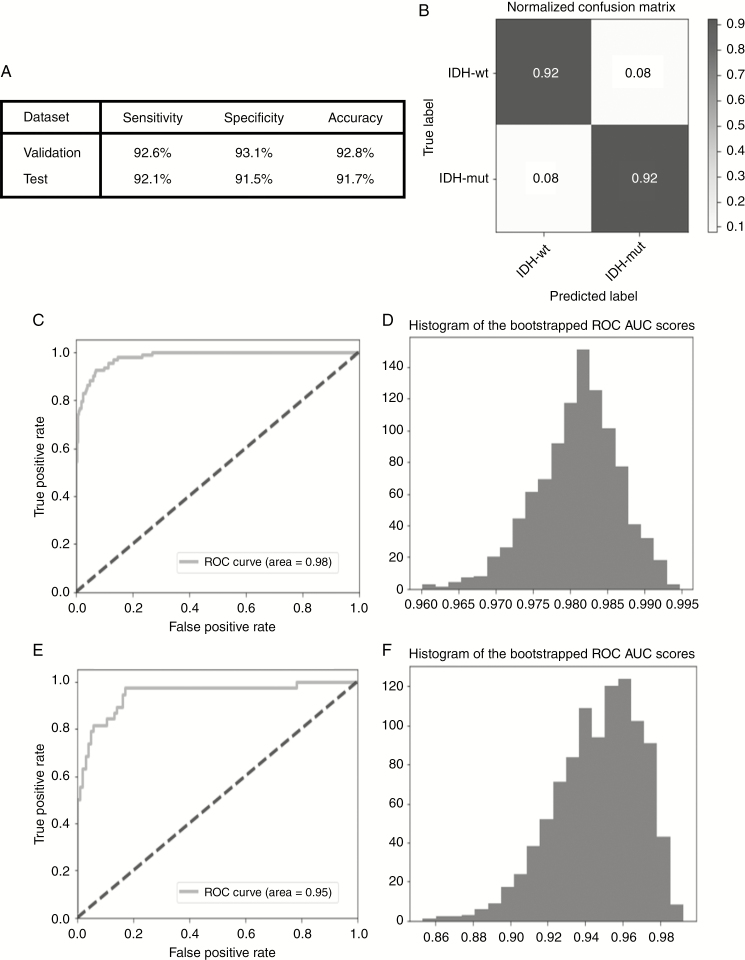
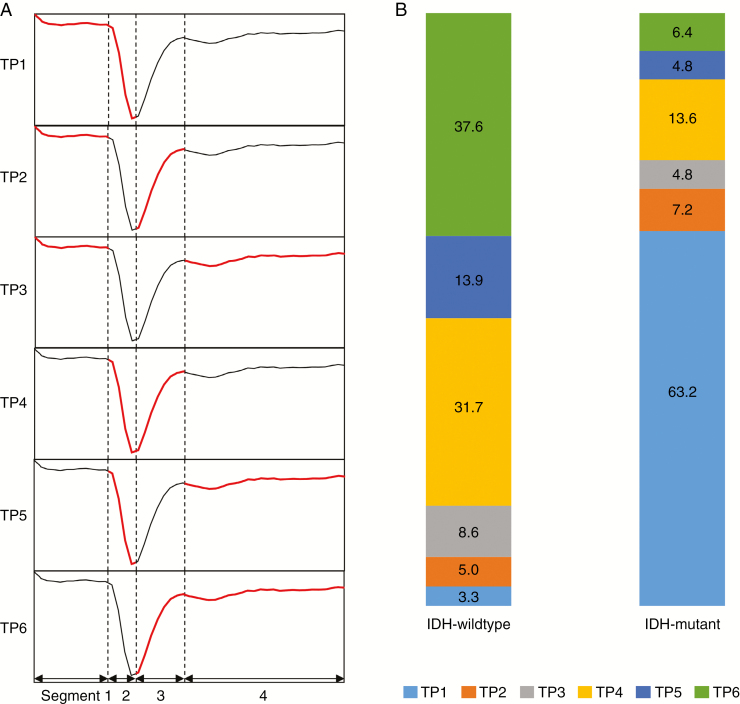
Results: The IDH genotype predictions had an accuracy, sensitivity, and specificity of 92.8%, 92.6%, and 93.1%, respectively, in the validation set (area under the curve [AUC], 0.98; 95% confidence interval [CI], 0.969-0.991) and 91.7%, 92.1%, and 91.5%, respectively, in the test set (AUC, 0.95; 95% CI, 0.898-0.982). In temporal feature analysis, T2* susceptibility signal intensity-time curves obtained from DSC perfusion MRI with attention weights demonstrated high attention on the combination of the end of the pre-contrast baseline, up/downslopes of signal drops, and/or post-bolus plateaus for the curves used to predict IDH genotype.
Conclusions: We developed an explainable recurrent neural network model based on DSC perfusion MRI to predict IDH genotypes in gliomas.
Keywords: angiogenesis; dynamic susceptibility contrast perfusion-weighted imaging; gliomas; isocitrate dehydrogenase mutations; recurrent neural network.
© The Author(s) 2019. Published by Oxford University Press on behalf of the Society for Neuro-Oncology. All rights reserved. For permissions, please e-mail: journals.permissions@oup.com.
Figures
Similar articles
-
Preoperative prediction of IDH genotypes and prognosis in adult-type diffuse gliomas: intratumor heterogeneity habitat analysis using dynamic contrast-enhanced MRI and diffusion-weighted imaging.Cancer Imaging. 2025 Feb 8;25(1):11. doi: 10.1186/s40644-025-00829-5. Cancer Imaging. 2025. PMID: 39923105 Free PMC article.
-
Diffusion- and perfusion-weighted MRI radiomics model may predict isocitrate dehydrogenase (IDH) mutation and tumor aggressiveness in diffuse lower grade glioma.Eur Radiol. 2020 Apr;30(4):2142-2151. doi: 10.1007/s00330-019-06548-3. Epub 2019 Dec 11. Eur Radiol. 2020. PMID: 31828414
-
Role of Histogram Features on Arterial Spin Labeling Perfusion Magnetic Resonance Imaging in Identifying Isocitrate Dehydrogenase Genotypes and Glioma Malignancies.Turk Neurosurg. 2024;34(4):578-587. doi: 10.5137/1019-5149.JTN.42484-22.3. Turk Neurosurg. 2024. PMID: 38874235
-
Diagnostic accuracy and potential covariates for machine learning to identify IDH mutations in glioma patients: evidence from a meta-analysis.Eur Radiol. 2020 Aug;30(8):4664-4674. doi: 10.1007/s00330-020-06717-9. Epub 2020 Mar 19. Eur Radiol. 2020. PMID: 32193643 Review.
-
The T2-FLAIR-mismatch sign as an imaging biomarker for IDH and 1p/19q status in diffuse low-grade gliomas: a systematic review with a Bayesian approach to evaluation of diagnostic test performance.Neurosurg Focus. 2019 Dec 1;47(6):E13. doi: 10.3171/2019.9.FOCUS19660. Neurosurg Focus. 2019. PMID: 31786548
Cited by
-
Preparation of ultrasound contrast agents: The exploration of the structure-echogenicity relationship of contrast agents based on neural network model.Front Oncol. 2022 Oct 5;12:964314. doi: 10.3389/fonc.2022.964314. eCollection 2022. Front Oncol. 2022. PMID: 36276089 Free PMC article.
-
Validation of MRI-Based Models to Predict MGMT Promoter Methylation in Gliomas: BraTS 2021 Radiogenomics Challenge.Cancers (Basel). 2022 Oct 3;14(19):4827. doi: 10.3390/cancers14194827. Cancers (Basel). 2022. PMID: 36230750 Free PMC article.
-
Quantitative MRI-based radiomics for noninvasively predicting molecular subtypes and survival in glioma patients.NPJ Precis Oncol. 2021 Jul 26;5(1):72. doi: 10.1038/s41698-021-00205-z. NPJ Precis Oncol. 2021. PMID: 34312469 Free PMC article.
-
Plasma-Derived Exosomal i-tRF-LeuCAA as Biomarker for Glioma Diagnosis and Promoter of Epithelial-Mesenchymal Transition via TPM4 Regulation.CNS Neurosci Ther. 2025 Apr;31(4):e70356. doi: 10.1111/cns.70356. CNS Neurosci Ther. 2025. PMID: 40202170 Free PMC article.
-
Fully automated hybrid approach to predict the IDH mutation status of gliomas via deep learning and radiomics.Neuro Oncol. 2021 Feb 25;23(2):304-313. doi: 10.1093/neuonc/noaa177. Neuro Oncol. 2021. PMID: 32706862 Free PMC article.
References
-
- Louis DN, Perry A, Reifenberger G, et al. . The 2016 World Health Organization classification of tumors of the central nervous system: a summary. Acta Neuropathol. 2016;131(6):803–820. - PubMed
-
- Stupp R, Mason WP, van den Bent MJ, et al. ; European Organisation for Research and Treatment of Cancer Brain Tumor and Radiotherapy Groups; National Cancer Institute of Canada Clinical Trials Group Radiotherapy plus concomitant and adjuvant temozolomide for glioblastoma. N Engl J Med. 2005;352(10):987–996. - PubMed
Publication types
MeSH terms
Substances
LinkOut - more resources
Full Text Sources
Medical
