
Abstract

Background: Tobacco and alcohol are well-established risk factors for numerous cancers, yet their relationship to biliary tract cancers remains unclear.

Methods: We pooled data from 26 prospective studies to evaluate associations of cigarette smoking and alcohol consumption with biliary tract cancer risk. Study-specific hazard ratios (HRs) and 95% confidence intervals (CIs) for associations with smoking and alcohol consumption were calculated. Random-effects meta-analysis produced summary estimates. All statistical tests were two-sided.

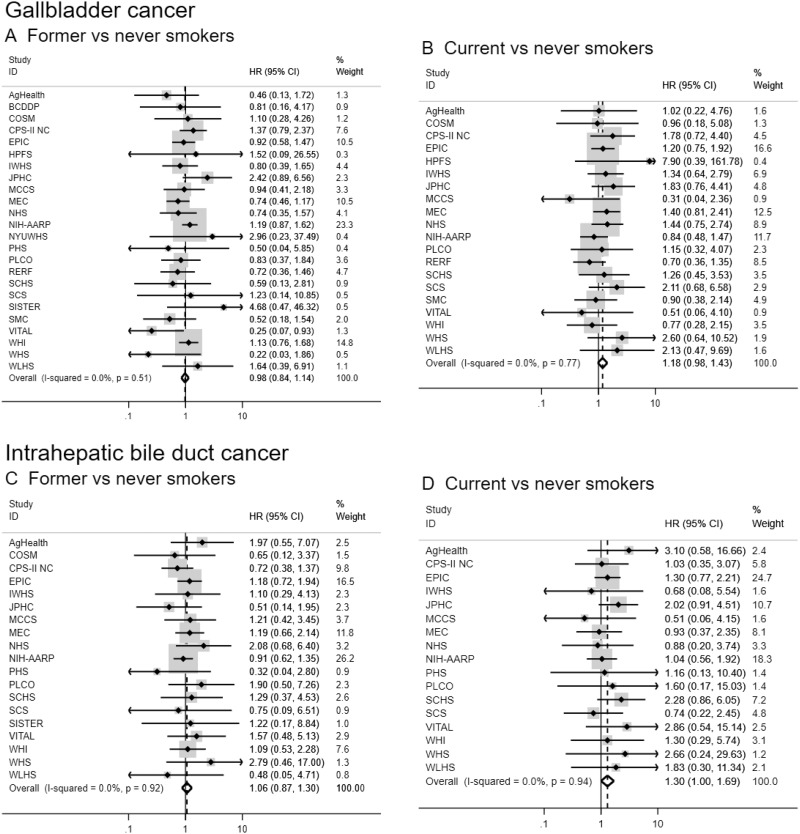
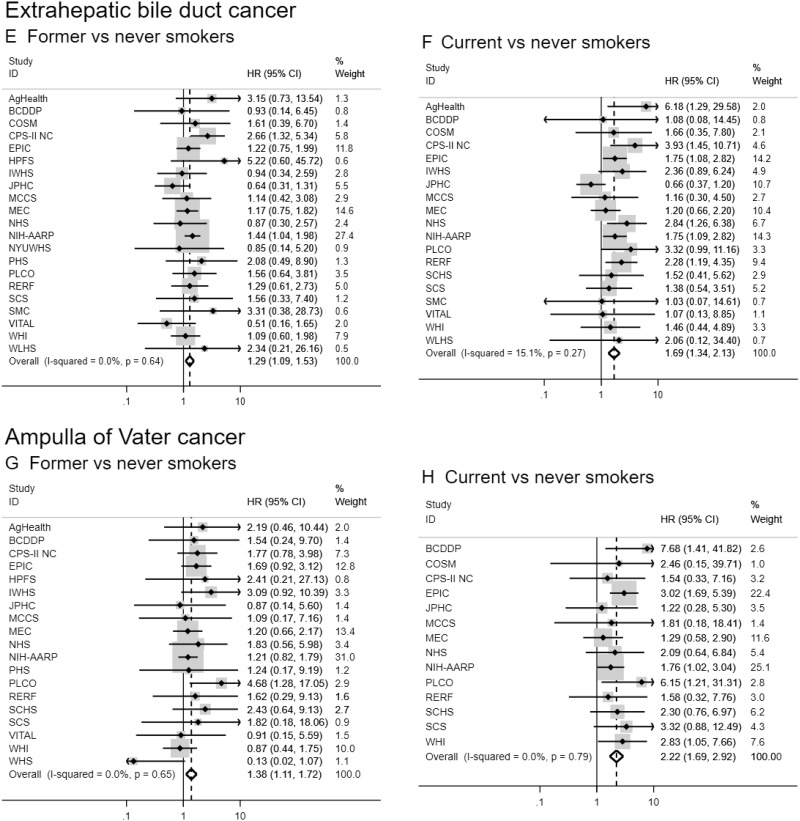
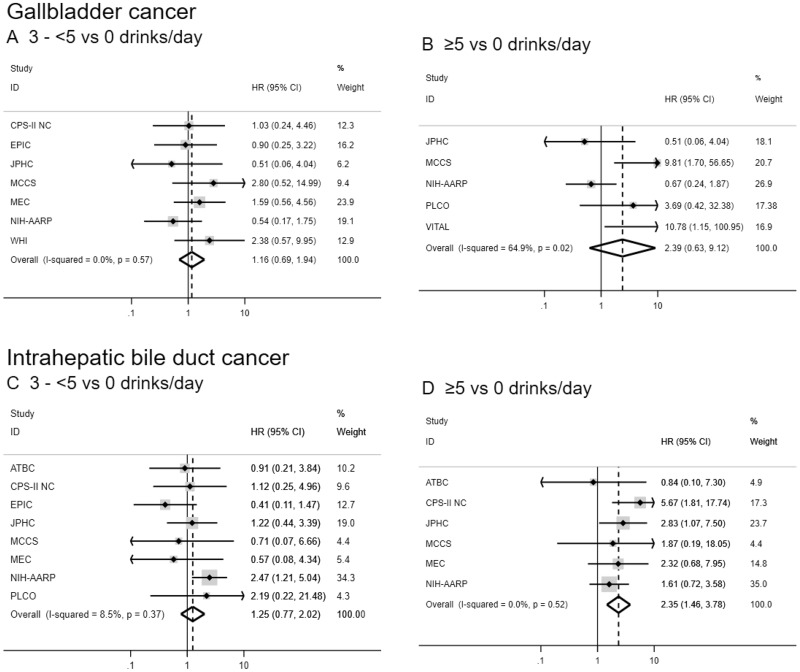
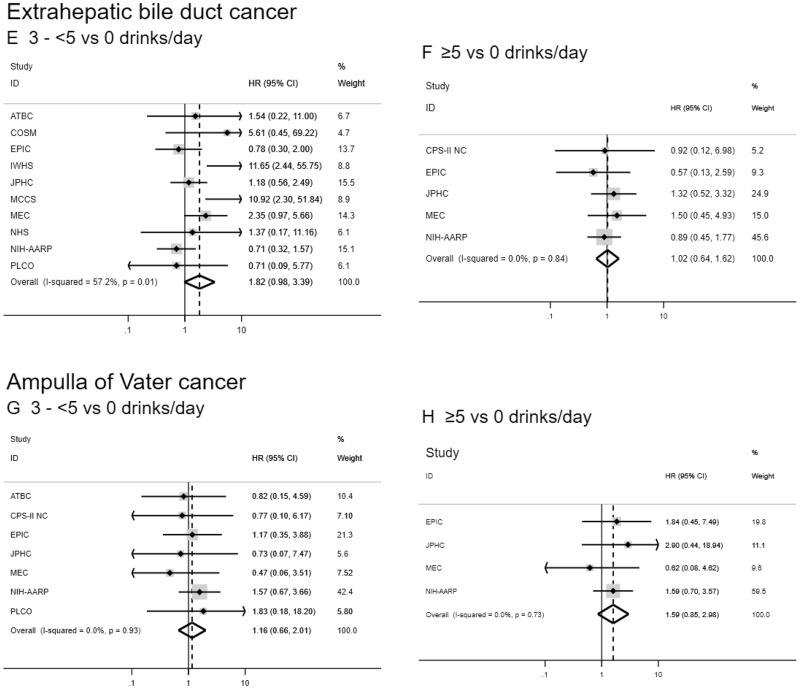
Results: Over a period of 38 369 156 person-years of follow-up, 1391 gallbladder, 758 intrahepatic bile duct, 1208 extrahepatic bile duct, and 623 ampulla of Vater cancer cases were identified. Ever, former, and current smoking were associated with increased extrahepatic bile duct and ampulla of Vater cancers risk (eg, current vs never smokers HR = 1.69, 95% CI = 1.34 to 2.13 and 2.22, 95% CI = 1.69 to 2.92, respectively), with dose-response effects for smoking pack-years, duration, and intensity (all Ptrend < .01). Current smoking and smoking intensity were also associated with intrahepatic bile duct cancer (eg, >40 cigarettes per day vs never smokers HR = 2.15, 95 % CI = 1.15 to 4.00; Ptrend = .001). No convincing association was observed between smoking and gallbladder cancer. Alcohol consumption was only associated with intrahepatic bile duct cancer, with increased risk for individuals consuming five or more vs zero drinks per day (HR = 2.35, 95%CI = 1.46 to 3.78; Ptrend = .04). There was evidence of statistical heterogeneity among several cancer sites, particularly between gallbladder cancer and the other biliary tract cancers.

Conclusions: Smoking appears to increase the risk of developing all biliary tract cancers except gallbladder cancer. Alcohol may increase the risk of intrahepatic bile duct cancer. Findings highlight etiologic heterogeneity across the biliary tract.


Figures

Figure 1.
Figure 1.
Forest plots for associations between cigarette smoking status and biliary tract cancer risk by anatomic site in the Biliary Tract Cancers Pooling Project. Hazard ratios for former vs never smoking (A, C, E, G) and current vs never smoking (B, D, F, H) are adjusted for sex (male, female), race (white, black, Asian and Pacific Islander, other), education (less than high school graduate, high school graduate, some college or post-high school training), body mass index in kg per m2 (<18.5, 18.5–<25, 25–<30, 30), diabetes (ever vs never diagnosed), birth cohort (1870–1899, 1900–1909, 1910–1919, 1920–1929, 1930–1939, 1940–1949, 1950–1959, 1960–1982), and alcoholic drinks per day (0, >0–0.5, >0.5–1, 1–<3, 3). Small black-filled diamonds represent the point estimates for each study. Horizontal lines represent 95% confidence intervals; if ending in an arrow, the interval transcends the region plotted. % weight describes the weight (inverse variance) each study contributed to the summary hazard ratio. Study weight is also represented by the shaded gray region around each study-specific point estimate. I2 is the percentage of variation due to between-study heterogeneity. Summary hazard ratios (dotted lines) and 95% confidence intervals (hollow diamonds) were estimated via random-effects meta-analysis. All statistical tests were two-sided. P values were calculated using the Wald test. Some additional studies collected information on cigarette smoking status but could not contribute to this meta-analysis because they did not have a sufficient number of biliary tract cancer patients who were former or current smokers. AgHealth = Agricultural Health Study; BCDDP = Breast Cancer Detection Demonstration Project; CI = confidence interval; COSM = Cohort of Swedish Men; CPS–II NC = Cancer Prevention Study II Nutrition Cohort; EPIC = European Prospective Investigation into Cancer and Nutrition; HR = hazard ratio; HPFS = Health Professionals Follow–Up Study; IWHS = Iowa Women’s Health Study; JPHC = Japan Public Health Center-based prospective Study 1 and 2; MCCS = Melbourne Collaborative Cohort Study; MEC = Multiethnic Cohort Study; NHS = Nurses’ Health Study; NIH-AARP = National Institutes of Health-American Association of Retired Persons Diet and Health Study; NYUWHS = New York University Women’s Health Study; PHS = Physicians’ Health Study; PLCO = Prostate, Lung, Colorectal and Ovarian Cancer Screening Trial; RERF = Radiation Effects Research Foundation Life Span Study; SCHS = Singapore Chinese Health Study; SCS = Shanghai Cohort Study; SISTER = Sister Study; SMC = Swedish Mammography Cohort; VITAL = VITamins and Lifestyle Study; WHI = Women’s Health Initiative; WHS = Women’s Health Study; WLHS = Women’s Lifestyle and Health Study.
Figure 1.
Figure 1.
Forest plots for associations between cigarette smoking status and biliary tract cancer risk by anatomic site in the Biliary Tract Cancers Pooling Project. Hazard ratios for former vs never smoking (A, C, E, G) and current vs never smoking (B, D, F, H) are adjusted for sex (male, female), race (white, black, Asian and Pacific Islander, other), education (less than high school graduate, high school graduate, some college or post-high school training), body mass index in kg per m2 (<18.5, 18.5–<25, 25–<30, 30), diabetes (ever vs never diagnosed), birth cohort (1870–1899, 1900–1909, 1910–1919, 1920–1929, 1930–1939, 1940–1949, 1950–1959, 1960–1982), and alcoholic drinks per day (0, >0–0.5, >0.5–1, 1–<3, 3). Small black-filled diamonds represent the point estimates for each study. Horizontal lines represent 95% confidence intervals; if ending in an arrow, the interval transcends the region plotted. % weight describes the weight (inverse variance) each study contributed to the summary hazard ratio. Study weight is also represented by the shaded gray region around each study-specific point estimate. I2 is the percentage of variation due to between-study heterogeneity. Summary hazard ratios (dotted lines) and 95% confidence intervals (hollow diamonds) were estimated via random-effects meta-analysis. All statistical tests were two-sided. P values were calculated using the Wald test. Some additional studies collected information on cigarette smoking status but could not contribute to this meta-analysis because they did not have a sufficient number of biliary tract cancer patients who were former or current smokers. AgHealth = Agricultural Health Study; BCDDP = Breast Cancer Detection Demonstration Project; CI = confidence interval; COSM = Cohort of Swedish Men; CPS–II NC = Cancer Prevention Study II Nutrition Cohort; EPIC = European Prospective Investigation into Cancer and Nutrition; HR = hazard ratio; HPFS = Health Professionals Follow–Up Study; IWHS = Iowa Women’s Health Study; JPHC = Japan Public Health Center-based prospective Study 1 and 2; MCCS = Melbourne Collaborative Cohort Study; MEC = Multiethnic Cohort Study; NHS = Nurses’ Health Study; NIH-AARP = National Institutes of Health-American Association of Retired Persons Diet and Health Study; NYUWHS = New York University Women’s Health Study; PHS = Physicians’ Health Study; PLCO = Prostate, Lung, Colorectal and Ovarian Cancer Screening Trial; RERF = Radiation Effects Research Foundation Life Span Study; SCHS = Singapore Chinese Health Study; SCS = Shanghai Cohort Study; SISTER = Sister Study; SMC = Swedish Mammography Cohort; VITAL = VITamins and Lifestyle Study; WHI = Women’s Health Initiative; WHS = Women’s Health Study; WLHS = Women’s Lifestyle and Health Study.
Figure 2.
Figure 2.
Forest plots for associations between alcohol consumption (drinks per day) and biliary tract cancer risk by anatomic site in the Biliary Tract Cancers Pooling Project. Hazard ratios for three to fewer than five vs zero drinks per day (A, C, E, G) and five or more vs zero drinks per day (B, D, F, H) are adjusted for sex (male, female), race (white, black, Asian and Pacific Islander, other), education (less than high school graduate, high school graduate, some college or post-high school training), body mass index in kg per m2 (<18.5, 18.5–<25, 25–<30, 30), diabetes (ever vs never diagnosed), birth cohort (1870–1899, 1900–1909, 1910–1919, 1920–1929, 1930–1939, 1940–1949, 1950–1959, 1960–1982), and cigarette smoking status (never, former, current). Small black-filled diamonds represent the point estimates for each study. Horizontal lines represent 95% confidence intervals; if ending in an arrow, the interval transcends the region plotted. % weight describes the weight (inverse variance) each study contributed to the summary hazard ratio. Study weight is also represented by the shaded gray region around each study-specific point estimate. I2 is the percentage of variation due to between-study heterogeneity. Summary hazard ratios (dotted lines) and 95% confidence intervals (hollow diamonds) were estimated via random-effects meta-analysis. All statistical tests were two-sided. P values were calculated using the Wald test. Some additional studies collected information on alcoholic drinks per day but could not contribute to this meta-analysis because they did not have a sufficient number of biliary tract cancer patients consuming three to fewer than five or five or more drinks per day. ATBC = Alpha-Tocopherol, Beta-Carotene Cancer Prevention Study; CI = confidence interval; COSM = Cohort of Swedish Men; CPS-II NC = Cancer Prevention Study II Nutrition Cohort; EPIC = European Prospective Investigation into Cancer and Nutrition; HR = hazard ratio; IWHS = Iowa Women’s Health Study; JPHC = Japan Public Health Center-based prospective Study 1 and 2; MCCS = Melbourne Collaborative Cohort Study; MEC = Multiethnic Cohort Study; NHS = Nurses’ Health Study; NIH-AARP = National Institutes of Health-American Association of Retired Persons Diet and Health Study; PLCO = Prostate, Lung, Colorectal and Ovarian Cancer Screening Trial; VITAL = VITamins and Lifestyle Study; WHI = Women’s Health Initiative.
Figure 2.
Figure 2.
Forest plots for associations between alcohol consumption (drinks per day) and biliary tract cancer risk by anatomic site in the Biliary Tract Cancers Pooling Project. Hazard ratios for three to fewer than five vs zero drinks per day (A, C, E, G) and five or more vs zero drinks per day (B, D, F, H) are adjusted for sex (male, female), race (white, black, Asian and Pacific Islander, other), education (less than high school graduate, high school graduate, some college or post-high school training), body mass index in kg per m2 (<18.5, 18.5–<25, 25–<30, 30), diabetes (ever vs never diagnosed), birth cohort (1870–1899, 1900–1909, 1910–1919, 1920–1929, 1930–1939, 1940–1949, 1950–1959, 1960–1982), and cigarette smoking status (never, former, current). Small black-filled diamonds represent the point estimates for each study. Horizontal lines represent 95% confidence intervals; if ending in an arrow, the interval transcends the region plotted. % weight describes the weight (inverse variance) each study contributed to the summary hazard ratio. Study weight is also represented by the shaded gray region around each study-specific point estimate. I2 is the percentage of variation due to between-study heterogeneity. Summary hazard ratios (dotted lines) and 95% confidence intervals (hollow diamonds) were estimated via random-effects meta-analysis. All statistical tests were two-sided. P values were calculated using the Wald test. Some additional studies collected information on alcoholic drinks per day but could not contribute to this meta-analysis because they did not have a sufficient number of biliary tract cancer patients consuming three to fewer than five or five or more drinks per day. ATBC = Alpha-Tocopherol, Beta-Carotene Cancer Prevention Study; CI = confidence interval; COSM = Cohort of Swedish Men; CPS-II NC = Cancer Prevention Study II Nutrition Cohort; EPIC = European Prospective Investigation into Cancer and Nutrition; HR = hazard ratio; IWHS = Iowa Women’s Health Study; JPHC = Japan Public Health Center-based prospective Study 1 and 2; MCCS = Melbourne Collaborative Cohort Study; MEC = Multiethnic Cohort Study; NHS = Nurses’ Health Study; NIH-AARP = National Institutes of Health-American Association of Retired Persons Diet and Health Study; PLCO = Prostate, Lung, Colorectal and Ovarian Cancer Screening Trial; VITAL = VITamins and Lifestyle Study; WHI = Women’s Health Initiative.

Similar articles

Cited by

References

    1. Castro FA, Koshiol J, Hsing AW, et al. Biliary tract cancer incidence in the United States—demographic and temporal variations by anatomic site. Int J Cancer. 2013;133(7):1664–1671. - PMC - PubMed
    1. Hsing A, Rashid A, Devesa S, et al. Biliary tract cancer In: Schottenfeld D, Fraumeni JF Jr eds. Cancer Epidemiology and Prevention. 3rd ed. New York: Oxford University Press, Inc; 2006:787–800.
    1. Njei B. Changing pattern of epidemiology in intrahepatic cholangiocarcinoma. Hepatology. 2014;60(3):1107–1108. - PubMed
    1. Ferlay J, Soerjomataram I, Dikshit R, et al. Cancer incidence and mortality worldwide: sources, methods and major patterns in GLOBOCAN 2012. Int J Cancer. 2015;136(5):E359–E386. - PubMed
    1. Patel T. Increasing incidence and mortality of primary intrahepatic cholangiocarcinoma in the United States. Hepatology. 2001;33(6):1353–1357. - PubMed

Publication types

MeSH terms