. 2019 Aug:185:107672.
doi: 10.1016/j.exer.2019.05.012. Epub 2019 May 22.

Prolonged ocular exposure leads to retinal lesions in mice

Affiliations

Prolonged ocular exposure leads to retinal lesions in mice

Brent A Bell et al. Exp Eye Res. 2019 Aug.

Abstract

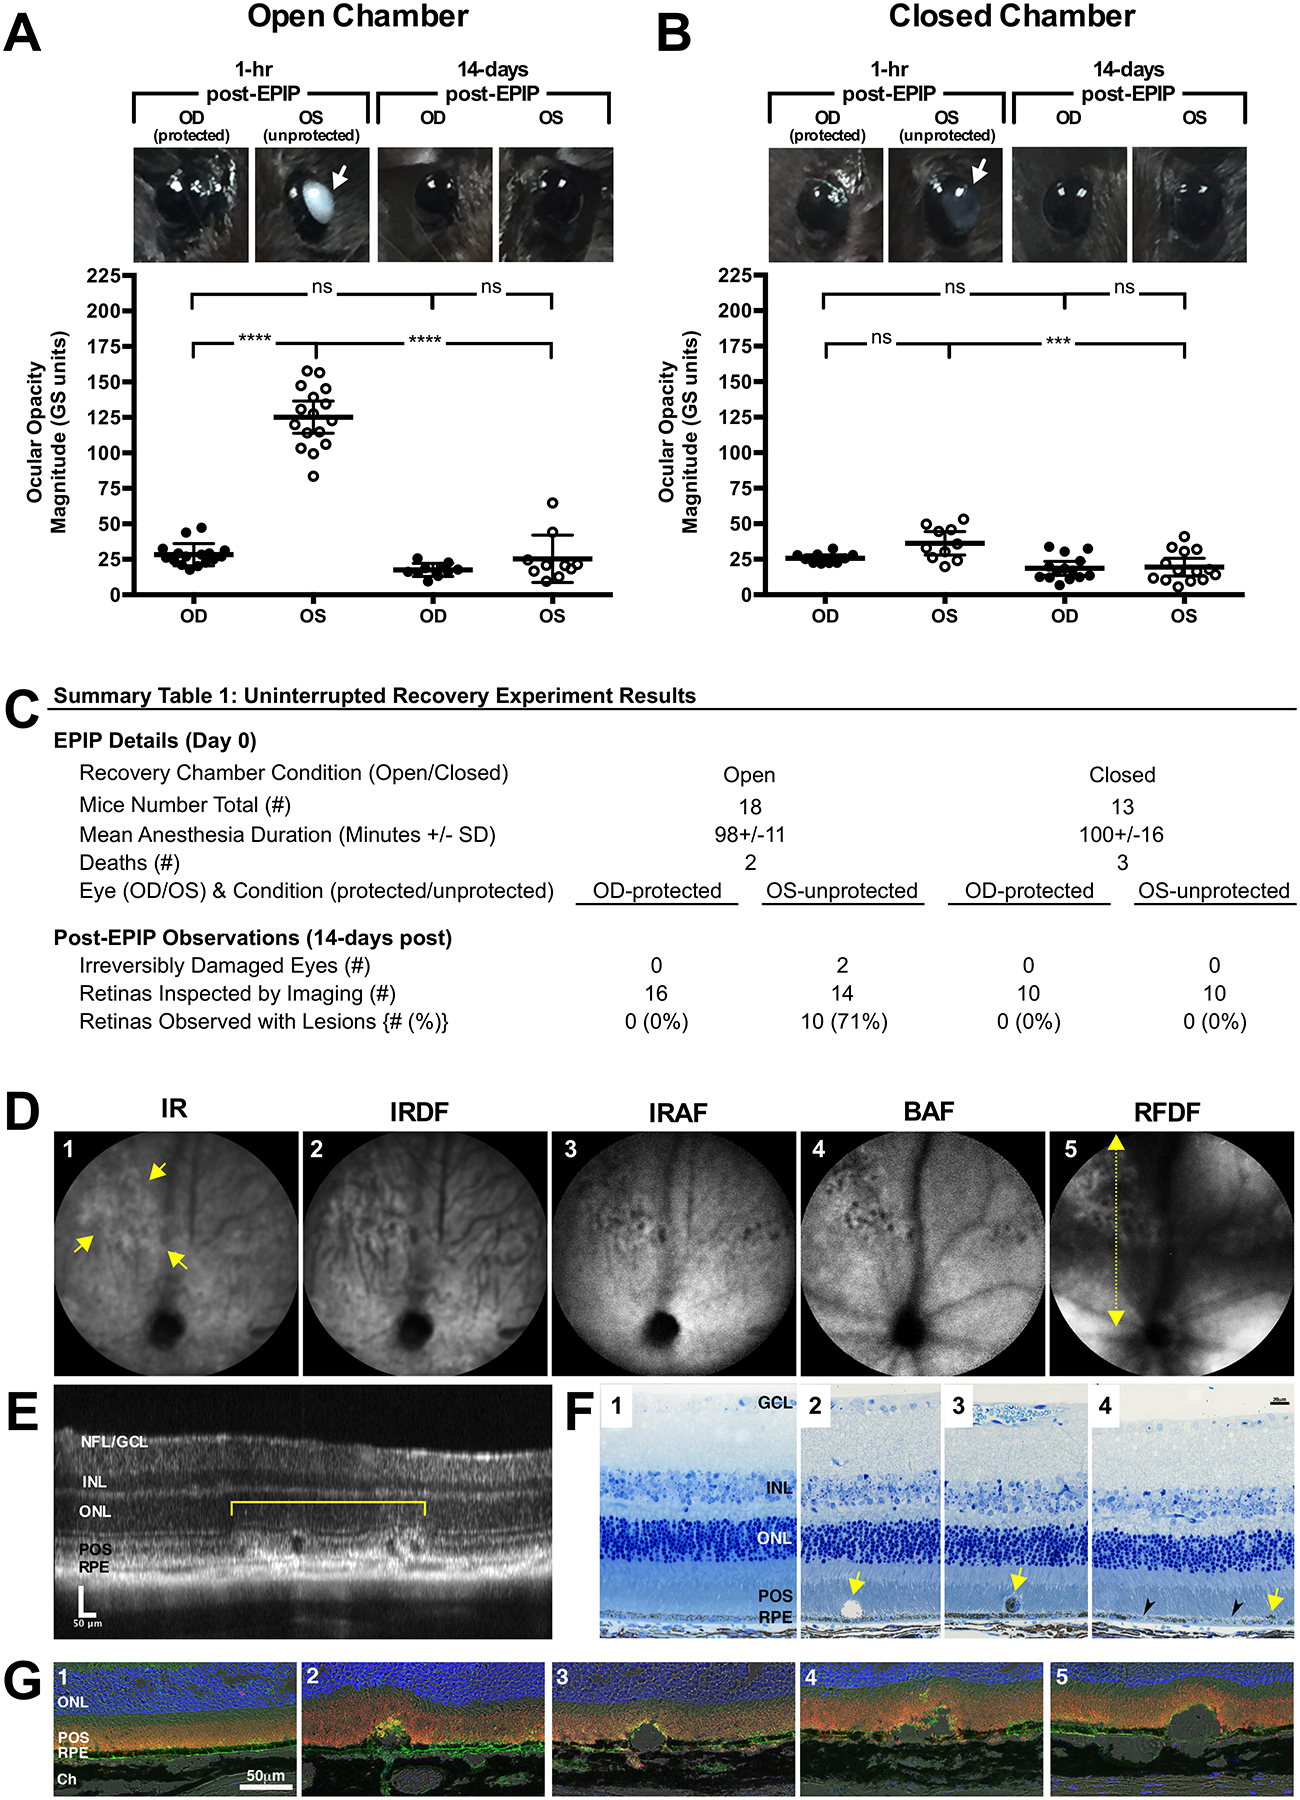
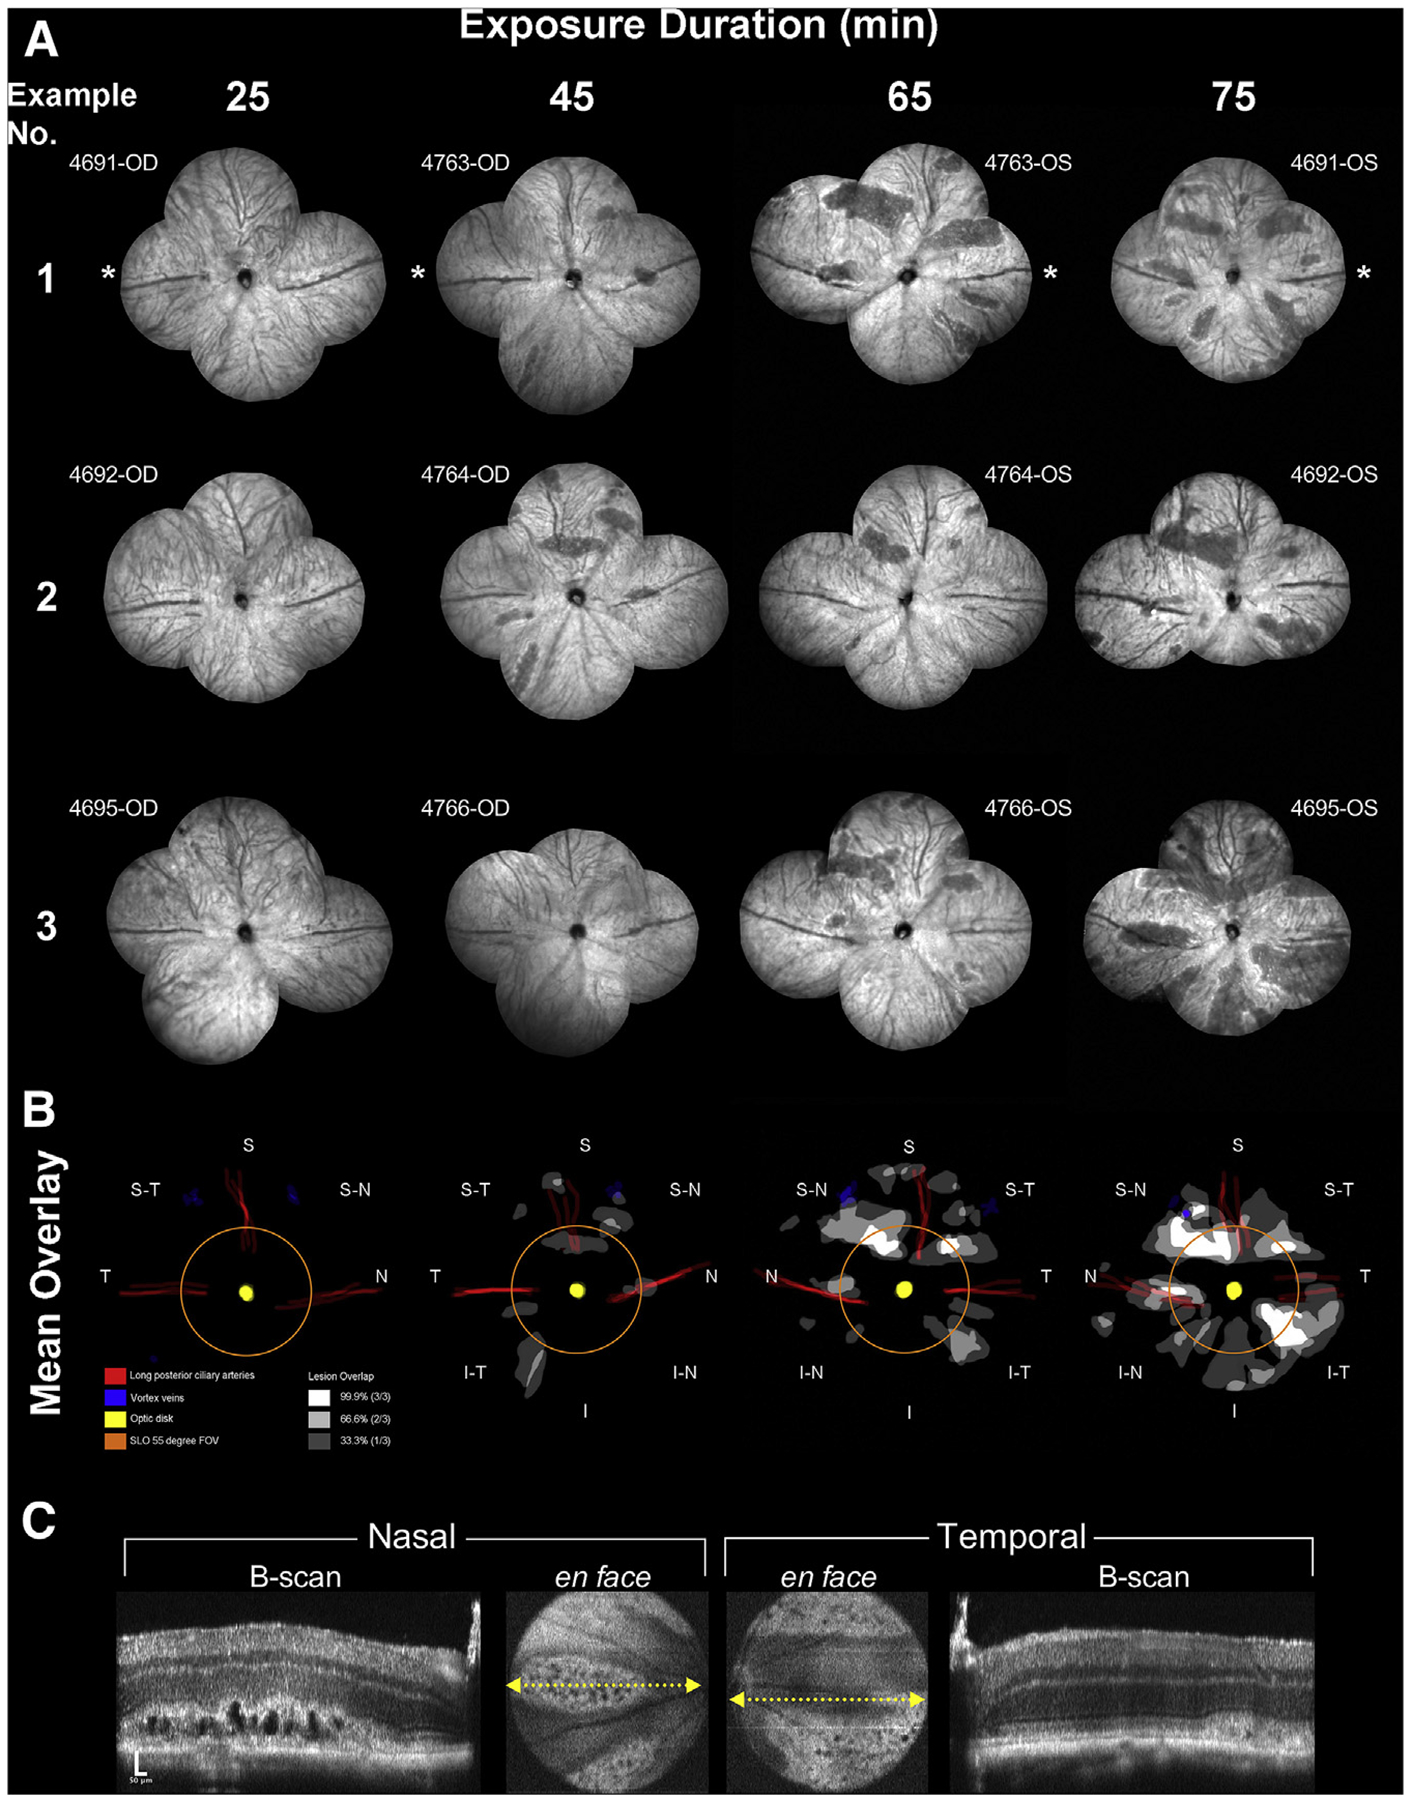
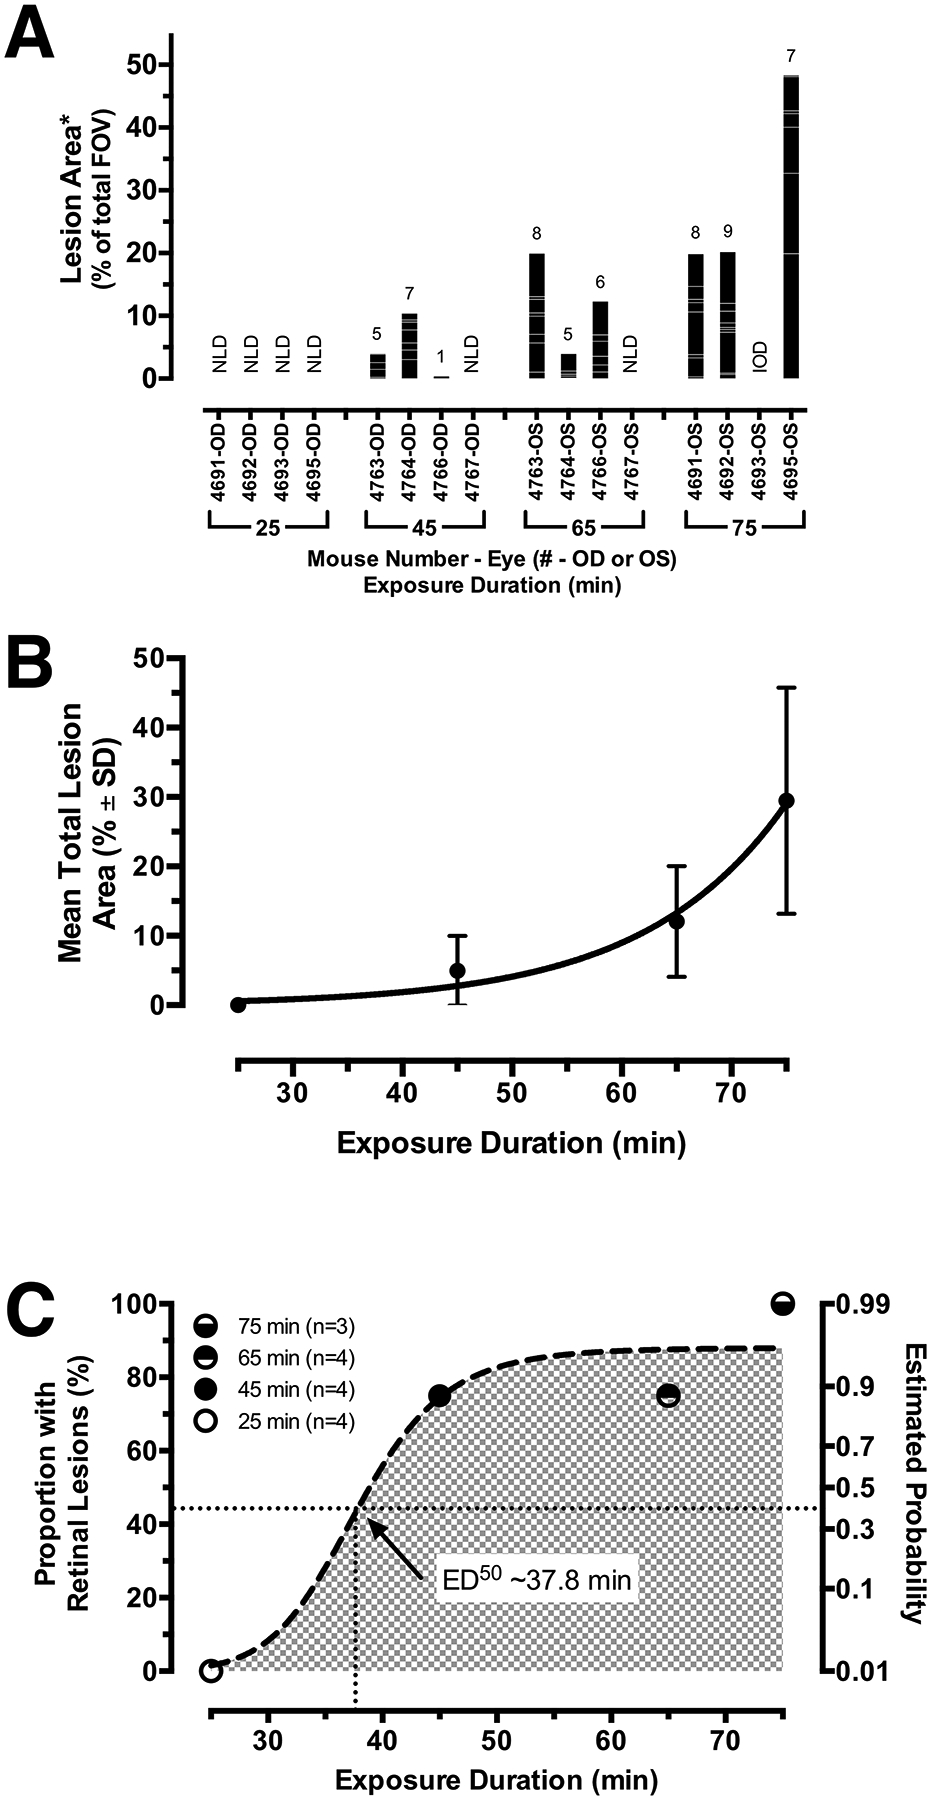
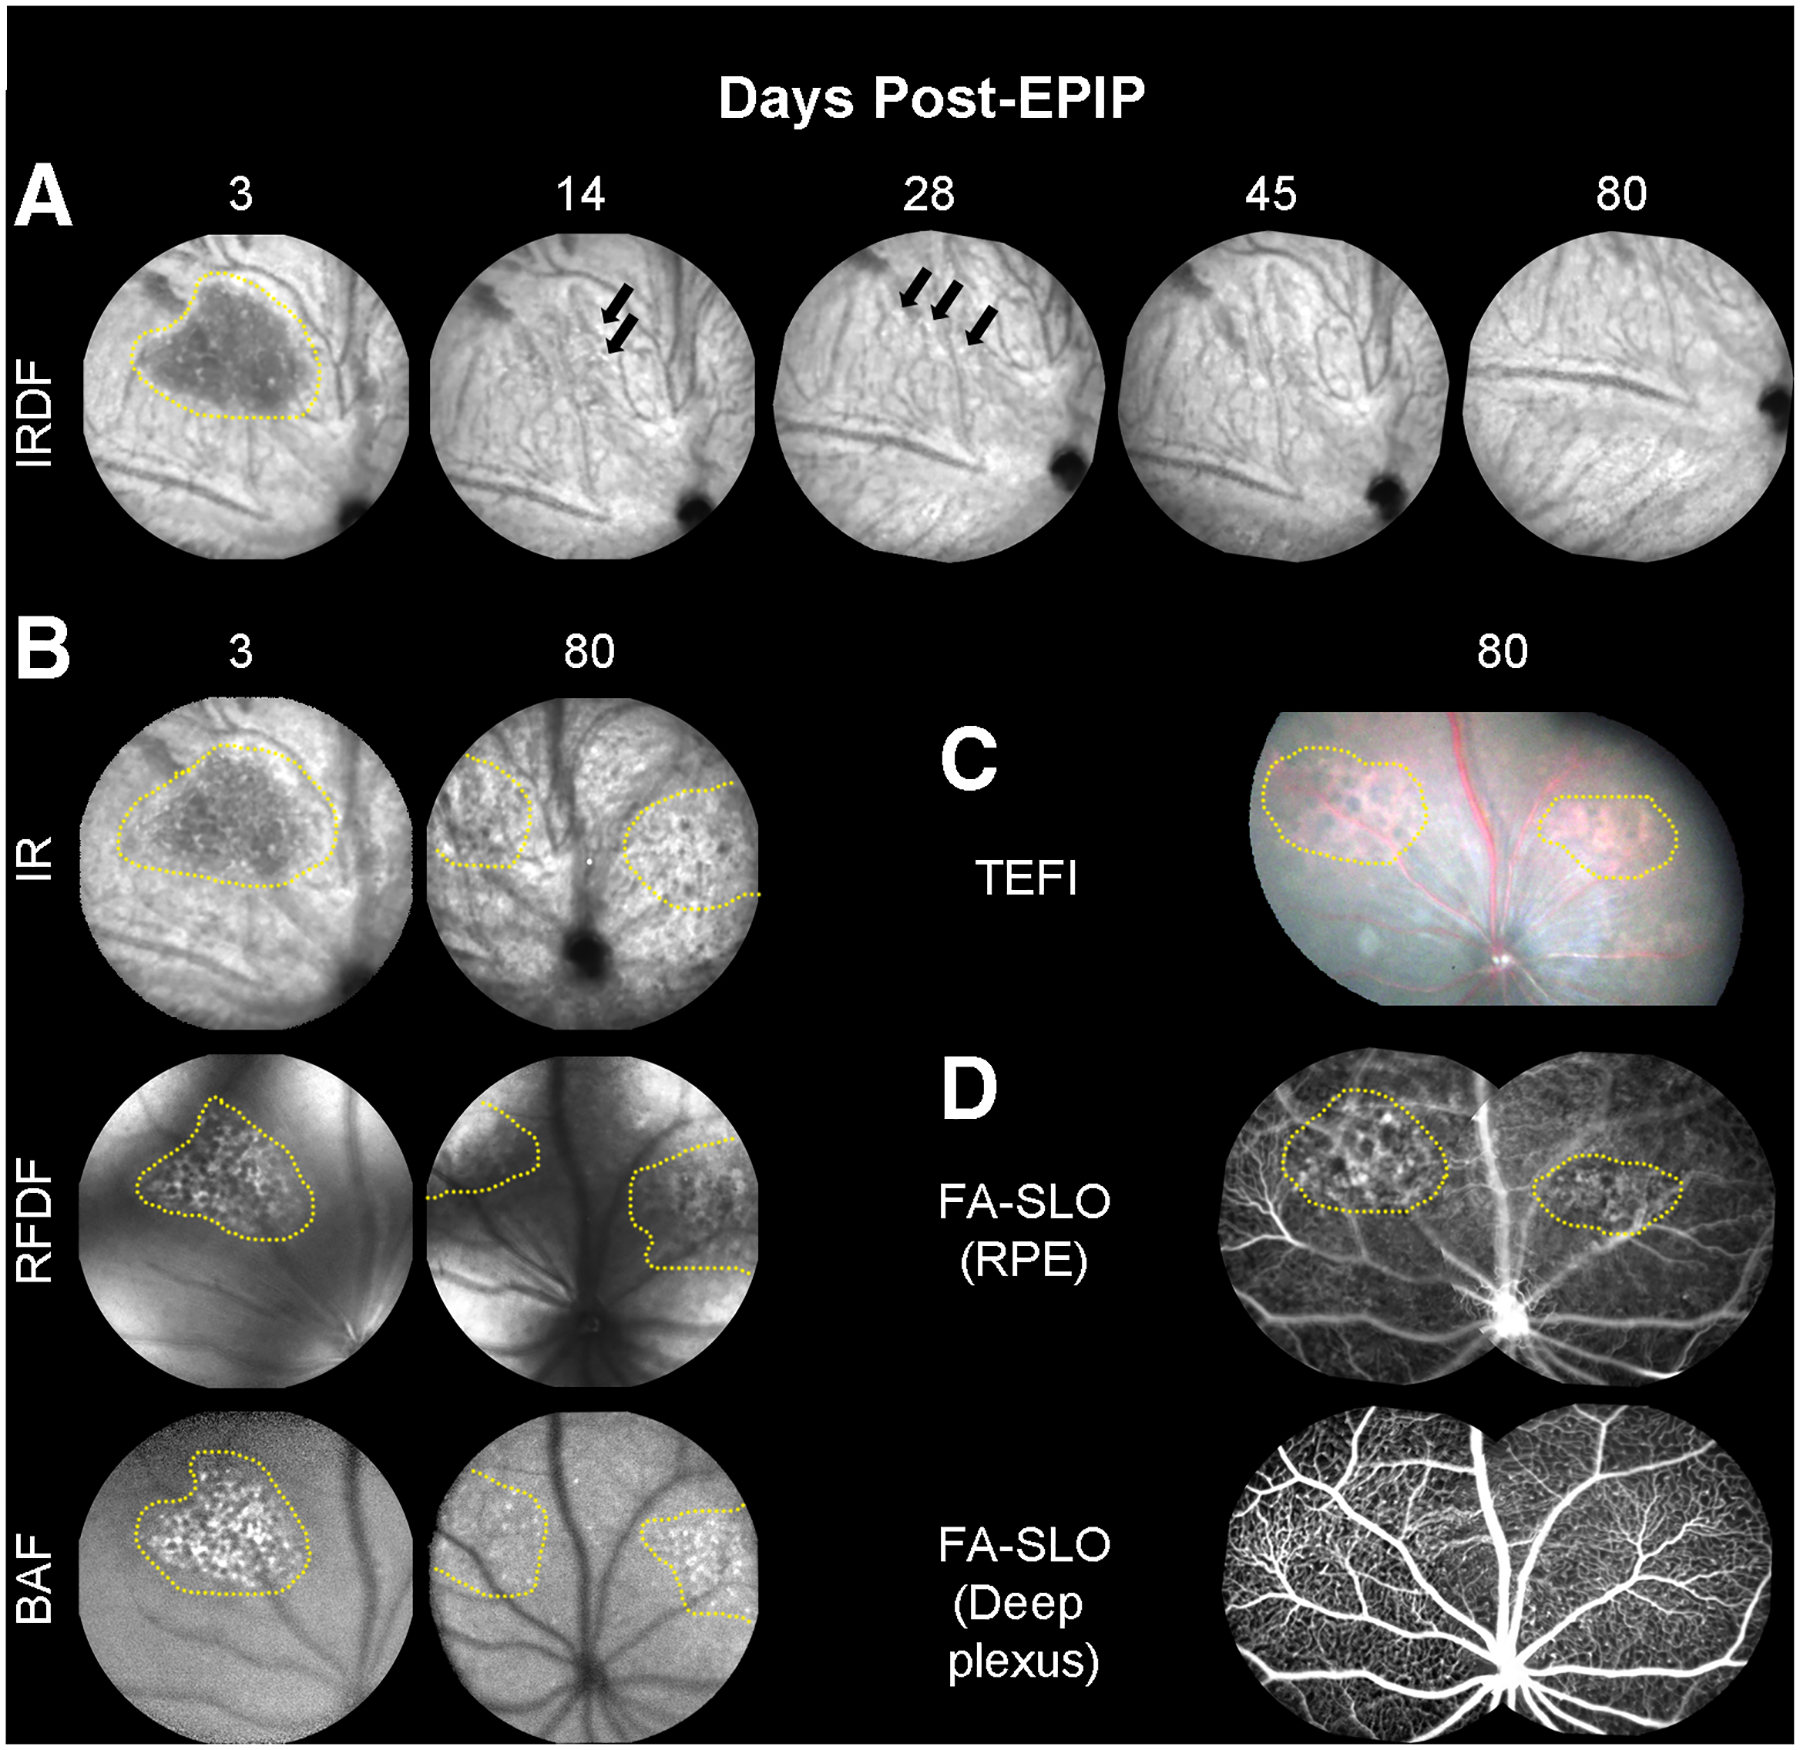
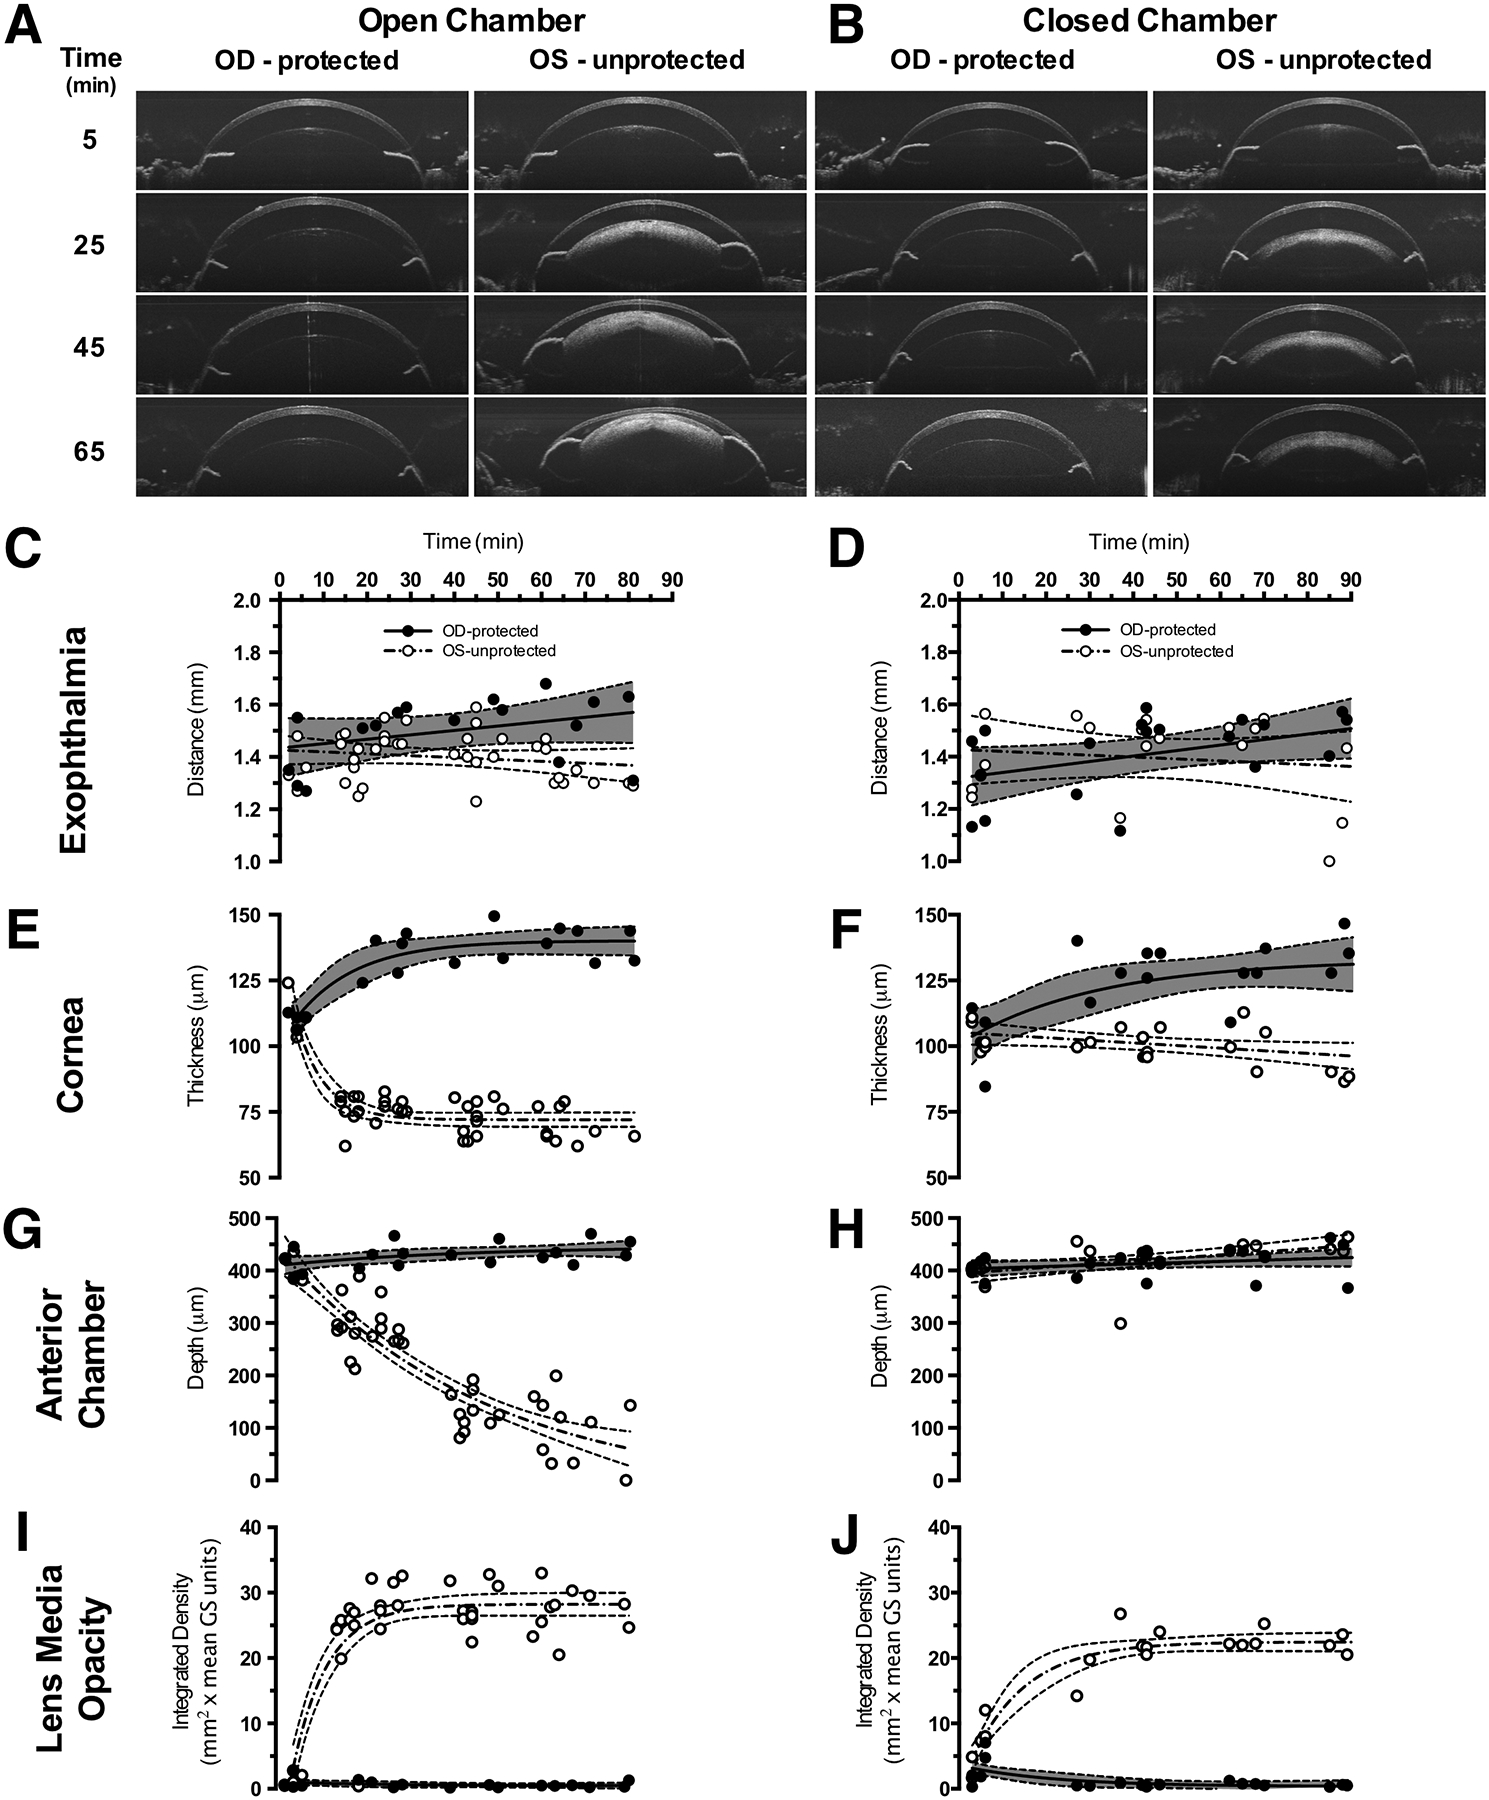
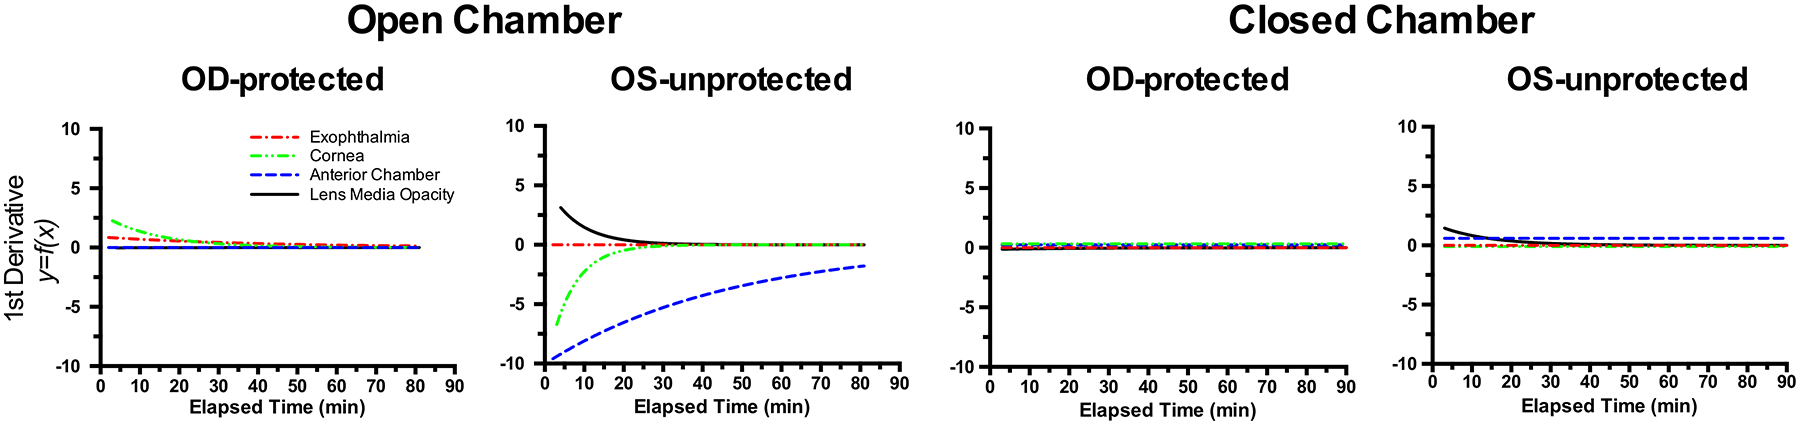
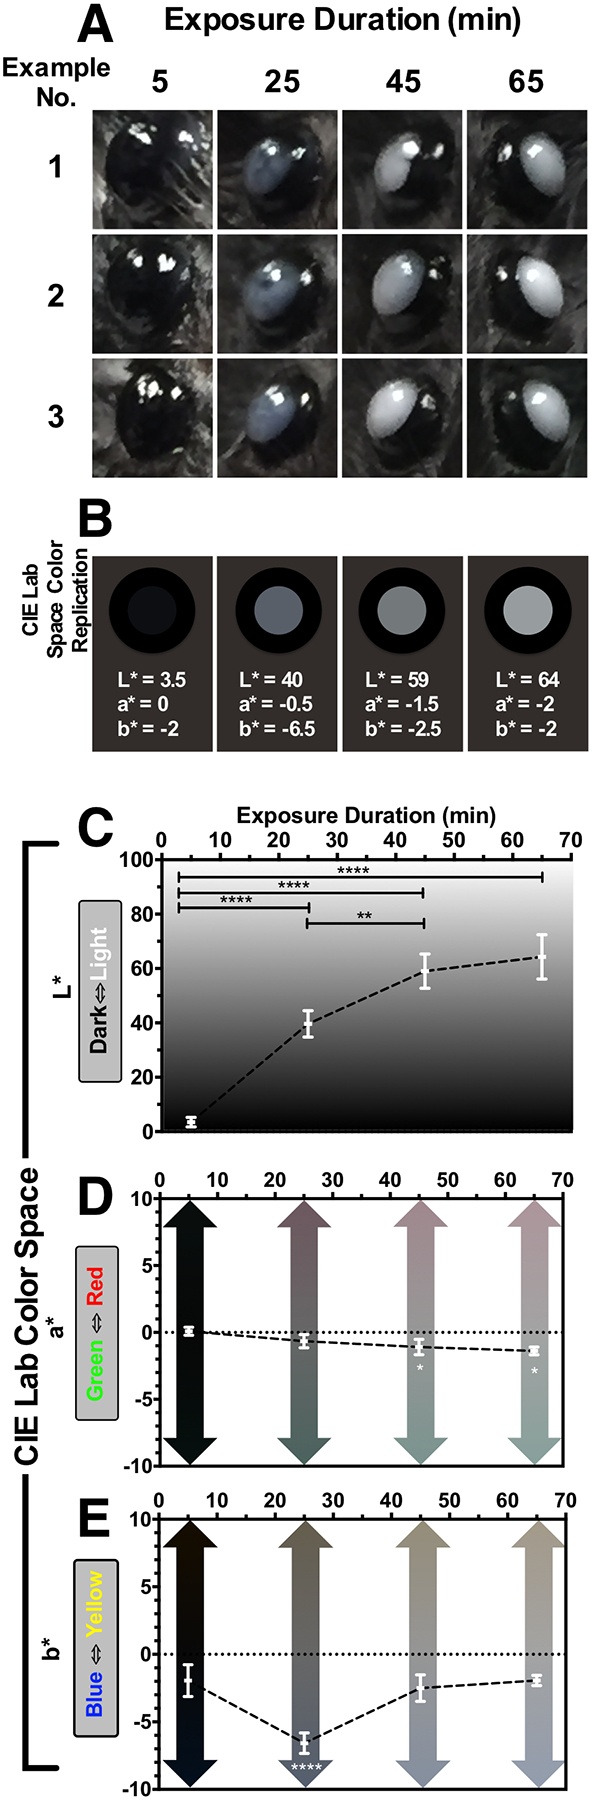
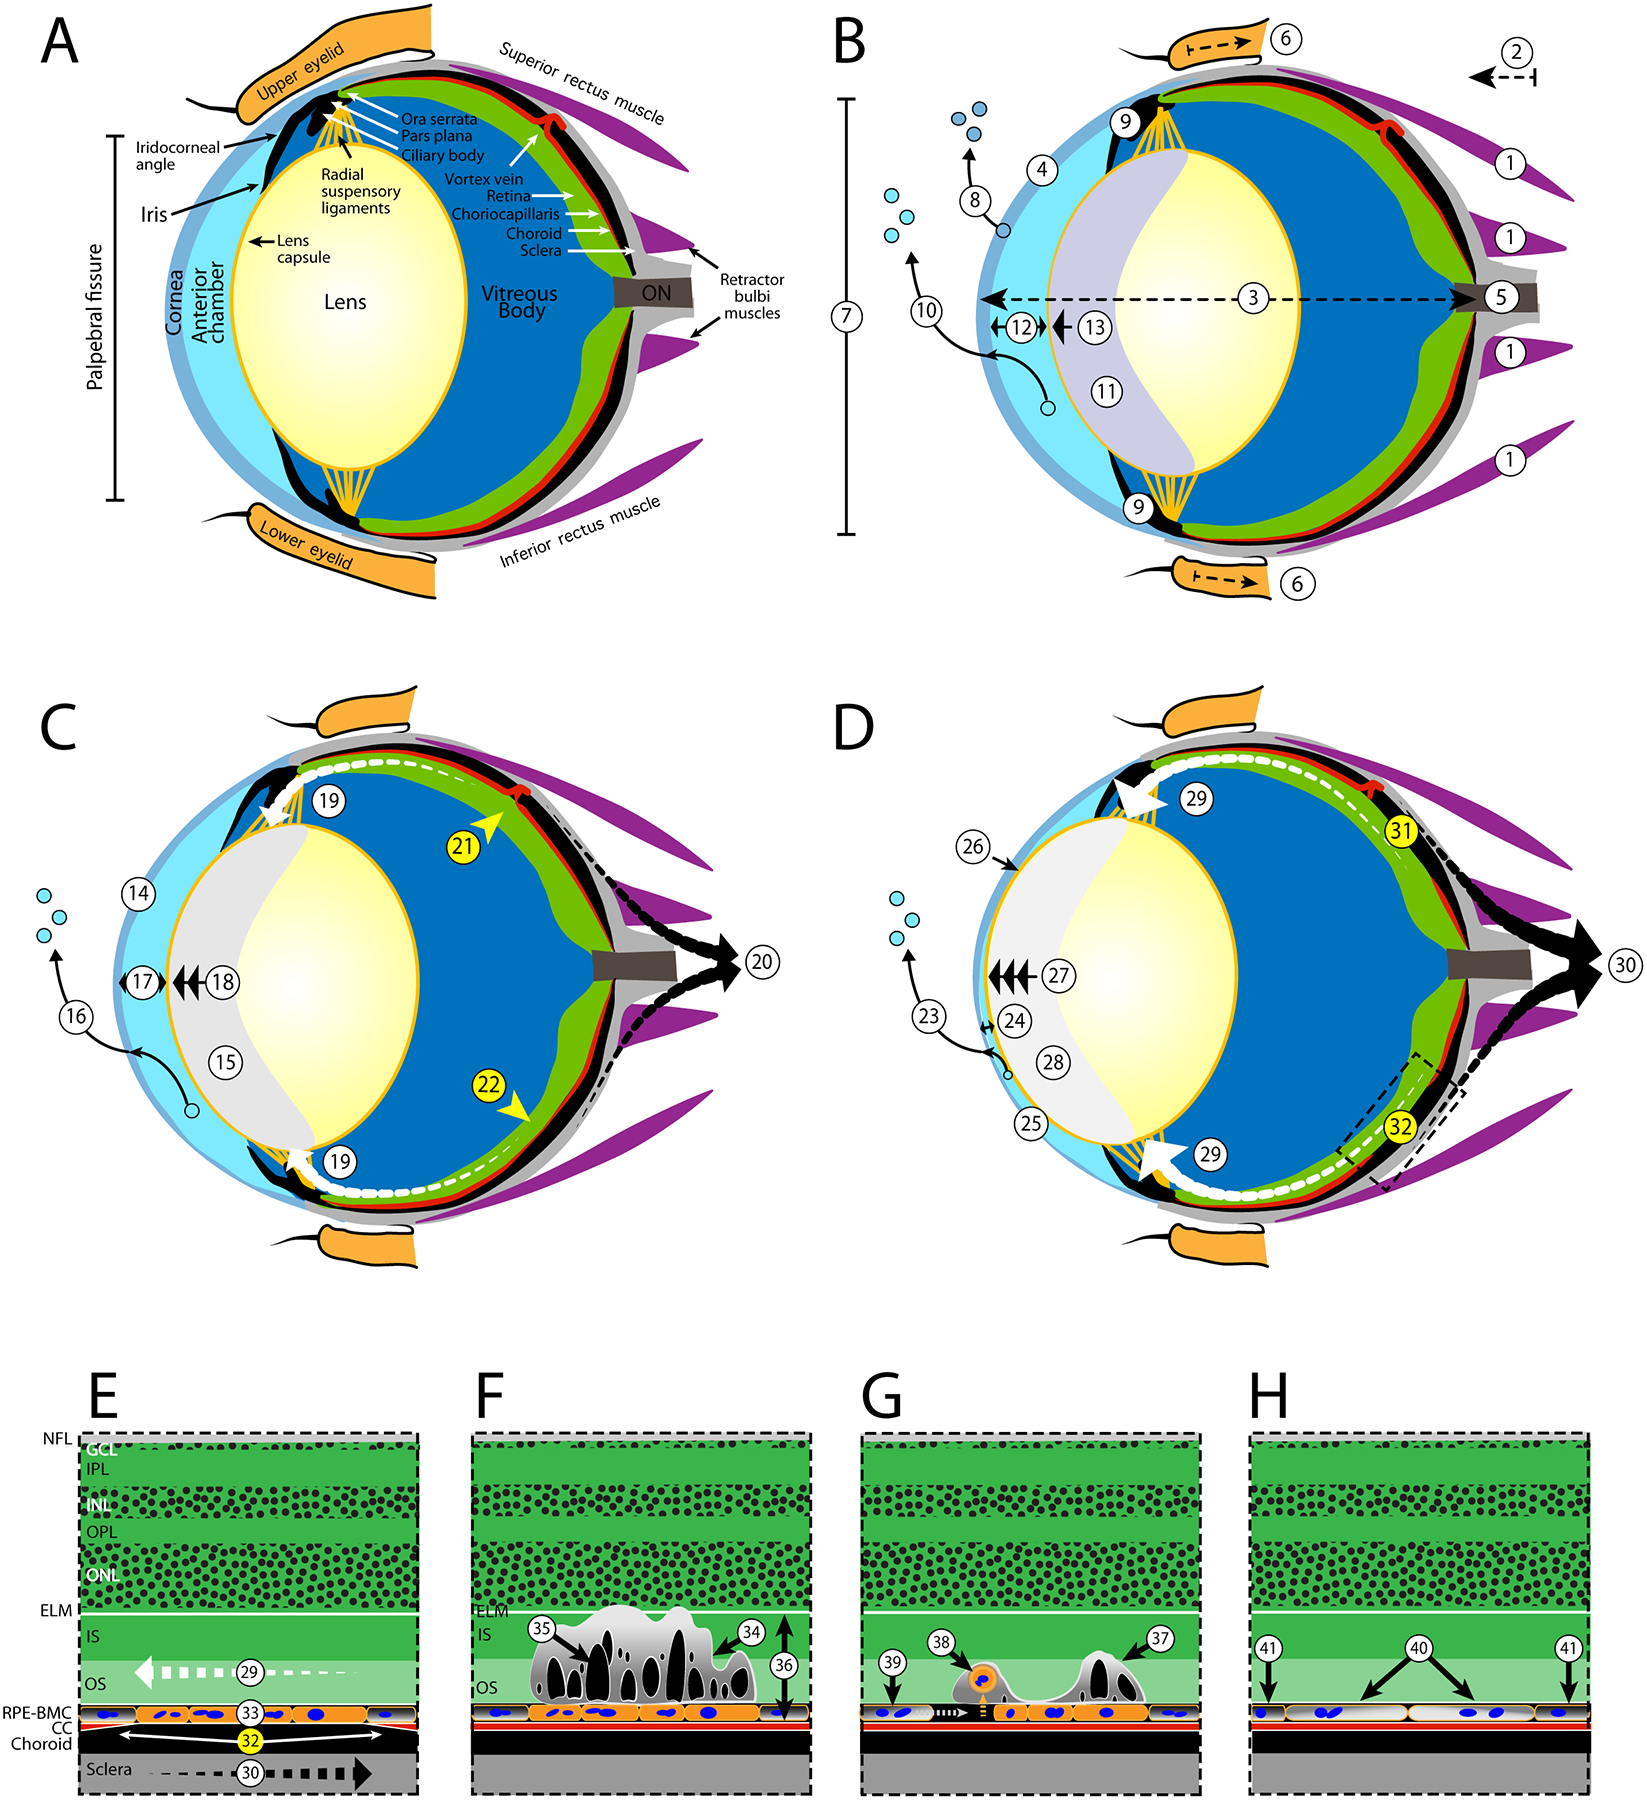
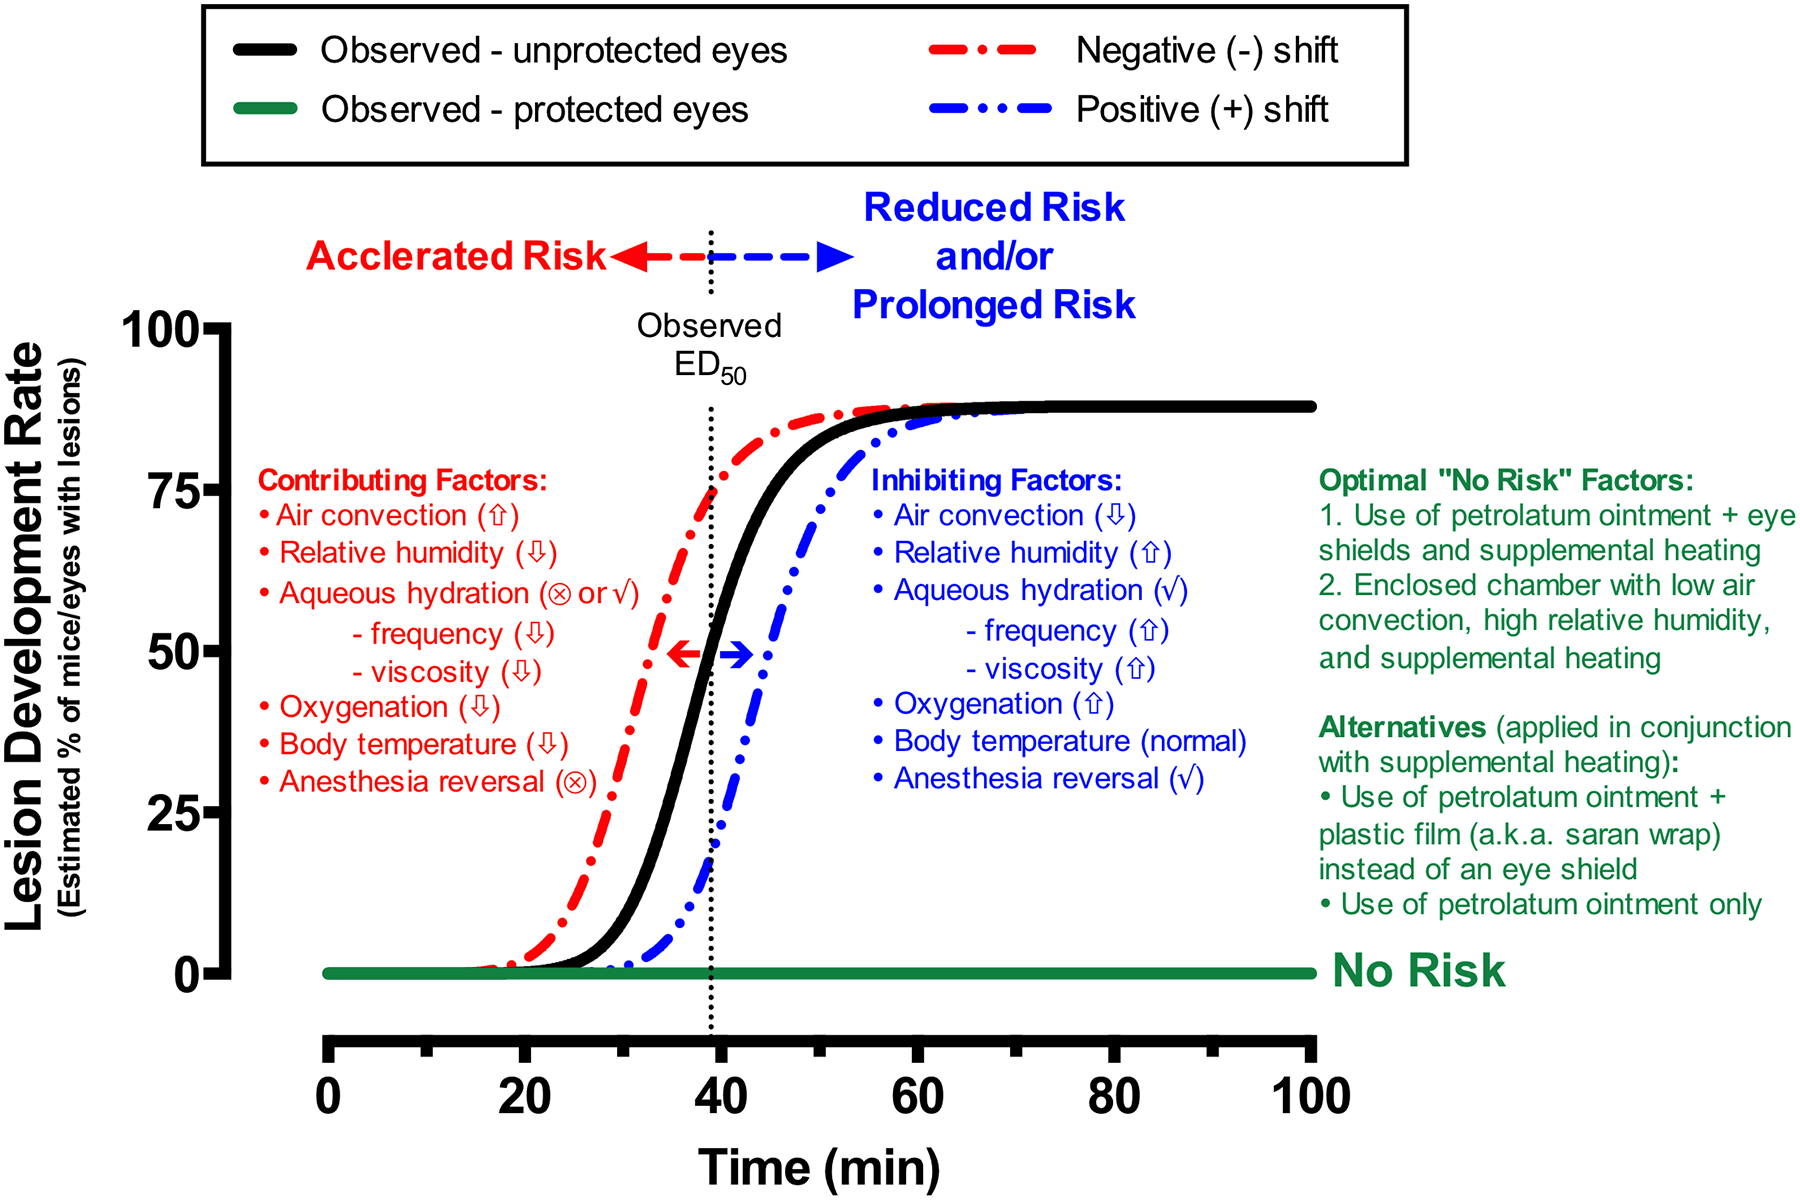
Retinal lesions in the posterior pole of laboratory mice occur due to native, developmental abnormalities or as a consequence of environmental or experimental conditions. In this study, we investigated the rate and extent of retinal lesions as a result of prolonged ocular exposure following general anesthesia. Following experimental preparation induction procedures (EPIP) involving general anesthesia, mydriasis/cycloplegia, and topical anesthesia to the cornea, two ocular recovery conditions (protected and unprotected) were tested within two different animal recovery chambers (open or closed). The anterior and posterior poles were evaluated for the development of retinal lesions using digital color photography, scanning laser ophthalmoscopy, and spectral-domain optical coherence during anesthesia recovery and up to 2.5 months thereafter. In some mice, electroretinograms, histological and immunohistological evaluations were performed to assess functional and structural changes that accompanied the retinal lesions detected by in vivo imaging. Our data suggests that prolonged ocular surface exposure to circulating ambient room air leads to significant anterior and posterior segment ocular complications. The most abundant, semi-reversible complication observed was the development of lesions in the outer retina, which had a 90% probability of occurring after 45 min of exposure. The lesions mostly resolved short-term, but functional and imaging evidence suggest that some perturbations to the outer retina may persist one or more months following initial development.

Keywords: Abnormality; Adrenergic agonist; Choriocapillaris; Imaging; Ischemia-reperfusion injury; Ketamine; Lesion; Mice; Outer segments; Phenylephrine; Photoreceptor; Retina; Retinal pigmented epithelium; Subretinal cyst; Vortex vein; Xylazine.


Figures

Fig. 1.
Fig. 1.. Uninterrupted Recovery Experiment Results.
(A & B) C57BL/6J and Tulp1+/+ mouse eyes that receive no form of ocular protection developed lens media opacities that could be visualized by the naked eye. Opacities were worse in the exposed (OS) eyes of mice recovered in the open (A) vs. closed (B) chamber at 1-hr post-EPIP. For the most part, these opacities resolved by 14-days post-recovery with exception to two instances of irreversibly damaged eyes that resulted in microphthalmia. Eyes that were covered with protective ointment and eye shields did not develop any significant lens media opacities regardless of whether the recovery chamber was open or closed. Arrows indicate the eyes with visible opacities. Note the distinctive difference in the media opacity appearance between mice recovered under high-humidity conditions vs. a typical room environment with lower humidity levels. (C) Experimental details and a summary table of the observations made for fundus imaging of C57BL/6J and Tulp1+/+ mice at 14-days post-EPIP. (D) Representative SLO images from a Tulp1+/+ mouse with retinal lesions using IR, IRDF, IRAF, BAF, and RFDF imaging modes. Yellow arrows indicate the margins of a retinal lesion observed 14-days post EPIP recovery. RFDF (D; yellow dotted-line w/arrows) image indicates the approximate location of the SD-OCT B-scan shown (E) that was collected through an SLO detected lesion. Dark spots in BAF-SLO image are indicative of the cysts found subsequently by SD-OCT imaging (E) and histology (F2 & G2−5). (F) Photomicrographs of one regular (F1) and three abnormal (F2−4) thin section histology examples collected from one unaffected and three individually or affected mice, respectively. F2 shows an enlarged cyst-like structure above the RPE that is mostly devoid of material with exception to several pigment granules. F3 shows a detached, nucleated cell filled with pigment. F4 shows clustered pigment (yellow arrows) and hypopigmented (black arrowheads) regions of RPE. Immunohistomicrographs of one regular (G1) and four abnormal (G2−5) examples collected from one unaffected and four individual affected mice, respectively (Blue-TOPRO-3, Green-GLUT1, & Orange-Rhodopsin). (G2−5) Subretinal cyst-like structures and disruptions to the photoreceptor outer segments and interface with the RPE are readily visible. Perturbations as large as 50 μm can be seen displacing photoreceptor inner and outer segment lamina in the vitreal direction. OCT/Histology Abbreviations: Nerve Fiber Layer (NFL), Ganglion Cell Layer (GCL), Inner Nuclear Layer (INL), Outer Nuclear Layer (ONL), Photoreceptor Outer Segments (POS), Retinal Pigment Epithelium (RPE), and Choroid (Ch).
Fig. 2.
Fig. 2.. Montaged fundus views and results from the interrupted exposure time point experiments.
The extent of the induced abnormalities at 3 days post-EPIP can be seen in three examples provided for each interruption time point (A). These examples represent 12 individual eyes from 6 Tulp1+/+ mice. Asterisks indicate the temporal region. No abnormalities are visible at 25 min whereas the number and size of the lesions can be seen increasing with more prolonged exposure duration. Lesion involvement overlays were created for each retina example that also included demarcating the location of the vortex veins, optic disk, and long posterior and superior ciliary arteries. Mean overlays of lesion involvement were created to identify lesion development hot spots related to retinal quadrant (B). As observed, lesions occur in various regions of the posterior pole and in particular, within specific lanes or zones within those regions. The orange ring shows the extent of FOV for the SLO 55° wide-field lens. Note that many lesions form outside this central retina FOV, which is reasonably conserved among commercially available color fundus, SLO and SD-OCT imaging instruments capable of imaging mice. (C) SD-OCT images from the horizontal meridian of the mouse (#4695-OS) from Fig. 2A IRDF-SLO example #3 @ 75 min Post-EPIP recovery time showing the prominent formation of large vacuoles or cyst-like structures within the photoreceptor layer.
Fig. 3. -
Fig. 3. -. Quantified Results from the Interrupted Experiments.
(A) Data obtained from the IRDF-SLO images shown in Fig. 2A of eyes that underwent interrupted recovery protection at 25, 45, 65, and 75 min post-EPIP. A stacked bar graph indicates eyes from Tulp1+/+ mice (n = 8) exhibiting lesions (columns) along with the numbers of individual lesions counted (number of stacked intracolumn bars; total # provided above column), the areas of each individual lesion (individual intracolumn bar height), and the collective areas of all individual lesions observed per eye (column height). Abbreviations: NLD-no lesions detected, IOD-irreversible ocular damage. (B) The mean total lesion area for affected eyes (mean ± SD.) fitted with an exponential growth curve (Adjusted R2 = 0.98). (C) Effective dose time-response curve generated from the proportion of eyes found with lesions and the estimated probability of retinal lesions. This trend underscores that eyes cannot be left unprotected for more than ½ hour before the risk of developing retinal lesions begin. Note that the curve is steep and shows that the mice transition from moderate (50%) to high risk (> 90%) within 10 min beyond the ½ hour exposure mark.
Fig. 4.
Fig. 4.. Long-term follow up of retinal lesions.
(A) Representative IRDF-SLO images of lesions in a C57Bl/6J mouse at 3-days post-EPIP, which are easily discernable from the standard RPE/choroidal background (n = 3)… The lesion is presented as a dark region that has resolved 14-days post-EPIP. At 14 and 28-days, subtle indicators (hyper- and hypo-reflective spots) persist that suggest some evidence of the lesion remains. By 45 and 80-days, the hyper- and hypo-reflective perturbations have resolved, and the region appears similar to the surrounding background. (B) Additional examples of the same lesion shown by IRDF (Fig. 4A) at 3-days post are also readily visible by three of the other SLO imaging modes (IR, RFDF, and BAF). This comparison helps to identify and isolate the region impacted by the lesion, which appears to be the outer retina and RPE. As a result of this observation, it is suggestive that the lesion remaining at 80 days post-EPIP is also altered RPE and this is further supported by the TEFI and FA-SLO images that follow. (C) Color fundus images showing a different spectral reflectance profile for the two visible lesions versus the surrounding background. (D) Sodium Fluorescein Angiography (FA-SLO) revealing leakage or abnormal uptake of the fluorophore at the RPE level whereas no evidence of leakage can be observed in the deep plexus of the retinal vasculature. The enhanced visualization of red reflectance and green fluorescence for the TEFI and FA-SLO images, respectively, could alternatively be due to hypo-pigmentation of the RPE as previously indicated in Fig. 1F4. These observations suggest that the damage remaining at this late stage is isolated to the RPE.
Fig. 5.
Fig. 5.. Anterior Segment SDOCT Imaging Examples and Quantified Results
Representative SDOCT images from the anterior segment of Tulp1+/+ mice (n = 8) recovered in the open (A) vs. closed (B) chambers. Eyes of mice that received ocular protection (OD-protected) exhibited no substantial adverse changes compared to eyes that were left unprotected (OS-protected). However, mice with unprotected eyes (OS-unprotected) and recovered in the closed chamber (B) only developed lens media opacities in contrast to mice with unprotected eyes (OS-unprotected) and recovered in the open chamber that (A) developed visibly apparent corneal thinning, lens media opacities and reduction in anterior segment depth. Quantitative results for exophthalmia (CD), corneal thickness (E-F), anterior chamber depth (GH) and lens media opacity (I-J) for the two ocular status and two recovery and conditions.
Fig. 6.
Fig. 6.. Rate of Change Comparisons
First derivatives taken of the fitted curve trends shown in Fig. 5 reveal the rate of change for exophthalmia, corneal thinning, anterior chamber depth collapse, and ocular lens media opacity development. These curves show the magnitude, direction, and rate of change associated with these metrics measured in vivo via anterior segment SD-OCT imaging. Note that the most prevalent changes occur in the unprotected left eyes (OS-unprotected) of mice that are recovered in the open chamber. Furthermore, anterior chamber depth is observed having the largest magnitude and most sustained rate of change during the 80 min of monitoring.
Fig. 7.
Fig. 7.. Changes in Ocular Appearance with Exposure Duration
(A) Three examples of media opacities observed in Tulp1+/+ from mouse eyes (n = 8) at 5, 25, 45, & 65 min post-EPIP. Qualitatively, it is easily observed that eyes immediately following EPIP have a charcoal black appearance and transition to a bluish-gray hue within 25 min. Past 25 min, eye opacities become brighter in appearance and proceed towards a neutral, grayish-white color. These visual, qualitative observations were quantified so that they could be shown graphically in CIE L*a*b* color space (C-E). (C) Brightness (L*) significantly increased with exposure duration. (D) Green-Red (a*) exhibited a small (~2–3 units), but significant shift from neutral to a green hue after 45 and 65 min. (E) Blue-Yellow (b*) experienced a slightly larger (5 units) and very significant shift (p < 0.0001) to blue at 25 min from the original neutral black color at 5 min. Moreover, at 45 & 65 min post-EPIP, the blue hue found at 25 min significantly returned to the original baseline value observed at 5 min. Color values obtained for the plots shown in C-E were used to generate a CIE Lab Space Color Rendition (B) to recreate the mean appearance of mice with ocular opacities artificially. In these examples, the mean CIE Lab values for the pupil are reported as L*, a*, b* values and displayed in a two-dimensional, en face view of the mouse eye including the surrounding iris and periorbital region. This example demonstrates that the reconstituted color values are similar to the in vivo digital color photographic observations and accurately replicate these changes. Retinal lesion impact area correlated moderately strong with ocular exposure duration, decreasing anterior chamber depth and opacity brightness. Thus, it would appear that opacity brightness is an excellent visual indicator of lesion development probability.
Fig. 8.
Fig. 8.. Etiology of Procedure Induced Retinal Lesions in Mice
Suspected processes leading to mechanically induced ischemia (A-D) and the latent development of outer retinal lesions (E-G) in a normal mouse eye. For ischemia development, the changes are divided into three periods (B-D) that describe early (< 20 min), mid (20–40 min), and late (40 + min) time frames. For lesions, the earliest record of their presence at 3-days post-EPIP is demonstrated (E). Lesions do substantially regress over time as depicted by 14- and 80-days post-recovery illustrations (FG). A. Normal eye - Schematic of a normal adult mouse eye, modified from Remtulla and Hallett (1985) and Tkatchenko et al., (2010), detailing the anatomical regions and features suspected to be impacted post-EPIP. Note: the vortex vein is shown in the incorrect anatomical position for purposes of demonstrating stenosis and pinch-occlusion in the mid and late time phases, respectively. B. Early phase - General anesthesia and mydriasis induction with xylazine and phenylephrine result in adrenergic agonist activation and systemic changes that include smooth muscle relaxation, vasoconstriction, decreased perfusion, hypoxia, hypercapnia, bradycardia, respiratory acidosis, hypothermia, etc. (changes not depicted). Immediately post-EPIP, extraocular muscles become relaxed (1), causing exophthalmia (2), globe elongation (3), modified corneal curvature (4), increased load on the optic nerve (5), retraction of the eyelids and cessation of blink reflex (6), widening of the palpebral fissure (7), and rapid depletion of corneal tear film (8). Aqueous humor production and outflow via the ciliary bodies and Schlemm’s canal are reduced (9) followed by transcorneal loss of aqueous humor (10) and development of lens media opacity that persists until full recovery from sedation (11). A reduction in aqueous humor volume results in decreasing anterior chamber depth (12) followed by migration of the ocular lens (13) into the chamber. Extraocular pupillary appearance observed at this time has a faint bluish-hue due to lens media opacity formation (11). C. Mid phase Asymptotic limits for corneal desiccation and thinning (14) are reached followed by lens media opacity magnitude, area and integrated density (15). Extraocular pupillary appearance transitions from bluish-gray to grayish-white due (15). Sustained loss of aqueous humor via transcorneal evaporation (16) leads to additional reductions in anterior chamber volume/depth (17) and lens prolapse (18). Lens prolapse applies tension on the radial suspensory ligaments, Ciliary bodies, Pars Plana, Ora Serrata and RPE-BMC (19). Opposing forces between the RPE-BMC (19-white arrows) and the choroid (20-black arrows) induce an inner vs. outer laminar strain and impede blood perfusion via mechanically-induced stenosis of the vortex veins (21) and choriocapillaris (22). Lesion development probability approaches 50% during the mid-phase period. D. Late phase - Prolonged desiccation to the exposed eye assures that retinal lesions and other ocular complications are imminent. Evaporative fluid loss continues to deplete aqueous humor volume (23), further decreasing anterior chamber depth (24), resulting in a misshapen cornea (25), occasionally causing lens misalignment and resulting in the risk of adhesion to the corneal endothelium (26). A 3-to 4-fold change in lens prolapse (27) gives the pupil a bright white appearance (28) and applies increasing tension on the radial suspensory ligaments, the Ciliary bodies, Pars Plana, Ora Serrata and RPE-BMC (29). Estimated probability (~51–95%) for lesion development occurs from 39 to 55 min post-EPIP as increasing shear occurs between RPE-BMC (29-segmented tapered white arrows) and the choroid (30- segmented tapered black arrows) increases severity of the ischemic regions (3132) that involve either pinch-occlusion of a vortex vein (31) or regional mechanical-induced stenosis of the choriocapillaris (32). E. Expanded FOV of Ischemia Affected Area - Opposing forces acting along the RPE-BMC (29) and choroid (30) mechanically collapse the choriocapillaris (32) causing an ischemic episode contributing to anaerobic stress to the RPE (33). Upon recovery from sedation, all various ocular systems aforementioned return to normal and the choriocapillaris undergoes reperfusion (not shown). Abbreviations: Nerve Fiber Layer (NFL), Ganglion Cell Layer (GCL), Inner Plexiform Layer (IPL), Inner Nuclear Layer (INL), Outer Plexiform Layer (OPL) Outer Nuclear Layer (ONL), External Limiting Membrane (ELM), Photoreceptor Inner (IS) and Outer Segments (OS), Retinal Pigment Epithelium & Bruch’s Membrane complex (RPE-BMC), and Choriocapillaris (CC). F. 3-Days Post-EPIP - Three days following recovery, prominent retinal lesions are viewable via fundus imaging and indicate areas that previously underwent ischemia-reperfusion injury post-EPIP. A cross-sectional view illustrates the characteristics of a lesion when observed at this time point using SD-OCT imaging. Lesions involve the IS and OS laminar structures of the photoreceptor layer and show some displacement of the ELM (34). Numerous subretinal cysts (35) are visible within the impacted lamina (34). RPE cells outside the ischemia-affected region are presumably normal (36), as outer retina lamina appear normal outside the affected regions. G. 14-Days Post-EPIP - Fourteen days following recovery, lesions show evidence of resolving and become more difficult to discern by fundus imaging. SD-OCT shows an area of involvement less pronounced than that observed at 3-days post-EPIP. However, a displaced photoreceptor layer containing sub-retinal features presents containing smaller and less numerous cysts (37). Histological evidence suggests that RPE cells encountered enough stress to become apoptotic and undergo detachment from Bruch’s membrane (38). Detached cells undergo phagocytosis (38) and removal followed by expansion of adjacent RPE cells to cover the exposed area (39). H. 80-Days Post-EPIP - Imaging evidence indicates that prominent outer retinal disruptions observed at 3-days post-EPIP are 99% resolved following 2.5 months of recovery. However, imaging data also suggest that the RPE remains compromised by the original insult and is morphologically different from adjacent, unaffected regions. Remaining or adjacent RPE cells, which underwent expansion to cover exposed areas of cell loss, exhibit altered melanosome or melanin granule pigment density (40) compared to normal RPE cells from unaffected regions (41) and suggest impaired melanogenesis or altered melanodistribution in RPE cells affected by the ischemia-reperfusion injury.
Fig. 9.
Fig. 9.. Variables and Risk Factors Influencing Lesion Development
Dose-response trends established for the development (black line sigmoid trend) or non-development (flat green line) of procedure-induced retinal lesions in this study. The rate at which the cascade of events shown to transpire in Fig. 8 can influence the chances of lesion development and will depend on many factors that can either accelerate (faster onset) or reduce, but also prolong (delayed onset), the risk of developing retinal lesions. Contributing and inhibiting factors listed can induce negative or positive shifts in the dose-response trend to either increase or decrease susceptibility to this cascade of events that can lead to ocular complications. In sum, protect the eye with a non-volatile, petrolatum-based agent and use an anesthesia-reversing agent, supplemental heat and oxygen if possible to minimize the local and systemic effects of experimental procedures involving general anesthesia, mydriasis induction, and extended post-procedure recovery from sedation. Sign key: High (up arrow), Low (down arrow), and provided (✓) or not provided (⊗).

Similar articles

Cited by

References

    1. Arras M, Autenried P, Rettich A, Spaeni D, Rulicke T, 2001. Optimization of intraperitoneal injection anesthesia in mice: drugs, dosages, adverse effects, and anesthesia depth. Comp. Med 51 (5), 443–456. - PubMed
    1. Bell BA, Kaul C, Bonilha VL, Rayborn ME, Shadrach K, Hollyfield JG, 2015. The BALB/c mouse: effect of standard vivarium lighting on retinal pathology during aging. Exp. Eye Res 135, 192–205. - PMC - PubMed
    1. Bell BA, Kaul C, Hollyfield JG, 2014. A protective eye shield for prevention of media opacities during small animal ocular imaging. Exp. Eye Res 127, 280–287. - PMC - PubMed
    1. Bell BA, Kaul C, Rayborn ME, Hollyfield JG, 2012. Baseline imaging reveals pre-existing retinal abnormalities in mice. Adv. Exp. Med. Biol 723, 459–469. - PubMed
    1. Bermudez MA, Vicente AF, Romero MC, Arcos MD, Abalo JM, Gonzalez F, 2011. Time course of cold cataract development in anesthetized mice. Curr. Eye Res 36 (3), 278–284. - PubMed

Publication types

MeSH terms