. 2019 Jun 7:16:721-732.
doi: 10.1016/j.omtn.2019.04.013. Epub 2019 Apr 22.

MicroRNA-1305 Inhibits the Stemness of LCSCs and Tumorigenesis by Repressing the UBE2T-Dependent Akt-Signaling Pathway

Affiliations

MicroRNA-1305 Inhibits the Stemness of LCSCs and Tumorigenesis by Repressing the UBE2T-Dependent Akt-Signaling Pathway

Xiaoyong Wei et al. Mol Ther Nucleic Acids. .

Abstract

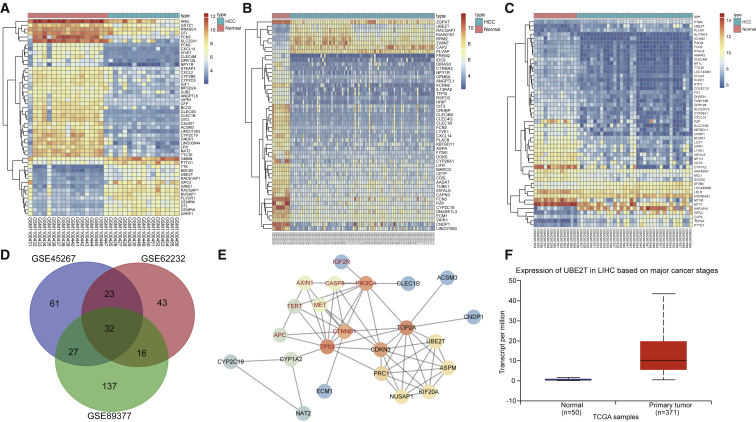
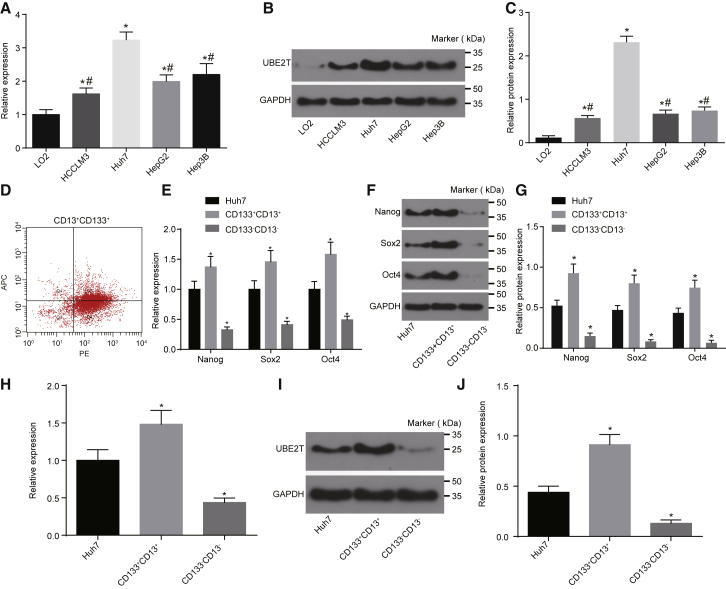
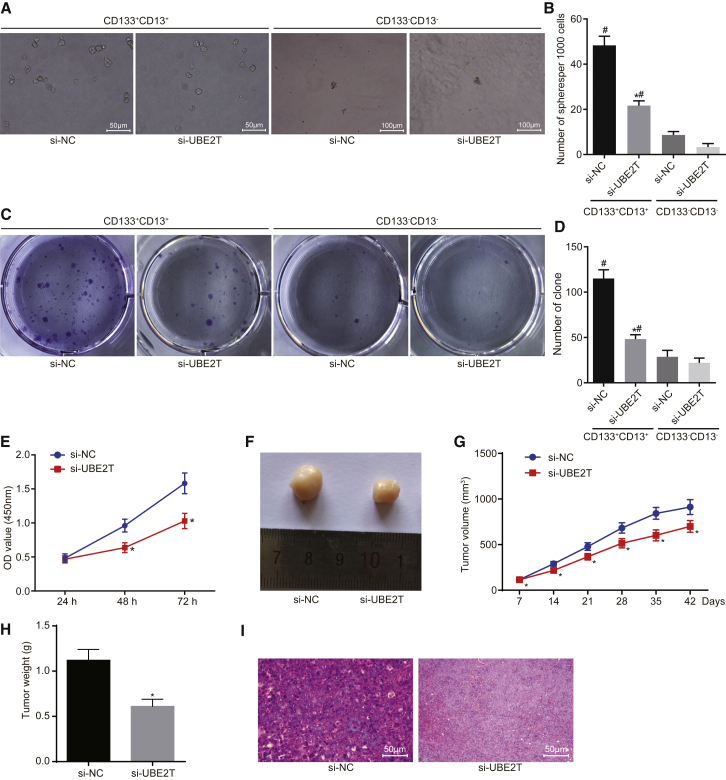
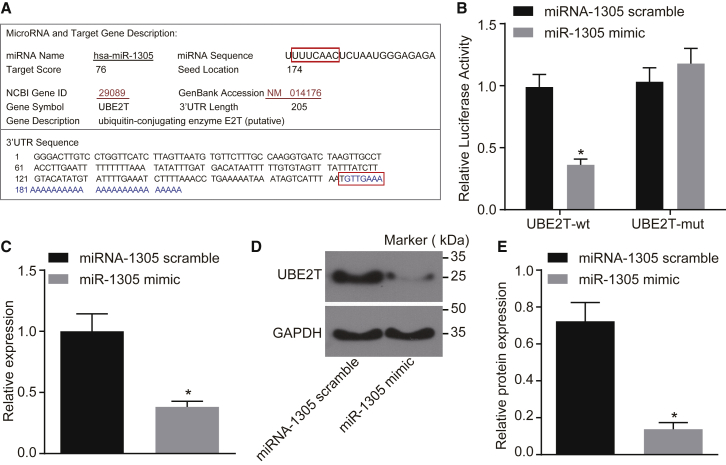
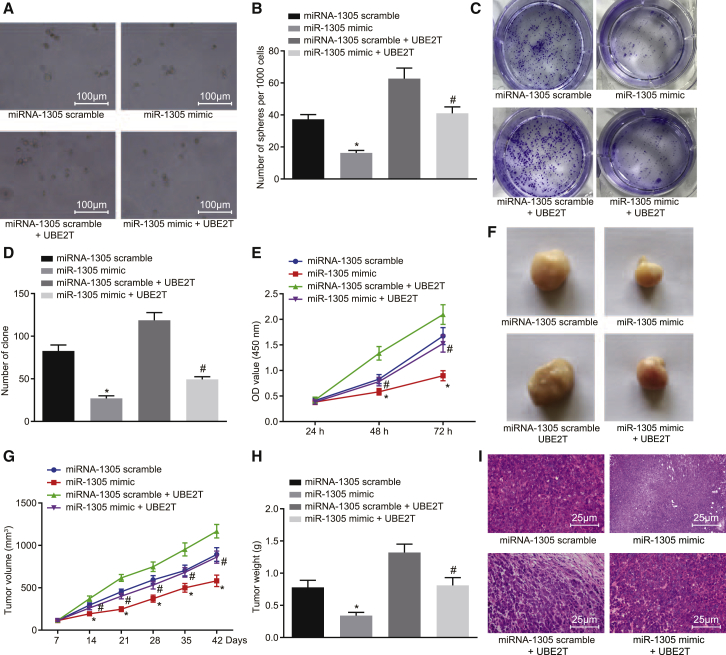
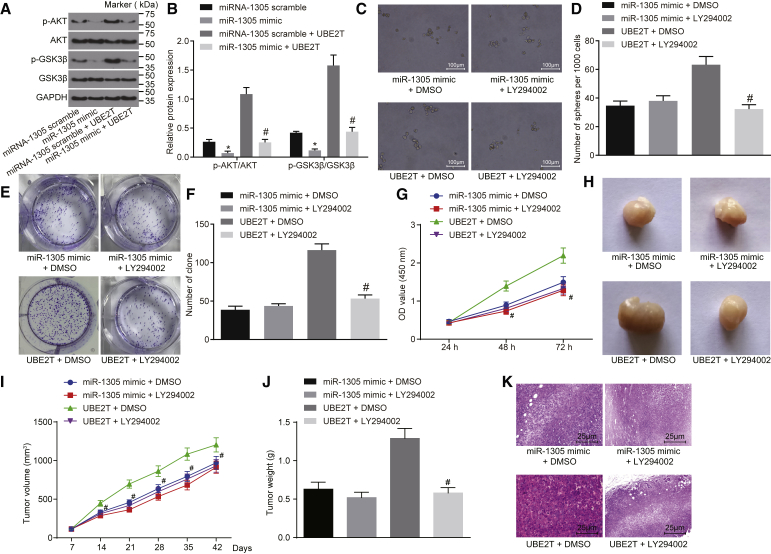
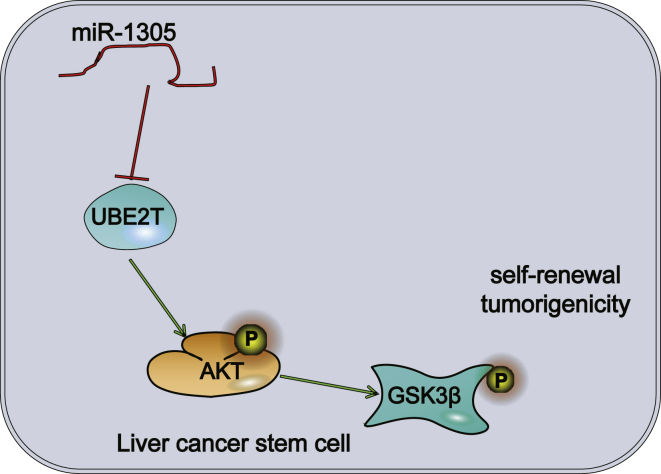
MicroRNAs (miRNAs) are involved in the maintenance of the cancer stem cell (CSC) phenotype by binding to genes and proteins that modulate cell proliferation and/or cell apoptosis. In our study, we aimed to investigate the role of miR-1305 in the proliferation and self-renewal of liver CSCs (LCSCs) via the ubiquitin-conjugating enzyme E2T (UBE2T)-mediated Akt-signaling pathway. Differentially expressed genes in human hepatocellular carcinoma (HCC) were obtained by in silico analysis. The relationship between miR-1305 and UBE2T was verified by dual luciferase reporter gene assay. qRT-PCR and western blot analysis were performed to determine the expression of UBE2T, the Akt-signaling pathway, and stemness-related factors in LCSCs. In addition, miR-1305 disrupted the activation of the Akt-signaling pathway by targeting UBE2T, and, ultimately, it repressed the sphere formation, colony formation, and proliferation, as well as tumorigenicity of LCSCs. In summary, miR-1305 targeted UBE2T to inhibit the Akt-signaling pathway, thereby suppressing the self-renewal and tumorigenicity of LCSCs. Those findings may provide an enhanced understanding of miR-1305 as a therapeutic target to limit the progression of LCSCs.

Keywords: Akt-signaling pathway; hepatocellular carcinoma; liver cancer stem cells; microRNA-1305; self-renewal; stemness; tumorigenicity; ubiquitin-conjugating enzyme E2T.


Figures

Figure 1
Figure 1
UBE2T Affected the Progression of HCC (A–C) Heatmaps of DEGs in GEO: GSE45267 (A), GSE62232 (B), and GSE89377 (C) microarrays (the abscissa indicates the sample number, the ordinate indicates the gene name, and the left dendrogram indicates gene expression cluster; each small square indicates the expression of one gene in one sample). (D) Venn analysis of DEGs in three HCC microarrays (the three circles represent the top 50 DEGs among the three microarrays, and the middle part indicates the intersection of the three microarrays). (E) The connection analysis between DEGs obtained from three microarrays and 10 known genes (each circle represents the expression of a gene in a sample, the red font represents a known gene in HCC retrieved from the database, the black font represents the DEGs obtained from microarray-based gene expression analysis, and the line between the two genes indicates there was an interaction between the two genes). (F) The expression of UBE2T in the HCC databases of TCGA was analyzed (the horizontal coordinate indicates the sample type, the vertical coordinate represents the expression of UBE2T, the left boxplot represents the expression of UBE2T in the normal sample, and the right boxplot represents the expression of UBE2T in the HCC samples).
Figure 2
Figure 2
UBE2T Was Highly Expressed in LCSCs (A) The mRNA expression of UBE2T in the HCC cell line and normal hepatic epithelial cell line determined by qRT-PCR. (B) The gray value of the UBE2T protein band in the HCC cell line and normal hepatic epithelial cell line. (C) The protein expression of UBE2T in the HCC cell line and normal hepatic epithelial cell line, determined by western blot analysis. (D) LCSCs sorted in the Huh7 cells by flow cytometry. (E) The mRNA expression of Nanog, Sox2, and Oct4 in Huh7 cells, CD13+CD133+ cells, and CD13CD133 cells, measured by qRT-PCR. (F) The gray value of Nanog, Sox2, and Oct4 protein bands in Huh7 cells, CD13+CD133+ cells, and CD13CD133 cells measured by western blot analysis. (G) The protein expression of Nanog, Sox2, and Oct4 in Huh7 cells, CD13+CD133+ cells, and CD13CD133 cells, measured by western blot analysis. (H) The mRNA expression of UBE2T in Huh7 cells, CD13+CD133+ cells, and CD13CD133 cells, determined by qRT-PCR. (I) The gray value of UBE2T protein band in Huh7 cells, CD13+CD133+ cells and CD13CD133 cells determined by western blot analysis. (J) The protein expression of UBE2T in Huh7 cells, CD13+CD133+ cells, and CD13CD133 cells, determined by western blot analysis. *p < 0.05 versus the LO2 cells; #p < 0.05 versus the Huh7 cells. Statistical data were described as mean ± SD and was compared using one-way ANOVA. The experiment was repeated 3 times, independently.
Figure 3
Figure 3
UBE2T Promoted the Tumorigenic Potential of LCSCs (A) Sphere formation ability of LCSCs in the presence of UBE2T silencing (200×). (B) The number of newly formed spheres. (C) Colony formation ability of LCSCs in the presence of UBE2T silencing, determined by soft agar colony formation assay. (D) The number of newly formed colonies. (E) The proliferative ability of LCSCs transfected with UBE2T silencing, assessed by CCK-8 assay. (F) Observation of tumors in nude mice. (G) The tumor volume in nude mice injected with UBE2T silencing-transfected LCSCs, measured by Vernier caliper. (H) The tumor weight in nude mice injected with UBE2T silencing-transfected LCSCs. (I) The pathological characteristics of tumor tissues in nude mice observed by H&E staining (400×). si-NC group, LCSCs transfected with si-NC or nude mice inoculated with si-NC-transfected LCSCs; si-UBE2T mimic group, LCSCs transfected with UBE2T silencing or nude mice treated with UBE2T silencing-transfected LCSCs. *p < 0.05 versus LCSCs transfected with si-NC or nude mice inoculated with si-NC-transfected LCSCs; #p < 0.05 versus CD13CD133 cells. Statistical data were described as mean ± SD. Data between two groups were analyzed by unpaired t test, and data in (E) and (G) were compared by repeated-measures ANOVA. The experiment was repeated 3 times independently (n = 6).
Figure 4
Figure 4
UBE2T Was a Target Gene of miR-1305 (A) The predictive binding site between miR-1305 and UBE2T 3′ UTR. (B) Dual luciferase reporter gene assay for confirmation of the targeting relationship between miR-1305 and UBE2T. (C) The mRNA expression of UBE2T in the presence of miR-1305 mimic, determined by qRT-PCR. (D) The gray value of the UBE2T protein band in the presence of miR-1305 mimic determined by western blot analysis. (E) The protein expression of UBE2T in the presence of miR-1305 mimic, determined by western blot analysis. miR-1305 scramble group, LCSCs transfected with scramble miR-1305; miR-1305 mimic group, LCSCs transfected with miR-1305 mimic. *p < 0.05 versus LCSCs transfected with scramble miR-1305. Statistical data were described as mean ± SD. Data between two groups were analyzed by unpaired t test. The experiment was repeated 3 times independently.
Figure 5
Figure 5
Upregulated miR-1305 Reduced LCSC Self-Renewal, Tumorigenesis, and Tumor Growth by Downregulating UBE2T (A) The sphere formation of LCSCs transfected with miR-1305 mimic with or without UBE2T (100×). (B) The quantitative analysis of (A). (C) The colony formation of LCSCs transfected with miR-1305 mimic with or without UBE2T. (D) The quantitative analysis of colony formation ability in (C). (E) The proliferative ability of LCSCs transfected with miR-1305 mimic with or without UBE2T, assessed by CCK-8 assay. (F) The observation of tumors in nude mice. (G) The tumor volume in nude mice injected with miR-1305 mimic-transfected or miR-1305 mimic + UBE2T-co-transfected LCSCs measured by Vernier caliper. (H) The tumor weight in nude mice injected with miR-1305 mimic-transfected or miR-1305 mimic + UBE2T-co-transfected LCSCs. (I) The pathological characteristics of tumor tissues in nude mice observed by H&E staining (400×). miR-1305 scramble group, LCSCs transfected with miR-1305 scramble or nude mice inoculated with miR-1305 scramble-transfected LCSCs; miR-1305 mimic group, LCSCs transfected with miR-1305 mimic or nude mice treated with miR-1305 mimic-transfected LCSCs; miR-1305 scramble + UBE2T group, LCSCs co-transfected with miR-1305 scramble and UBE2T or nude mice inoculated with co-transfected LCSCs; miR-1305 scramble + UBE2T group, LCSCs co-transfected with miR-1305 mimic and miR-1305 scramble or nude mice inoculated with co-transfected LCSCs. *p < 0.05 versus LCSCs transfected with miR-1305 scramble or nude mice inoculated with or miR-1305 scramble-transfected LCSCs; #p < 0.05 versus LCSCs co-transfected with miR-1305 scramble and UBE2T or nude mice inoculated with co-transfected LCSCs. Statistical data were described as mean ± SD. Data were analyzed by one-way ANOVA, and data in (E) and (G) were compared by repeated-measures ANOVA. The experiment was repeated 3 times independently (n = 6).
Figure 6
Figure 6
Self-Renewal and Tumorigenic Potential of LCSCs Were Repressed by miR-1305 through the UBE2T-Mediated Akt-Signaling Pathway (A) The gray value of Akt and GSK3β and their phosphorylation protein bands in LCSCs measured by western blot analysis. (B) The protein expressions of Akt and GSK3β and the extents of their phosphorylation in LCSCs, measured by western blot analysis. (C) The sphere formation assay in LCSCs treated with DMSO or LY294002 in the presence of miR-1305 mimic or UBE2T over-expression (100×). (D) The quantitative analysis of sphere formation ability in (C). (E) The soft agar colony formation assay in LCSCs treated with DMSO or LY294002 in the presence of miR-1305 mimic or UBE2T over-expression. (F) The quantitative analysis of soft agar colony formation in (E). (G) The proliferative ability of LCSCs that overexpressed miR-1305 or UBE2T and were treated with DMSO or LY294002, evaluated by CCK-8 assay. (H) Naked eye observation of tumor in nude mice treated with DMSO or LY294002 in the presence of miR-1305 mimic or UBE2T overexpression. (I) The tumor volume curve in nude mice treated with DMSO or LY294002 in the presence of miR-1305 mimic or UBE2T overexpression, measured by a Vernier caliper. (J) The tumor weight in nude mice in the presence of miR-1305 mimic or UBE2T overexpression with DMSO or LY294002 treatment. (K) The pathological characteristics of tumor in nude mice injected with miR-1305 mimic or UBE2T overexpression with DMSO or LY294002 treatment, observed with H&E staining (400×). miR-1305 scramble + DMSO group, LCSCs or nude mice transfected with miR-1305 mimic, then treated with DMSO; miR-1305 mimic + LY294002 group, LCSCs or nude mice transfected with miR-1305 mimic, then treated with LY294002; UBE2T + DMSO group, LCSCs or nude mice transfected with UBE2T overexpression, then treated with DMSO; UBE2T + LY294002 group, LCSCs or nude mice transfected with UBE2T overexpression, then treated with LY294002. *p < 0.05 versus LCSCs or nude mice transfected with miR-1305 mimic, then treated with DMSO; #p < 0.05 versus LCSCs or nude mice transfected with UBE2T overexpression, then treated with DMSO. Statistical data were described as mean ± SD. Data were analyzed by one-way ANOVA, and data in (G) and (I) were compared by repeated-measures ANOVA. The experiment was repeated 3 times independently (n = 6).
Figure 7
Figure 7
The Regulatory Mechanism of miR-1305 in the Self-Renewal and Proliferation of LCSCs miR-1305 can downregulate the Akt-signaling pathway mediated by UBE2T, thus inhibiting the proliferation, colony formation, sphere formation, and tumorigenic potential of LCSCs.

Similar articles

Cited by

References

    1. Tang H., Jin Y., Jin S., Tan Z., Peng Z., Kuang Y. Arsenite inhibits the function of CD133+ CD13+ liver cancer stem cells by reducing PML and Oct4 protein expression. Tumour Biol. 2016;37:14103–14115. - PubMed
    2. Tang, H., Jin, Y., Jin, S., Tan, Z., Peng, Z., and Kuang, Y. (2016). Arsenite inhibits the function of CD133+ CD13+ liver cancer stem cells by reducing PML and Oct4 protein expression. Tumour Biol. 37, 14103-14115. - PubMed
    1. Chen W., Zheng R., Baade P.D., Zhang S., Zeng H., Bray F., Jemal A., Yu X.Q., He J. Cancer statistics in China, 2015. CA Cancer J. Clin. 2016;66:115–132. - PubMed
    2. Chen, W., Zheng, R., Baade, P.D., Zhang, S., Zeng, H., Bray, F., Jemal, A., Yu, X.Q., and He, J. (2016). Cancer statistics in China, 2015. CA Cancer J. Clin. 66, 115-132. - PubMed
    1. Ferlay J., Soerjomataram I., Dikshit R., Eser S., Mathers C., Rebelo M., Parkin D.M., Forman D., Bray F. Cancer incidence and mortality worldwide: sources, methods and major patterns in GLOBOCAN 2012. Int. J. Cancer. 2015;136:E359–E386. - PubMed
    2. Ferlay, J., Soerjomataram, I., Dikshit, R., Eser, S., Mathers, C., Rebelo, M., Parkin, D.M., Forman, D., and Bray, F. (2015). Cancer incidence and mortality worldwide: sources, methods and major patterns in GLOBOCAN 2012. Int. J. Cancer 136, E359-E386. - PubMed
    1. Fong Z.V., Tanabe K.K. The clinical management of hepatocellular carcinoma in the United States, Europe, and Asia: a comprehensive and evidence-based comparison and review. Cancer. 2014;120:2824–2838. - PubMed
    2. Fong, Z.V., and Tanabe, K.K. (2014). The clinical management of hepatocellular carcinoma in the United States, Europe, and Asia: a comprehensive and evidence-based comparison and review. Cancer 120, 2824-2838. - PubMed
    1. Chen Y., Yu D., Zhang H., He H., Zhang C., Zhao W., Shao R.G. CD133(+)EpCAM(+) phenotype possesses more characteristics of tumor initiating cells in hepatocellular carcinoma Huh7 cells. Int. J. Biol. Sci. 2012;8:992–1004. - PMC - PubMed
    2. Chen, Y., Yu, D., Zhang, H., He, H., Zhang, C., Zhao, W., and Shao, R.G. (2012). CD133(+)EpCAM(+) phenotype possesses more characteristics of tumor initiating cells in hepatocellular carcinoma Huh7 cells. Int. J. Biol. Sci. 8, 992-1004. - PMC - PubMed