Review
. 2019 Oct:59:130-140.
doi: 10.1016/j.copbio.2019.03.016. Epub 2019 May 23.

Synthetic development: building mammalian multicellular structures with artificial genetic programs

Affiliations
Review

Synthetic development: building mammalian multicellular structures with artificial genetic programs

Marco Santorelli et al. Curr Opin Biotechnol. 2019 Oct.

Abstract

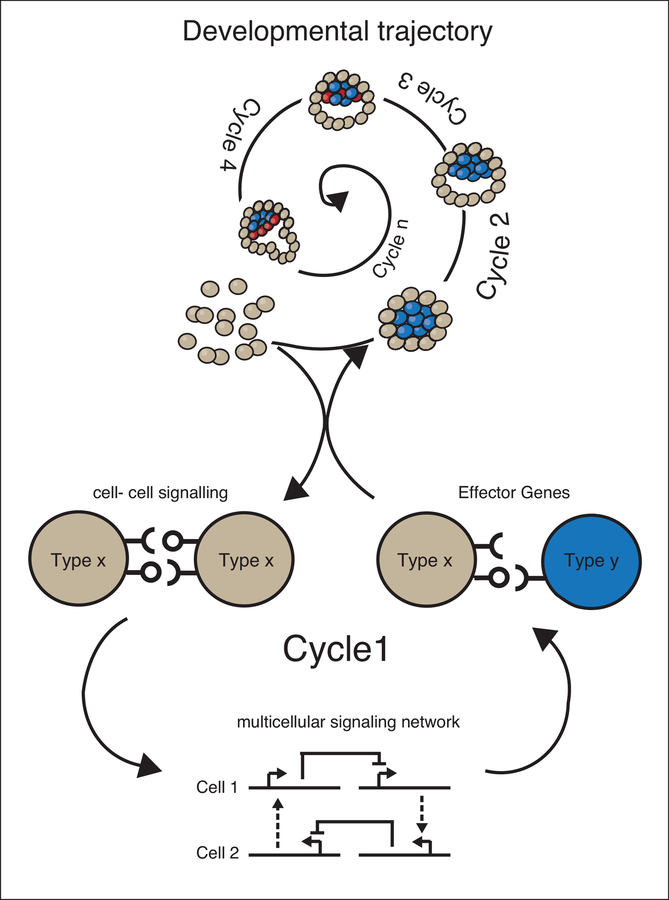
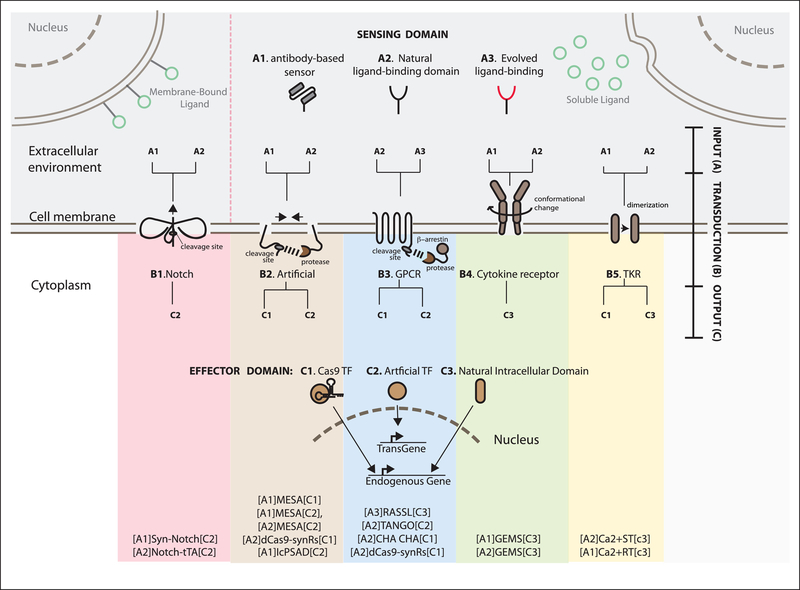
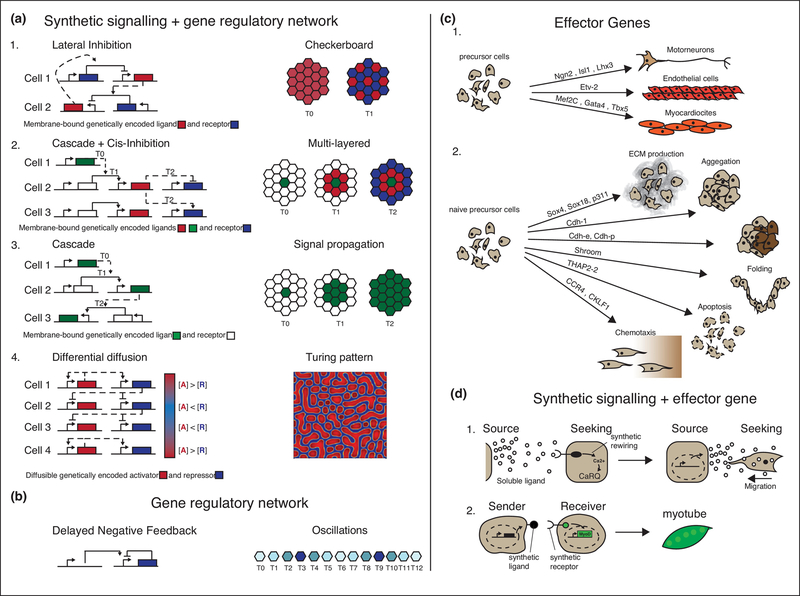
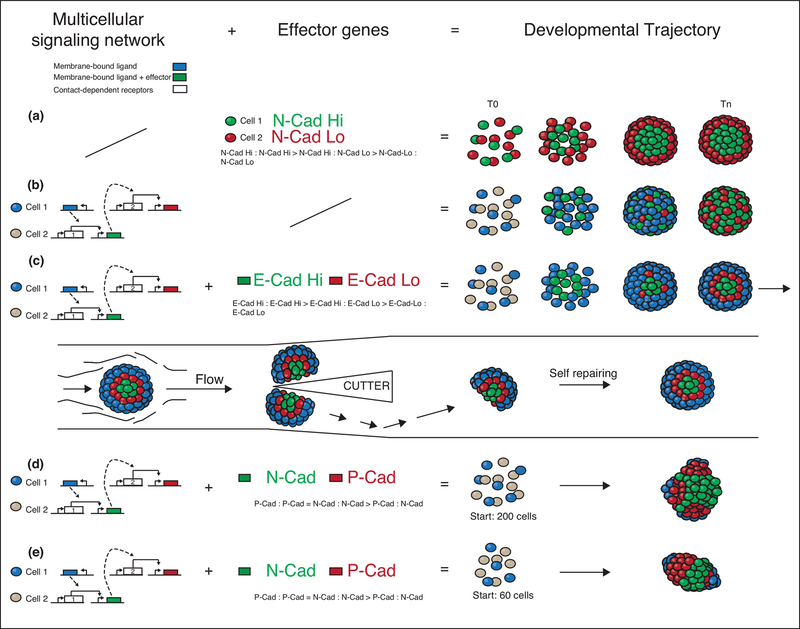
Synthetic biology efforts began in simple single-cell systems, which were relatively easy to manipulate genetically (Cameron et al., 2014). The field grew exponentially in the last two decades, and one of the latest frontiers are synthetic developmental programs for multicellular mammalian systems (Black et al., 2017; Wieland and Fussenegger, 2012) to genetically control features such as patterning or morphogenesis. These programs rely on engineered cell-cell communications, multicellular gene regulatory networks and effector genes. Here, we contextualize the first of these synthetic developmental programs, examine molecular and computational tools that can be used to generate next generation versions, and present the general logic that underpins these approaches. These advances are exciting as they represent a novel way to address both control and understanding in the field of developmental biology and tissue development (Elowitz and Lim, 2010; Velazquez et al., 2018; White et al., 2018; Morsut, 2017). This field is just at the beginning, and it promises to be of major interest in the upcoming years of biomedical research.


Figures

Figure 1 –
Figure 1 –. Deconstruction of developmental trajectory into cycles and molecular implementations.
The spiral represents the developmental trajectory unfolding over time through a series of cycles (Cycle 1, Cycle 2, etc.). Each cycle is driven by the underlying genetic program made of: 1) cell-cell signaling, 2) multicellular networks that generate patterns, 3) and changes in cells’ physical and/or biological properties by changing expression of one or more effector genes. The new signaling, biological, and physical status of the multicellular system defines the new starting conditions for a new cycle.
Figure 2 –
Figure 2 –. Mapping existing synthetic receptor systems based on their input, transduction and output characteristics.
A schematic of various synthetic receptors that process information from the extracellular space (top), to inside the cell (bottom). Sensing domains are classified as antibody-based (A1), based on natural ligand binding domains (A2), or generated via directed evolution (A3). Effector domains are natural (C3) if endogenous domains are used. For transcriptional outputs, we distinguish artificial transcription factors like Gal4 or tTA that activate exogenous expression cassettes (transgene) (C2), or dCas9-based transcription factors that activate endogenous targets (C3). Each sensor and effector domain can be mounted onto a part of the receptor protein that executes the transduction (B). B1 is contact dependent, i.e. is activated only via membrane-bound ligand (green circles presented on a neighboring cell in the upper left corner). B2–5 all recognize ligands that are soluble in the extracellular environment (green circles secreted from other cells in the upper right corner). At the far bottom, we list the synthetic receptor systems that have been implemented to date using alphanumeric codes according to the notation introduced in the text of [input]transduction[output]. For example, [A1]synNotch[C2] represents the synthetic receptor that uses an antibody-based sensor as input (A1), and activates an artificial transcription factor as output (C2), and so on. The works that describe in the details those receptors are in the references below and in the text. SynNotch = Synthetic Notch; MESA = Modular Extracellular Sensor Architecture,,; IcPSAD = Intracellular protein sensor actuator device; GEMS = generalized extracellular molecule sensor; RASSL = Receptor activated solely by synthetic ligand; Tango; ChaCha; dCas9 synRs = dCas9 synthetic receptor; Ca2+ST = calcium sensing-rewiring tool; Ca2+RT = calcium rewiring tool,; GPCR = G-protein coupled receptor; TKR= tyrosine kinase receptor.
Figure 3 –
Figure 3 –. Multicellular signaling networks and effector genes can drive patterning of different cell states and biophysical changes.
(a-b) Examples of spatial and temporal patterning guided by multicellular synthetic gene regulatory networks implemented in mammalian cells. The gene regulatory networks are presented on the left-hand side; on the right hand side are the corresponding cellular patterns. The gene regulatory networks are represented as blocks-and-arrows schemes: the solid arrows are the regulatory links of the intracellular network, acting in the same cell; the dashed arrows are the intercellularly regulatory links between two cells. (a.1) Representation of network scheme and resulting checkerboard pattern generated using a single cell population expressing NOTCH receptor (blue), repressing its own ligand DELTA (red); this network was implemented in 2D in CHO cells. (a.2) Representation of network scheme and resulting multi-layered pattern generated using two distinct cell lines, where cell type 1 expresses a constitutively active green fluorescent protein (GFP) ligand (green) and cells 2–3 express a [GFP]synNotch[tTA→CD19 ligand], a [CD19]synNotch[tTA→BlueFluorescentProtein] (blue) and an mCherry reporter (red). When co-cultured, cell type 1 acts as a nucleation center for a signal cascade where cells 2 that are in contact with cells 1 fluoresce red and create a secondary ligand, which then signals to neighboring cells 3 to fluoresce blue. This network was implemented in 2D in MDCK cells. (a.3) Representation of network scheme and resulting signal propagation pattern generated using two distinct cell lines, where cell 1 constitutively expresses the NOTCH ligand DELTA (green) and cells 2–3 express the synthetic modular receptor [DELTA]NOTCH[tTA→DELTA]. When co-cultured, cell 1 triggers signal propagation in neighboring cells 2–3. This network was implemented using MDCK cells as cell 1 and CHO cells as cells 2–3. (a.4) Network scheme and resulting Turing pattern obtained by using two different genetically encoded signaling molecules characterized by differential diffusion properties: Nodal the short range network activator (red) and Lefty the long range network inhibitor (blue). The network was implemented in 2D in 293AD Cells. (b) In the oscillation program a desynchronized temporal pattering was generated in a cell population using the transcriptional repressor Hes1 (blue) that is able to repress its own expression after a delay encoded by its introns. This network was implemented in 2D in CHO cells and 3T3 mouse fibroblasts,. (c) Examples of effector genes driving physical (1.) or biological (2.) differentiation when overexpressed. (c1.) Examples of effector genes that, when exogenously overexpressed, induce cell differentiation into motoneurons from human induced pluripotent stem cells, endothelial cells from a lung fibroblast cell line, and cardiomyocytes from a fibroblast cell line. (c.2) Examples of effector genes changing selected cells physical properties: production of type II collagen proteins was achieved in adipose stem cells by overexpression of the Sox trio (Sox5, Sox6 and Sox9). The rest of the figure c2 is an adaptation from,. (d) Examples of effector genes induced by synthetic signaling pathways. (d.1) Soluble ligand CD14, released by source cells (HEK293), activates [sCD14]Ca2+RT[CaRQ→migration] on the membrane of seeking cells (HEK293) causing intracellular Ca2+ release from the endoplasmic reticulum. In the receiver cells, Calcium signaling is rewired via CaRQ to trigger migration towards the source cell18. (d.2) CD19 ligand exposed on the membrane of a sender cell activates a [CD19]synNotch[tTA→myoD]receptor that drives Myo-D expression: overexpression of myoD in turn drives myoblast differentiation from embryonic fibroblasts.
Figure 4 –
Figure 4 –. Engineered synthetic developmental trajectories in multicellular fibroblast spheroids.
The combination of multicellular signaling network driving effector genes are shown on the left hand side; the resulting developmental trajectories are shown on the right. The multicellular regulatory network (dashed arrows represent the intercellular signaling, solid arrows the intracellular signaling) (left most column), downstream effector genes (central column) and the corresponding developmental trajectory (right column) for each genetic program are shown. (a) No regulatory network is present, N-cad is constitutively expressed at high level in the green cells and at low levels in the red cell line, generating a 2-layered structure. (b) The regulatory network based on synNotch signaling drives the expression of fluorescent proteins (no effector genes). The blue cell line activates the gray cell line turning it green, the green cell line then activates the blue cell line turning it red. (c) The regulatory network is the same as in (b), but it now drives expression of effector genes as well: high levels of E-cadherin (E-cad) in green cells and low levels of E-cad in red cells. The differences in the expression levels of E-Cad (null in blue cells, low in red cells, and high in green cells) generated in a temporally controlled fashion cause spatial rearrangements and cell sorting into a three-layered structure. The three-layer structure is able to self-repair after cleavage (c, second row). (d-e) The same regulatory network as in (b) drives the expression of N-Cadherin (N-cad) (green) and P-Cadherin (P-cad) (red), generating (d) multiple poles (initial co-culture conditions of 200 cells) or (e) a single pole (initial co-culture conditions of 60 cells) .

References

    1. Cameron DE, Bashor CJ & Collins JJ A brief history of synthetic biology. Nature Reviews Microbiology 12, 381–390 (2014). - PubMed
    1. Black JB, Perez-Pinera P & Gersbach CA Mammalian Synthetic Biology: Engineering Biological Systems. Annu. Rev. Biomed. Eng (2017). doi:10.1146/annurev-bioeng-071516-044649 - DOI - PubMed
    1. Wieland M & Fussenegger M Engineering Molecular Circuits Using Synthetic Biology in Mammalian Cells. Annu. Rev. Chem. Biomol. Eng 3, 209–234 (2012). - PubMed
    1. Elowitz M & Lim WA Build life to understand it. Nature (2010). doi:10.1038/468889a - DOI - PMC - PubMed
    1. Velazquez JJ, Su E, Cahan P & Ebrahimkhani MR Programming Morphogenesis through Systems and Synthetic Biology. Trends Biotechnol 36, 415–429 (2018). - PMC - PubMed

Publication types