. 2019 Jul;21(7):689-701.
doi: 10.1016/j.neo.2019.04.002. Epub 2019 May 23.

Telomere Trimming and DNA Damage as Signatures of High Risk Neuroblastoma

Affiliations

Telomere Trimming and DNA Damage as Signatures of High Risk Neuroblastoma

Eun Young Yu et al. Neoplasia. 2019 Jul.

Abstract

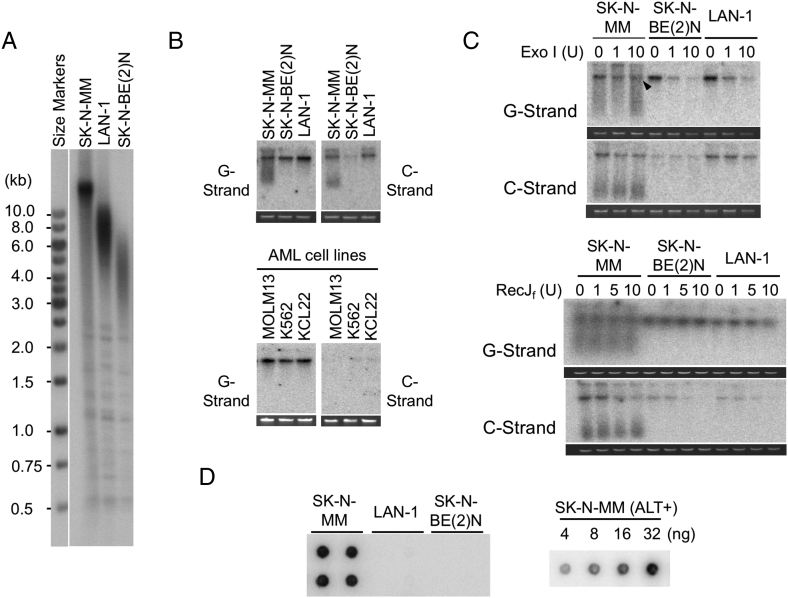
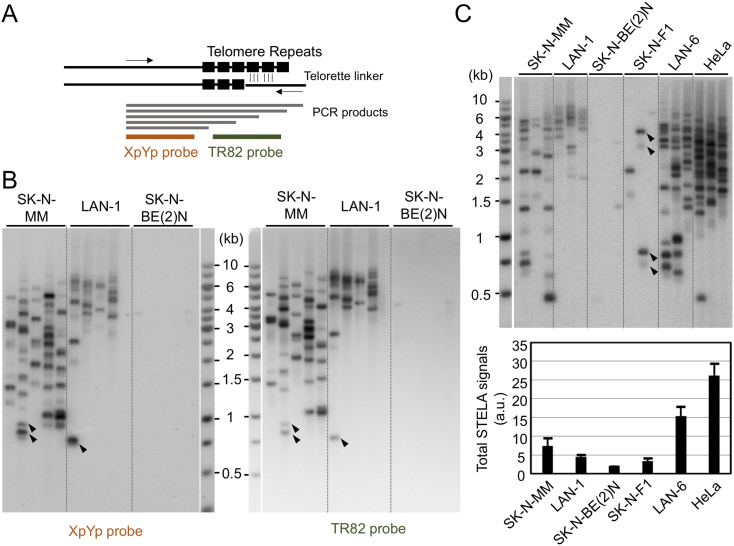
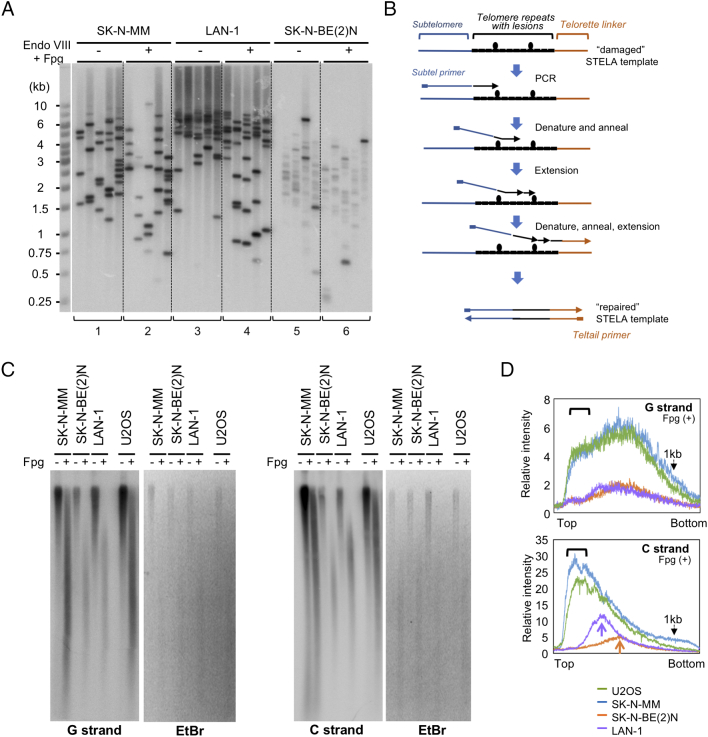
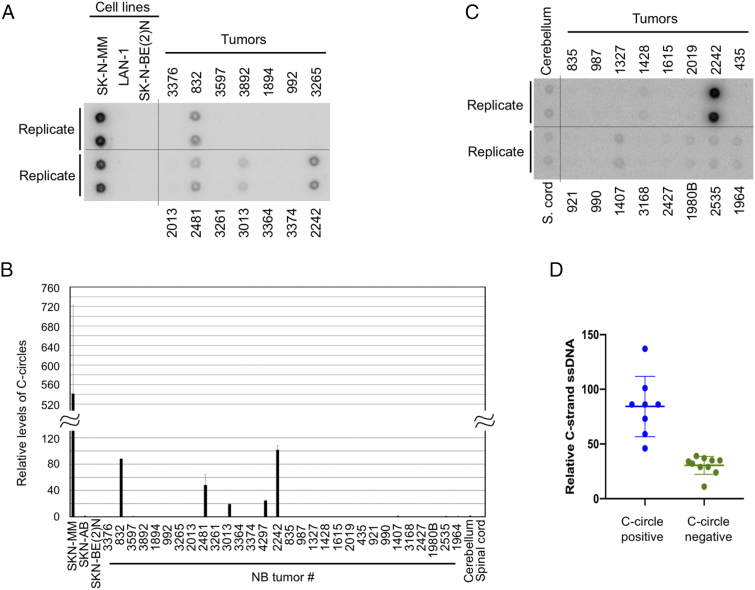
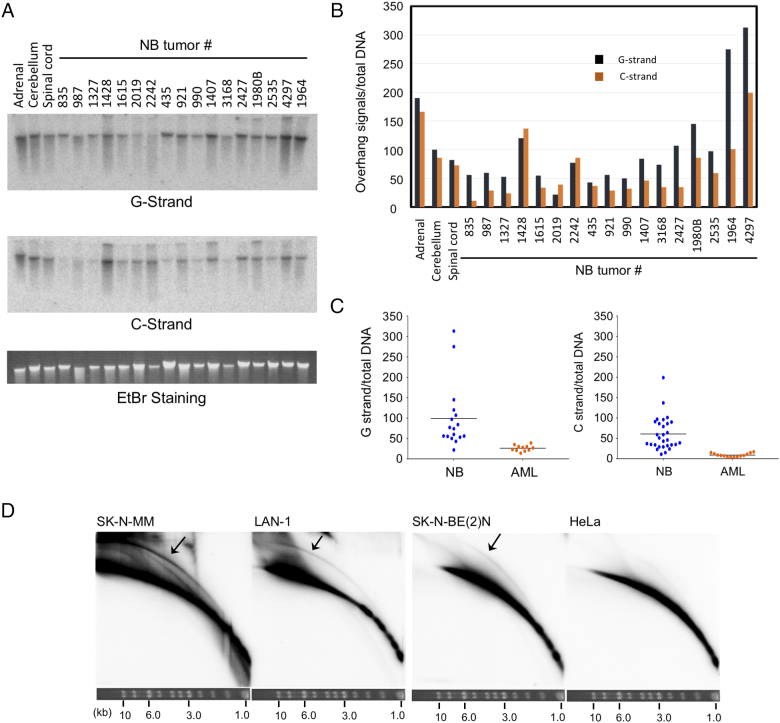
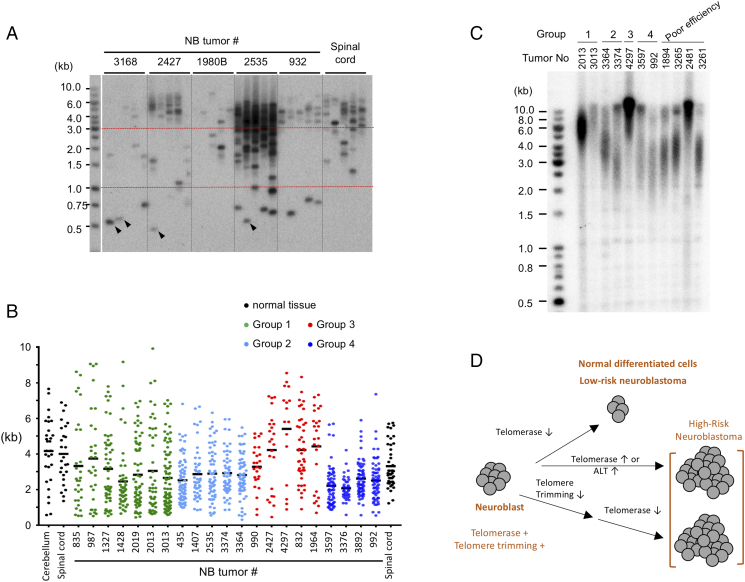
Telomeres play important roles in genome stability and cell proliferation. High risk neuroblastoma (HRNB), an aggressive childhood cancer, is especially reliant on telomere maintenance. Three recurrent genetic aberrations in HRNB (MYCN amplification, TERT re-arrangements, and ATRX mutations) are mutually exclusive and each capable of promoting telomere maintenance mechanisms (i.e., through telomerase or ALT). We analyzed a panel of 5 representative HRNB cell lines and 30 HRNB surgical samples using assays that assess average telomere lengths, length distribution patterns, single-stranded DNA on the G- and C-strand, as well as extra-chromosomal circular telomeres. Our analysis pointed to substantial and variable degrees of telomere DNA damage in HRNB, including pervasive oxidative lesions. Moreover, unlike other cancers, neuroblastoma consistently harbored high levels of C-strand ssDNA overhangs and t-circles, which are consistent with active "telomere trimming". This feature is observed in both telomerase- and ALT-positive tumors and irrespective of telomere length distribution. Moreover, evidence for telomere trimming was detected in normal neural tissues, raising the possibility that TMMs in HRNB evolved in the face of a canonical developmental program of telomere shortening. Telomere trimming by itself appears to distinguish neuroectodermal derived tumors from other human cancers, a distinguishing characteristic with both biologic and therapeutic implications.


Figures

Figure 1
Figure 1
Analysis of telomere lengths and structures in neuroblastoma cell lines. A. Southern analysis for telomere restriction fragments (TRFs) was performed using DNA from one ALT positive cell line (SK-N-MM) and two telomerase positive cell lines (LAN-1 and SK-N-BE(2)N). B. Undigested genomic DNA from NB cell lines (Top) and AML cell lines (bottom) was subjected to in-gel hybridization assay to measure single-stranded DNA on the G- and C-strand. Ethidium bromide stained gels that were used for the analysis are shown below each blot. This applies to all in-gel hybridization assays presented in this paper. C. The G- and C-strand overhang signals were tested with respect to their sensitivity to Exonuclease I and RecJf. Different amounts of Exonuclease I (0 U, 1 U, and 10 U) and RecJf (0 U, 1 U, 5 U, 10 U) were used to digest 150 to 300 ng of genomic DNA at 37 °C 1 h and 2 h, respectively. Exonuclease I and RecJf degrade single-stranded 3′-overhang and 5′-overhang, respectively. Arrowhead indicates G-strand that appears to be partially resistant to Exonuclease I. D. C-circle assays were performed using 30 ng DNA from the indicated cell lines (left). All C-circle analysis of cell lines and tumor samples were performed in duplicates or quadruplets. A series of titration indicates that the assay was not saturated with up to 32 ng of SK-N-MM DNA, which exhibits the highest level of C-circles among all the analyzed samples (right).
Figure 2
Figure 2
STELA analysis of telomere length distributions in neuroblastoma cell lines. A. A schematic diagram for STELA analysis was displayed. The telorette linker is annealed to telomere G-strand overhang and ligated to the 5′ end of the C-strand. The ligated DNA is then amplified by PCR (using primers that correspond to the linker sequence and a subtelomeric sequence), and detected by Southern. B-C. STELA analysis of five different NB cell lines and HeLa. To ensure adequate coverage of the telomere size distribution, 3 to 5 parallel PCR reactions for each ligated DNA sample were performed in all STELA assays in this paper. To confirm specificity of the PCR reactions, two different probes (subtelomere-specific XpYp and telomere-specific TR82) were used. Arrowheads in B indicate several very short telomeres. Arrowheads in C highlight a few STELA fragments of very different intensity in the same reaction. Total STELA signals from each cell line analyzed in C were quantified and plotted below the blot image.
Figure 3
Figure 3
Analysis of the effect of glycosylases on STELA and DNA nicks in neuroblastoma samples. A. NB cell line DNA samples (with and without Fpg and Endonuclease VIII treatment) were subjected to STELA analysis. To enable detection of weak STELA fragments from the SK-N-BE(2)N samples (sample sets 5 and 6), the PCR cycle number was increased from 33 to 36 for these assays. For the glycosylase-treated samples, 50 ng of each genomic DNA was digested with 5 U of Endonuclease VIII and 4 U of Fpg at 37 °C for 2 h. B. A possible model to for the low STELA efficiency of SK-N-BE(2)N sample is presented. See the main text for a detailed discussion. C. DNA from the indicated cell lines with or without Fpg treatment were analyzed by alkaline denaturing gel electrophoresis followed by Southern analysis using 32P-labeled C8 ((CCCTAA)8) probe in the G-strand assay panel and G8 ((TTAGGG)8) probe in the C-strand panel. The ethidium bromide stained gels (EtBr) for this analysis are shown to the right of the Southern images. To facilitate visual comparison, the ethidium bromide stained gel images are inverted. D. The traces for the Fpg-treated samples from all cell lines are plotted together for easy comparison. The data for G- and C-strand are presented separately. Thick black brackets indicate longer ssDNA found only in ALT-positive cells. The purple and orange arrows highlight the different distributions of the LAN-1 and SK-N-BE(2)N C-strand fragments following Fpg treatment.
Figure 4
Figure 4
Analysis of the levels of C-circles in NB tumors. A. C-circle assays were carried out using genomic DNA from the indicated NB cell lines and tumors. The cell line assays were done in quadruplet, and the tumor assays were done in duplicates. B. The levels of C-circles from the indicated cell lines, tumor samples, normal tissues were quantified and plotted. The signal from all samples were normalized to that from the spinal cord, which is set as 1 unit. C. C-circle assays were carried out using genomic DNA from the indicated normal tissues and tumor samples. After scanning, the ImageQuant scale is compressed to allow the visualization of weak signals (compare the signals for tumor 2422 in A and C). D. The C-strand ssDNA levels of the 7 samples with detectable C-circles and the 10 samples with undetectable C-circles were plotted as blue and green circles, respectively.
Figure 5
Figure 5
Analysis of ssDNA on the G- and C-strand in NB tumors and the detection of t-circles in NB cell lines. A. The levels of single-stranded G- and C-strand signals were measured by in-gel hybridization assay. B. From each in-gel hybridization blot, the relative signals of the G- and C-strand overhangs to total DNA (quantified by ethidium bromide staining) were determined and plotted. G-strand signals are shown as dark blue bars and C-strand signals orange bars. C. The levels of G- and C-strand overhangs are compared between multiple NB and AML tumor samples. D. The levels of t-circles in the indicated cell lines were analyzed by 2D gel electrophoresis and hybridization to the TR82 probe. The arcs corresponding to t-circles in the NB samples are highlighted by arrows. The gel strip showing the migration of size standards after the first round of electrophoresis is displayed at the bottom of each blot. The diagram on the left illustrates the directions of electrophoresis and the expected paths for linear and circular DNAs.
Figure 6
Figure 6
STELA analysis of telomere length distributions in neuroblastoma tumors; model for the roles of telomere trimming and TMMs in NB proliferation. A. Representative STELA analysis results for the indicated NB tumors are shown. A few especially short STELA fragments that correspond to the previously described T-stumps are designated by arrowheads. B. STELA signals were analyzed by TESLA software and plotted with prism software. Based on distributions of STELA signals, NB tumors are divided into 4 groups: broad distribution (group 1), well defined telomere cluster of 1.5 to 6 kb (group 2), mostly long telomeres (>3 kb) with a minor population of short telomeres (group 3), and tightly clustered short telomeres of 1 to 3 kb (group 4). NB tumors that showed poor STELA efficiency are not included in this classification. C. Selected NB tumor DNAs were subjected to TRF Southern analysis. Ethidium bromide staining of the gel indicate that all samples have comparable amounts of DNA except for tumor 3013, which contained two- to threefold less DNA. D. Model for how telomere trimming and TMMs may influence the proliferative capacity of neuroblast-derived normal and tumor cells. The neuroblast progenitor cells are proposed to harbor both telomere trimming and telomerase activity. Normal neural tissues and low-risk neuroblastoma have limited capacity for cell division due to the retention of telomere trimming and repression of TMMs (top branch). In contrast, high-risk neuroblastoma can sustain proliferation by either activating TMMs to compensate for the telomere trimming-mediated shortening (middle branch) or by repressing telomere trimming completely prior to shutting off telomerase (middle branch).

Similar articles

Cited by

References

    1. Ward E, DeSantis C, Robbins A, Kohler B, Jemal A. Childhood and adolescent cancer statistics, 2014. CA Cancer J Clin. 2014;64:83–103. - PubMed
    1. Canete A, Gerrard M, Rubie H, Castel V, Di Cataldo A, Munzer C, Ladenstein R, Brichard B, Bermudez JD, Couturier J. Poor survival for infants with MYCN-amplified metastatic neuroblastoma despite intensified treatment: the International Society of Paediatric Oncology European Neuroblastoma Experience. J Clin Oncol. 2009;27:1014–1019. - PubMed
    1. Hertwig F, Peifer M, Fischer M. Telomere maintenance is pivotal for high-risk neuroblastoma. Cell Cycle. 2016;15:311–312. - PMC - PubMed
    1. de Lange T. Shelterin-Mediated Telomere Protection. Annu Rev Genet. 2018;52:223–247. - PubMed
    1. de Lange T. How telomeres solve the end-protection problem. Science. 2009;326:948–952. - PMC - PubMed

Publication types