. 2019 May 31:15:452-466.
doi: 10.1016/j.isci.2019.05.001. Epub 2019 May 4.

A Cell-Permeant Mimetic of NMN Activates SARM1 to Produce Cyclic ADP-Ribose and Induce Non-apoptotic Cell Death

Affiliations

A Cell-Permeant Mimetic of NMN Activates SARM1 to Produce Cyclic ADP-Ribose and Induce Non-apoptotic Cell Death

Zhi Ying Zhao et al. iScience. .

Abstract

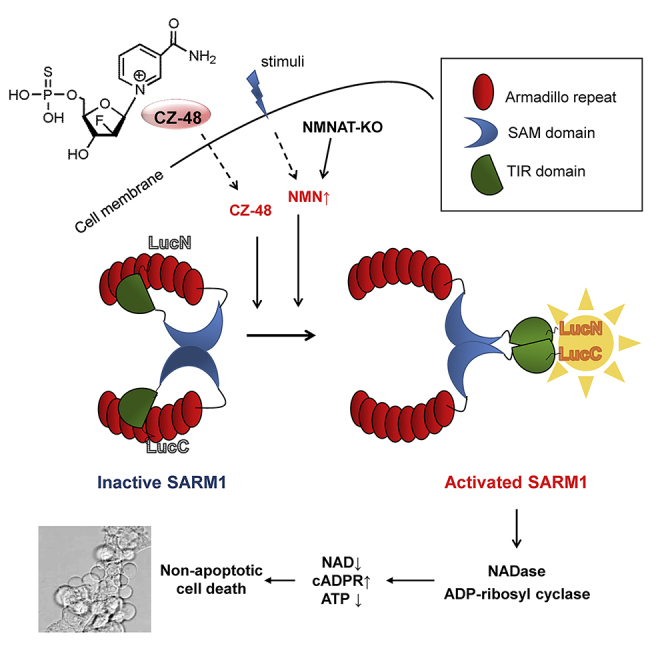
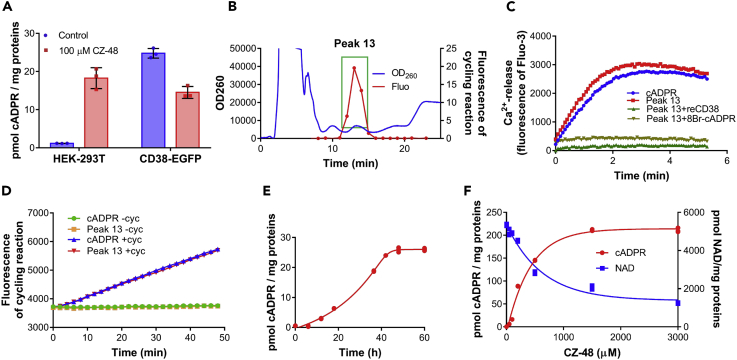
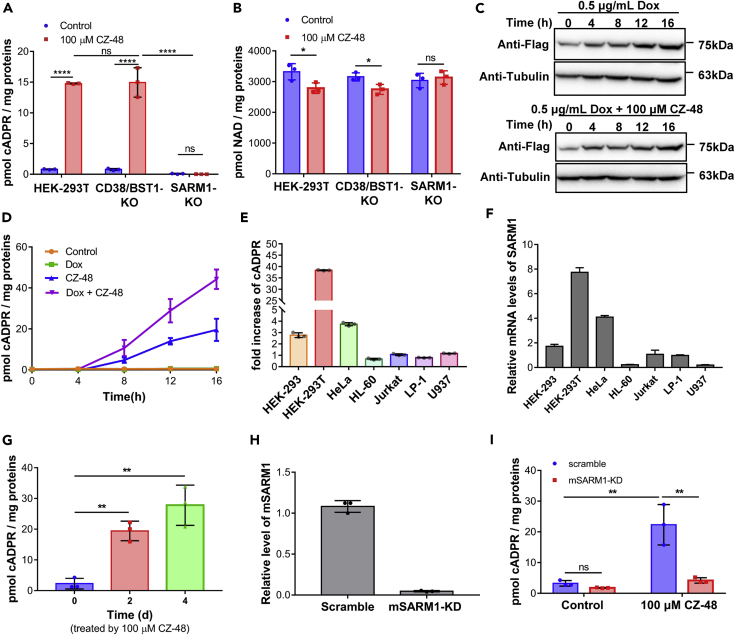
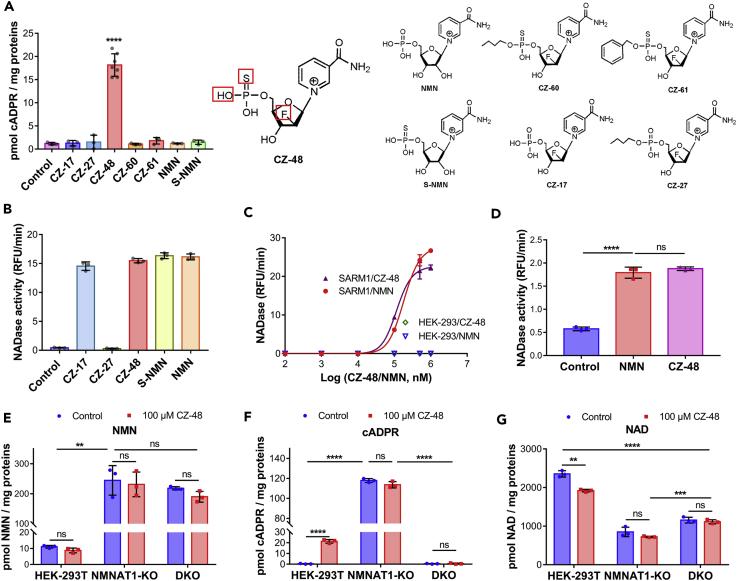
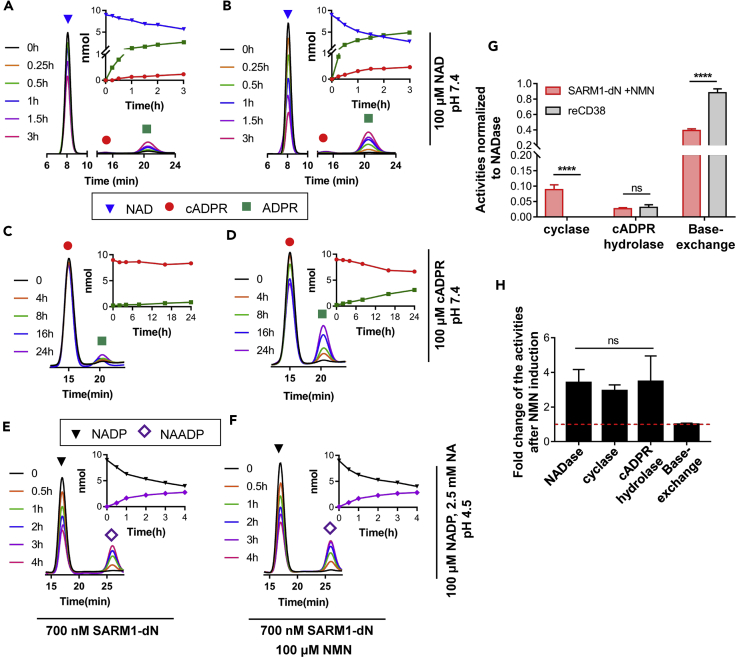
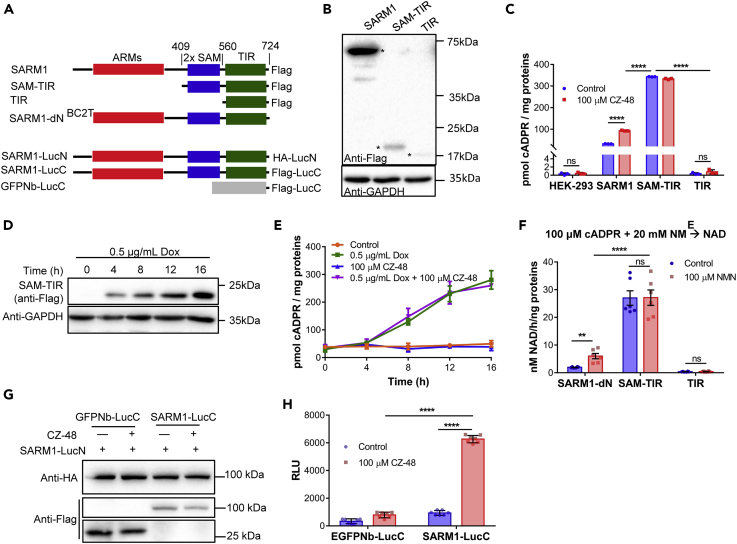
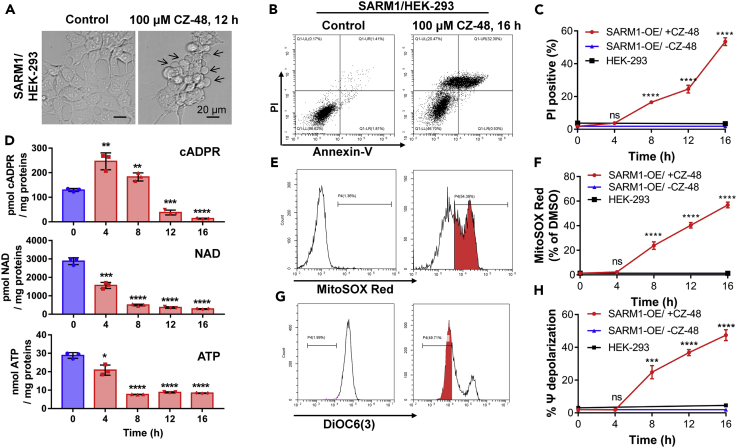
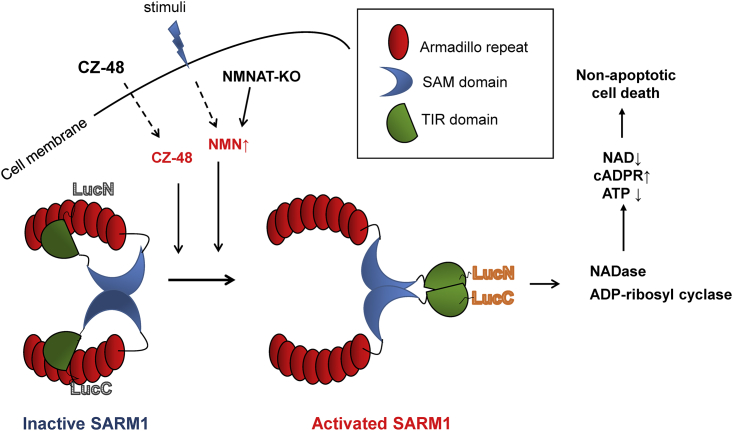
SARM1, an NAD-utilizing enzyme, regulates axonal degeneration. We show that CZ-48, a cell-permeant mimetic of NMN, activated SARM1 in vitro and in cellulo to cyclize NAD and produce a Ca2+ messenger, cADPR, with similar efficiency as NMN. Knockout of NMN-adenylyltransferase elevated cellular NMN and activated SARM1 to produce cADPR, confirming NMN was its endogenous activator. Determinants for the activating effects and cell permeability of CZ-48 were identified. CZ-48 activated SARM1 via a conformational change of the auto-inhibitory domain and dimerization of its catalytic domain. SARM1 catalysis was similar to CD38, despite having no sequence similarity. Both catalyzed similar set of reactions, but SARM1 had much higher NAD-cyclizing activity, making it more efficient in elevating cADPR. CZ-48 acted selectively, activating SARM1 but inhibiting CD38. In SARM1-overexpressing cells, CZ-48 elevated cADPR, depleted NAD and ATP, and induced non-apoptotic death. CZ-48 is a specific modulator of SARM1 functions in cells.

Keywords: Biochemical Mechanism; Biochemistry; Enzymology.


Figures

None
Graphical abstract
Figure 1
Figure 1
An Inhibitor of CD38, CZ-48 Induces Intracellular cADPR Production (A) Wild-type and CD38-EGFP-overexpressing HEK-293T cells were treated with 100 μM CZ-48 for 24 h, and cADPR contents were analyzed by cycling assay. (B) The target compound was separated by HPLC. HEK-293T cells were treated with 100 μM CZ-48 for 72 h, and the nucleotides were extracted and fractionated by HPLC with an AG MP-1 column (blue line, left y axis). Fractions 4, 5, and 6 (Peak 13, green box) showed positive signals in the cycling assay (red line, right y axis). (C) Peak 13 released Ca2+ from sea urchin homogenate similar to 0.5 μM cADPR, was blocked by 500 μM 8Br-cADPR pre-treatment of the homogenate, and was destroyed by 10 μg/mL reCD38 pre-treatment of the compound. (D) Peak 13 produced the fluorescence signals similar to 0.5 μM cADPR in cycling assay. (E) The time course of cADPR production in the CZ-48-treated HEK-293T cells. HEK-293T cells were treated with 100 μM CZ-48 for different time periods, and cADPR contents were analyzed by cycling assay. (F) Dose-response curves of CZ-48 in intracellular cADPR production and NAD consumption. HEK-293T cells were treated with different doses of CZ-48 for 24 h, and the amounts of cADPR and NAD were analyzed. All the above-mentioned experiments were repeated at least three times (means ± SDs; n = 3).
Figure 2
Figure 2
The Effect of CZ-48 Was Not Mediated by CD38 or BST-1, but by SARM1 (A and B) Wild-type, CD38/BST-1 double KO, and SARM1-KO HEK-293T cells were treated with 100 μM CZ-48 for 24 h, and intracellular cADPR (A) and NAD (B) contents were measured. (C and D) HEK-293 cells carrying an inducible expression cassette of FLAG-tagged SARM1 were treated with 100 μM CZ-48, 0.5 μg/mL Dox, or both for different time periods. The expression levels of SARM1-FLAG were analyzed by western blots (C), and the cADPR contents were analyzed by cycling assay (D). (E) The cellular cADPR levels were measured in different cell lines after treatment of 100 μM CZ-48 for 24 h, and the fold changes were presented. (F) The mRNA levels of SARM1 in the cell lines were quantified by qRT-PCR. (G) The primary culture of mouse sensory neurons was treated with 100 μM CZ-48 for 2 or 4 days, and the cADPR levels were measured. (H) SARM1 was knocked down in the mouse neurons, assayed by qRT-PCR. (I) SARM1-knockdown neurons, together with the scramble short hairpin RNA-infected cells as controls, were treated with 100 μM CZ-48 for 48 h, and the cADPR levels were measured. All the above experiments were repeated at least three times (means ± SDs; n = 3; Student's t test, *p < 0.05, **p < 0.01, ****p < 0.0001).
Figure 3
Figure 3
CZ-48 Mimics Endogenous Metabolite NMN in Activating SARM1 (A) HEK-293T cells were treated with 100 μM of different compounds for 24 h, and cADPR contents were measured. The structures of the compounds are shown in the right panel. (B) SARM1-FLAG-overexpressing HEK-293 cells were permeabilized by 100 μM digitonin, and the supernatant was incubated with 100 μM of different compounds, together with 50 μM ɛNAD, and the activities of SARM1 (slopes of the fluorescence production) were analyzed and plotted. (C) The dose-response curves of CZ-48 and NMN on SARM1-FLAG in the cell lysate. Lysate of SARM1-FLAG cells, with HEK-293 as a control, were incubated with different doses of NMN or CZ-48, and NADase activities were measured as (B). (D) The proteins SARM1-FLAg were immunoprecipitated with anti-FLAg beads, eluted with 3× FLAG peptide, and the NADase activities were measured as in (B) in the presence of 100 μM NMN or CZ-48. (E–G) Cellular levels of NMN (E), cADPR (F), and NAD (G) were measured by cycling assays in wild-type, NMNAT1-knockout, and NMNAT1/SARM1 double knockout (DKO) HEK-293T cells. All the above experiments were repeated at least three times (means ± SDs; n ≥ 3; Student's t test, **p < 0.01, ***p < 0.001, ****p < 0.0001).
Figure 4
Figure 4
The Enzymatic Activities of SARM1 with or without NMN Activation BC2T-tagged SARM1 with the N-terminal location signal truncated (SARM1-dN, c.f. Figure 5A and Methods) was immunoprecipitated by BC2Nb beads and quantified by western blots. Around 700 nM of SARM1-dN (with or without pre-treatment of 100 μM NMN) was used in three reactions. (A and B) The activities of NAD hydrolase and ADP-ribosyl cyclase. The protein, 700 nM SARM1-dN (A, without NMN; B, with NMN), was incubated with 100 μM NAD in KHM (pH 7.4) for different time periods, and the products were analyzed by HPLC. Insets (above the red dots): enlarged peaks of cADPR in the chromatogram; insets (dot plot): quantification of the products. Blue triangles, NAD; red circles, cADPR; green squares, ADP-ribose. (C and D) cADPR hydrolase activity. Similar reactions were set and analyzed as in (A and B), except the substrate was replaced by the same amount of cADPR. Insets: Red, cADPR; green, ADP-ribose. (E and F) Base-exchange reaction. Similar reactions were set and analyzed as in (A and B), except the substrate was replaced by same amount of NADP and 2.5 mM NA in 15 mM acetate buffer (pH 4.5). Insets: black, NADP; purple, NAADP. (G) The activities of NMN-activated SARM1-dN (in B, D, F) and reCD38 (Graeff et al., 2001) were normalized with their NAD hydrolase activities. (H) The activities including NADase (ADPR production rate in A and B), ADP-ribosyl cyclase (cADPR production rate in A and B), cADPR hydrolase (ADPR production rate in C and D), and base-exchange activities (NAADP production rate in E and F) were calculated and presented as the fold change after NMN induction. The red dashed line is the activity level of SARM1-dN without NMN. The experiments were repeated at least three times. All the above experiments were repeated at least three times (means ± SDs; n = 3; Student's t test, ****p < 0.0001).
Figure 5
Figure 5
CZ-48 and NMN Induce Allosteric Conformational Changes of SARM1 Leading to its Activation (A–H) (A) Diagram of tagged full-length SARM1 and various truncates (for B–F) and the fusion proteins with the luciferase fragments (last three constructs, for G and H). For the sake of brevity the tags FLAG or HA are omitted in this figure unless otherwise specified. (B) HEK-293 cells stably expressing SARM1 and truncates were constructed. SARM1 and TIR were in constitutive expression cassettes, whereas SAM-TIR was in an inducible expression cassette to prevent cell death caused by overexpression of SAM-TIR. The expression levels of the constitutive SARM1 and TIR, and SAM-TIR induced by 0.5 μg/mL Dox for 20 h, were tested by western blots. Asterisks point to the specific bands. (C) Cells from (B) were treated with 100 μM CZ-48 for 8 h, and the cADPR contents were measured. (D and E) HEK-293 cells carrying an inducible expression cassette of SAM-TIR were treated with 100 μM CZ-48 or 0.5 μg/mL Dox, and protein levels were measured by western blots (D) or cADPR levels (E). (F) Proteins were immunoprecipitated and the cyclase activity in vitro was tested by reverse cycling assay with or without the presence of 100 μM NMN. (G and H) HEK-293 cells, co-transfected with the vectors encoding SARM1-LucN/SARM1-LucC or SARM1-LucN/GFPNb-LucC, as a negative control, were treated with 100 μM CZ-48 for 12 h. The expression of fusion proteins (G) and reconstituted luciferase activities (H) were measured by western blots or luciferin incubation reaction, respectively. All the above experiments were repeated at least three times (means ± SDs; n = 3; Student's t test, **p < 0.01, ****p < 0.0001).
Figure 6
Figure 6
Activation of SARM1 by CZ-48 Induced Cell Death (A–H) Wild-type and SARM1-overexpressing HEK-293 cells were treated by 100 μM CZ-48 for labeled time periods. (A) CZ-48 treatment induces cell blisters (black arrows) and shrinkage in cells overexpressing SARM1. (B and C) Cell viabilities were analyzed by annexin-V/PI staining combining flow cytometry (B), and the PI positive rates of all samples were plotted (C). (D) The cellular contents of cADPR (upper chart), NAD (middle chart), and ATP (lower chart) were measured by cycling assay or luminescent ATP detection assay, as described in Methods. (E and F) Mitochondrial reactive oxygen species contents were measured by MitoSOX red staining and analyzed by flow cytometry (E). The positive rates of all samples were plotted (F). (G and H) Mitochondrial membrane potential was analyzed by DIOC6(3) staining and analyzed by flow cytometry (G). The positive rates of all samples were plotted (H). All the above experiments were repeated at least three times (means ± SDs; n = 3; Student's t test, **p < 0.01, ***p < 0.001, ****p < 0.0001).
Figure 7
Figure 7
Summary of the Activation of SARM1 by CZ-48 and NMN

References

    1. Aarhus R., Graeff R.M., Dickey D.M., Walseth T.F., Lee H.C. ADP-ribosyl cyclase and CD38 catalyze the synthesis of a calcium-mobilizing metabolite from NADP. J. Biol. Chem. 1995;270:30327–30333. - PubMed
    2. Aarhus R, Graeff RM, Dickey DM, Walseth TF, Lee HC (1995) ADP-ribosyl cyclase and CD38 catalyze the synthesis of a calcium-mobilizing metabolite from NADP. J Biol Chem. 270: 30327-30333 - PubMed
    1. Becherer J.D., Boros E.E., Carpenter T.Y., Cowan D.J., Deaton D.N., Haffner C.D., Jeune M.R., Kaldor I.W., Poole J.C., Preugschat F. Discovery of 4-Amino-8-quinoline carboxamides as novel, submicromolar inhibitors of NAD-hydrolyzing enzyme CD38. J. Med. Chem. 2015;58:7021–7056. - PubMed
    2. Becherer JD, Boros EE, Carpenter TY, Cowan DJ, Deaton DN, Haffner CD, Jeune MR, Kaldor IW, Poole JC, Preugschat F, Rheault TR, Schulte CA, Shearer BG, Shearer TW, Shewchuk LM, Smalley TL, Jr., Stewart EL, Stuart JD, Ulrich JC (2015) Discovery of 4-Amino-8-quinoline Carboxamides as Novel, Submicromolar Inhibitors of NAD-Hydrolyzing Enzyme CD38. Journal of medicinal chemistry 58: 7021-7056 - PubMed
    1. Bogdanove A.J., Voytas D.F. TAL effectors: customizable proteins for DNA targeting. Science. 2011;333:1843–1846. - PubMed
    2. Bogdanove AJ, Voytas DF (2011) TAL effectors: customizable proteins for DNA targeting. Science 333: 1843-1846 - PubMed
    1. Brailoiu E., Churamani D., Cai X., Schrlau M.G., Brailoiu G.C., Gao X., Hooper R., Boulware M.J., Dun N.J., Marchant J.S., Patel S. Essential requirement for two-pore channel 1 in NAADP-mediated calcium signaling. J. Cell Biol. 2009;186:201–209. - PMC - PubMed
    2. Brailoiu E, Churamani D, Cai X, Schrlau MG, Brailoiu GC, Gao X, Hooper R, Boulware MJ, Dun NJ, Marchant JS, Patel S (2009) Essential requirement for two-pore channel 1 in NAADP-mediated calcium signaling. The Journal of cell biology 186: 201-209 - PMC - PubMed
    1. Bruce V.J., McNaughton B.R. Evaluation of nanobody conjugates and protein fusions as bioanalytical reagents. Anal. Chem. 2017;89:3819–3823. - PMC - PubMed
    2. Bruce VJ, McNaughton BR (2017) Evaluation of Nanobody Conjugates and Protein Fusions as Bioanalytical Reagents. Anal Chem. 89: 3819-3823 - PMC - PubMed