

Alternatively activated macrophage-derived secretome stimulates ovarian cancer spheroid spreading through a JAK2/STAT3 pathway
- PMID: 31129149
- PMCID: PMC6659112
- DOI: 10.1016/j.canlet.2019.05.029
Alternatively activated macrophage-derived secretome stimulates ovarian cancer spheroid spreading through a JAK2/STAT3 pathway
Abstract
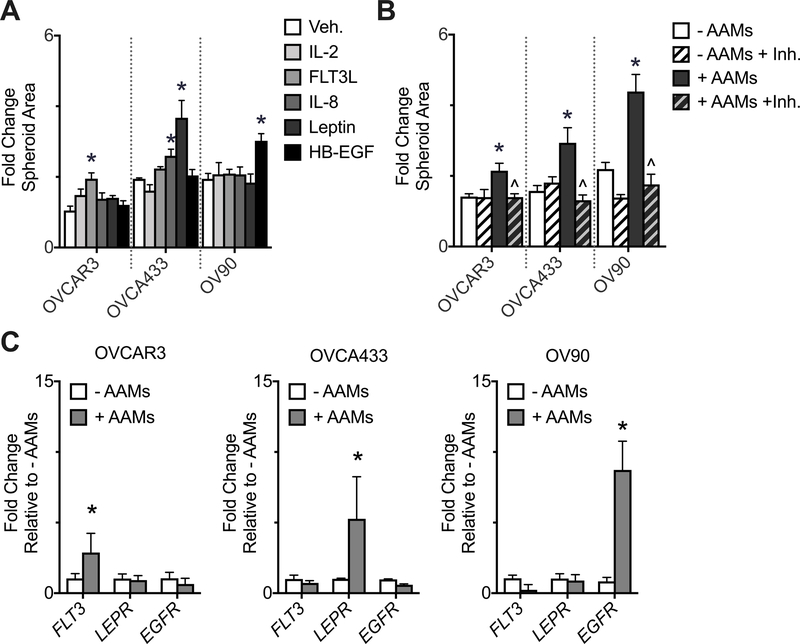
High-grade serous ovarian cancer (HGSOC) metastasizes when tumor spheroids detach from the primary tumor and re-attach throughout the peritoneal cavity. Once the cancer cells have implanted in these new sites, the development of metastatic lesions is dependent on the disaggregation of cancer cells from the spheroids and subsequent expansion across the collagenous extracellular matrix (ECM). As HGSOC progresses an increase in alternatively activated macrophages (AAMs) in the surrounding ascites fluid has been observed and AAMs have been shown to enhance tumor invasion and growth in a wide range of cancers. We hypothesized that soluble factors from AAMs in the peritoneal microenvironment promote the disaggregation of ovarian cancer spheroids across the underlying ECM. We determined that co-culture with AAMs significantly increased HGSOC spheroid spreading across a collagen matrix. Multivariate modeling identified AAM-derived factors that correlated with enhanced spread of HGSOC spheroids and experimental validation showed that each individual cell line responded to a distinct AAM-derived factor (FLT3L, leptin, or HB-EGF). Despite this ligand-level heterogeneity, we determined that the AAM-derived factors utilized a common signaling pathway to induce spheroid spreading: JAK2/STAT3 activation followed by MMP-9 mediated spreading. Furthermore, immunostaining demonstrated that FLT3, LEPR, EGFR, and pSTAT3 were upregulated in metastases in HGSOC patients, with substantial patient-to-patient heterogeneity. These results suggest that inhibiting individual soluble factors will not inhibit AAM-induced effects across a broad group of patients; instead, the downstream JAK2/STAT3/MMP-9 pathway should be examined as potential therapeutic targets to slow metastasis in ovarian cancer.
Keywords: MMP-9; Macrophages; Ovarian cancer; STAT3; Tumor microenvironment.
Copyright © 2019 Elsevier B.V. All rights reserved.
Conflict of interest statement
CONFLICTS OF INTEREST
The authors declare they have no competing interests.
Figures


Similar articles
-
Ovarian cancer cells direct monocyte differentiation through a non-canonical pathway.BMC Cancer. 2020 Oct 17;20(1):1008. doi: 10.1186/s12885-020-07513-w. BMC Cancer. 2020. PMID: 33069212 Free PMC article.
-
TGFBI Production by Macrophages Contributes to an Immunosuppressive Microenvironment in Ovarian Cancer.Cancer Res. 2021 Nov 15;81(22):5706-5719. doi: 10.1158/0008-5472.CAN-21-0536. Epub 2021 Sep 24. Cancer Res. 2021. PMID: 34561272 Free PMC article.
-
Epidermal growth factor-induced ovarian carcinoma cell migration is associated with JAK2/STAT3 signals and changes in the abundance and localization of alpha6beta1 integrin.Int J Biochem Cell Biol. 2009 May;41(5):1034-45. doi: 10.1016/j.biocel.2008.09.018. Epub 2008 Sep 27. Int J Biochem Cell Biol. 2009. PMID: 18930836
-
Extracellular matrix in high-grade serous ovarian cancer: Advances in understanding of carcinogenesis and cancer biology.Matrix Biol. 2023 Apr;118:16-46. doi: 10.1016/j.matbio.2023.02.004. Epub 2023 Feb 11. Matrix Biol. 2023. PMID: 36781087 Review.
-
Beyond tumor‑associated macrophages involved in spheroid formation and dissemination: Novel insights for ovarian cancer therapy (Review).Int J Oncol. 2024 Dec;65(6):117. doi: 10.3892/ijo.2024.5705. Epub 2024 Nov 8. Int J Oncol. 2024. PMID: 39513610 Free PMC article. Review.
Cited by
-
CAGE-miR-140-5p-Wnt1 Axis Regulates Autophagic Flux, Tumorigenic Potential of Mouse Colon Cancer Cells and Cellular Interactions Mediated by Exosomes.Front Oncol. 2019 Nov 14;9:1240. doi: 10.3389/fonc.2019.01240. eCollection 2019. Front Oncol. 2019. PMID: 31799196 Free PMC article.
-
Matrix Metalloproteinase 9 Induced in Esophageal Squamous Cell Carcinoma Cells via Close Contact with Tumor-Associated Macrophages Contributes to Cancer Progression and Poor Prognosis.Cancers (Basel). 2023 May 30;15(11):2987. doi: 10.3390/cancers15112987. Cancers (Basel). 2023. PMID: 37296952 Free PMC article.
-
Macrophages: an indispensable piece of ovarian health.Biol Reprod. 2021 Mar 11;104(3):527-538. doi: 10.1093/biolre/ioaa219. Biol Reprod. 2021. PMID: 33274732 Free PMC article. Review.
-
Friend and foe: the regulation network of ascites components in ovarian cancer progression.J Cell Commun Signal. 2023 Sep;17(3):391-407. doi: 10.1007/s12079-022-00698-8. Epub 2022 Oct 13. J Cell Commun Signal. 2023. PMID: 36227507 Free PMC article. Review.
-
A comprehensive overview of ovarian cancer stem cells: correlation with high recurrence rate, underlying mechanisms, and therapeutic opportunities.Mol Cancer. 2025 May 7;24(1):135. doi: 10.1186/s12943-025-02345-3. Mol Cancer. 2025. PMID: 40329326 Free PMC article. Review.
References
Publication types
MeSH terms
Substances
Grants and funding
LinkOut - more resources
Full Text Sources
Medical
Research Materials
Miscellaneous
