. 2019 Sep:198:303-316.
doi: 10.1016/j.neuroimage.2019.05.049. Epub 2019 May 23.

Extraction of the cardiac waveform from simultaneous multislice fMRI data using slice sorted averaging and a deep learning reconstruction filter

Affiliations

Extraction of the cardiac waveform from simultaneous multislice fMRI data using slice sorted averaging and a deep learning reconstruction filter

Serdar Aslan et al. Neuroimage. 2019 Sep.

Abstract

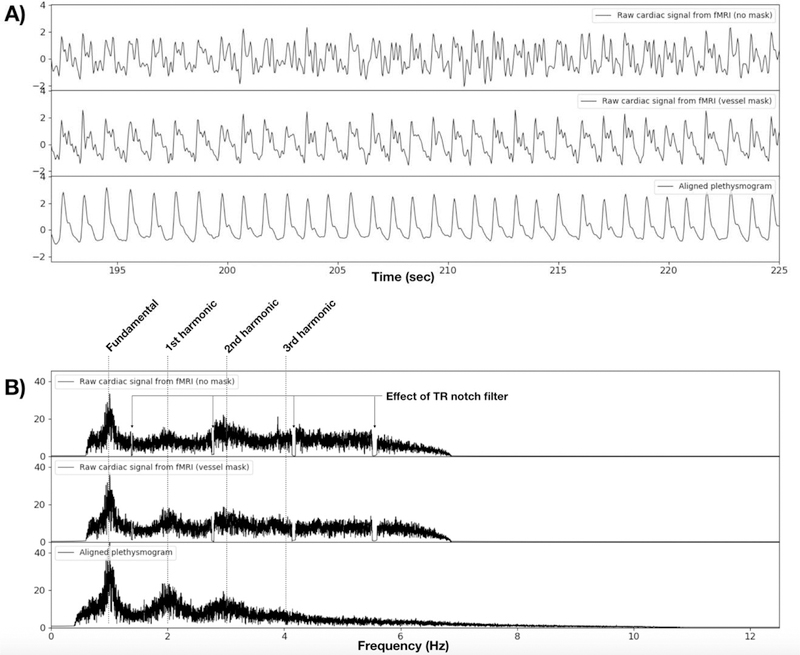
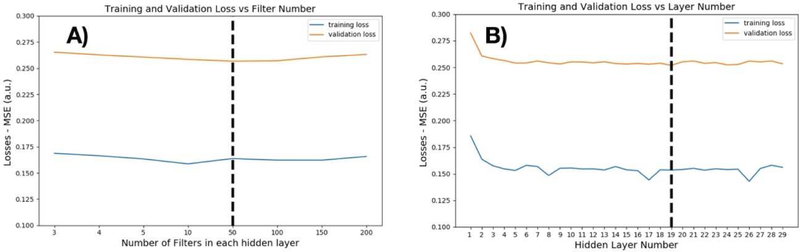
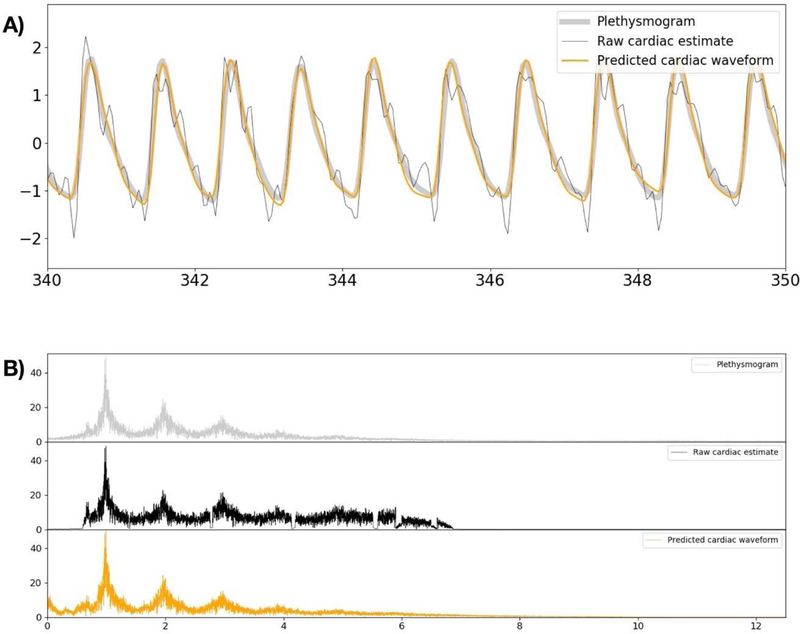
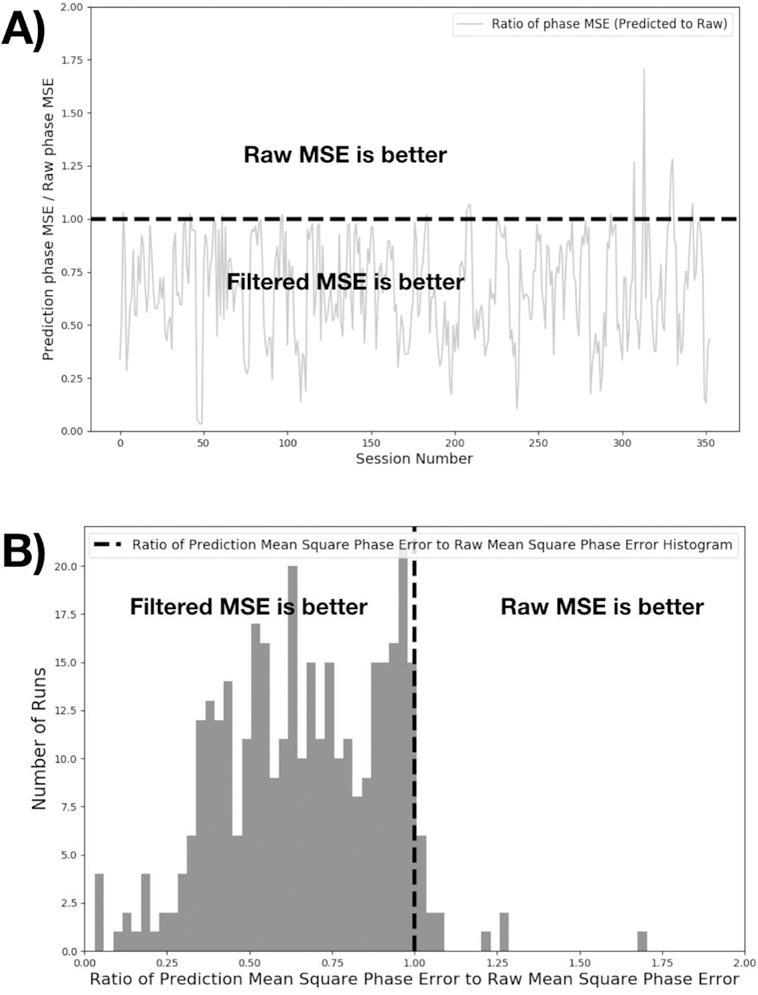
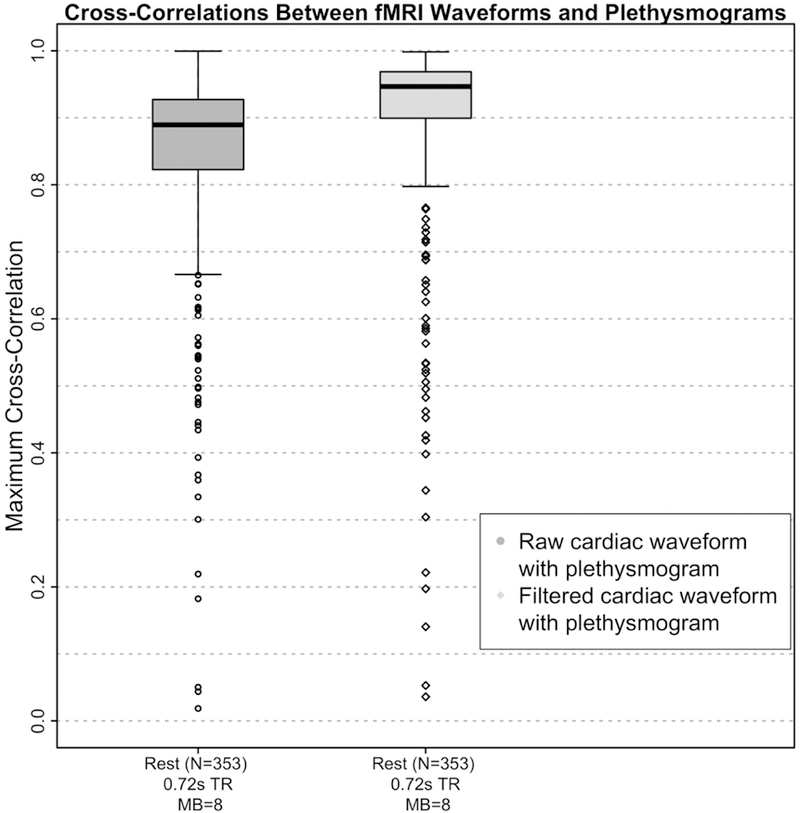
Cardiac signal contamination has long confounded the analysis of blood-oxygenation-level-dependent (BOLD) functional magnetic resonance imaging (fMRI). Cardiac pulsation results in significant BOLD signal changes, especially in and around blood vessels. Until the advent of simultaneous multislice echo-planar imaging (EPI) acquisition, the time resolution of whole brain EPI was insufficient to avoid cardiac aliasing (and acquisitions with repetition times (TRs) under 400-500 ms are still uncommon). As a result, direct detection and removal of the cardiac signal with spectral filters is generally not possible. Modelling methods have been developed to mitigate cardiac contamination, and recently developed techniques permit the visualization of cardiac signal propagation through the brain in undersampled data (e.g., TRs > 1s), which is useful in its own right for finding blood vessels. However, both of these techniques require data from which to estimate cardiac phase, which is generally not available for the data in many large databases of existing imaging data, and even now is not routinely recorded in many fMRI experiments. Here we present a method to estimate the cardiac waveform directly from a multislice fMRI dataset, without additional physiological measurements, such as plethysmograms. The pervasive spatial extent and temporal structure of the cardiac contamination signal across the brain offers an opportunity to exploit the nature of multislice imaging to extract this signal from the fMRI data itself. While any particular slice is recorded at the TR of the imaging experiment, slices are recorded much more quickly - typically from 10 to 20 Hz - sufficiently fast to fully sample the cardiac signal. Using the fairly permissive assumptions that the cardiac signal is a) pseudoperiodic b) somewhat coherent within any given slice, and c) is similarly shaped throughout the brain, we can extract a good estimate of the cardiac phase as a function of time from fMRI data alone. If we make further assumptions about the shape and consistency of cardiac waveforms, we can develop a deep learning filter to greatly improve our estimate of the cardiac waveform.

Keywords: BOLD; Cardiac waveform; Physiological noise; Plethysmogram; fMRI.


Figures

Figure 1
Figure 1
A) A magnified portion of the raw cardiac signal estimate, using no masking (upper trace) from a typical fMRI dataset (HCP participant 100206, REST1, RL), compared to raw cardiac signal estimate from voxels in a vessel mask (middle trace), and to the ground truth plethysmogram data from the same scan (lower trace). B) Shows the signal spectra from the timecourses above. The spectra of the raw signals show the fundamental and harmonics of the cardiac waveform, but with different relative strengths than the plethysmogram waveform. Using a vessel mask visibly increases the quality of the derived cardiac waveform, showing the risetime more clearly in the time domain, and the harmonic structure is closer to that of the plethysmogram than with the unmasked waveform. The effect of the TR harmonic notch filter can clearly be seen in the top two spectra. The middle trace shows that the spectral characteristics of the plethysmogram are more accurate in the vessel masked waveform estimate. Note that the effective sampling frequency of the HCP data is 12.5 Hz (72 slices, multiband (MB) factor of 8, TR of 0.72s), so there is no spectral energy over the Nyquist frequency of 6.25Hz in the raw cardiac estimates.
Figure 2
Figure 2
A) Hyper-parameter search for optimum number of filters. We selected 50 filters as the optimum point in the hyper-parameter search. For every layer, we used the same number of filters. Increasing the number of filters past 50 did not improve performance on the validation set. B) Hyper-parameter search for the optimum number of layers: After choosing the number of filters, we tested different numbers of hidden layers. There was no improvement in validation performance after 19 hidden layers.
Figure 3
Figure 3
Comparison of the initial raw signal estimate, the CNN filter prediction, and the ground-truth plethysmogram data. A) shows a magnified section of the timecourse from a typical scan, with the signals overlayed for ease of comparison. The raw cardiac estimate shows the cardiac periodicity, and can be used to estimate cardiac phase, but the signal itself is noisy and distorted. The CNN output is de-noised and much closer to the ground truth. B) Shows the spectra of the same signals.
Figure 4
Figure 4
This figure shows phase error comparison of CNN versus the raw cardiac signal. For 353 sessions, we calculated the phase error for both CNN and raw cardiac signals. Analytic phase projection algorithm can result in outliers in some period of the time sequence. We include datapoints up to the 99.9th percentile of the phase errors to exclude outliers in the data. Mean square phase errors relative to the ground truth plethysmogram are calculated and presented as a ratio. In the majority of the cases, phase calculated from CNN output was better compared to Stage 2 output. A) shows the error ratios for individual runs, B) presents the same data as a histogram. The top 2 outliers were found to be high frequency plethysmogram data (cardiac rate of ~120 BPM) which was outside of the typical training range of the dataset.
Figure 5
Figure 5
Boxplots of maximum cross-correlation values between the fMRI derived cardiac waveforms and the simultaneously acquired plethysmograms before (“raw”) and after (“filtered”) application of the deep learning reconstruction filter for the Human Connectome Project (HCP) data. The fMRI and plethysmogram data were obtained from the HCP 1200 Subjects Release. 4 scans each from the first 100 subjects numerically in the “339 unrelated subjects” list were included in the dataset. Of the 400 runs, 47 were eliminated due to unusable plethysmograms, leaving 353 runs in the correlation analysis.
Figure 6
Figure 6
Bland-Altman plot of the average (Avg) heart rate (HR) in beats per minute (BPM) estimated from the plethysmogram (pleth) and the rate estimated from the signal extracted from the MR data, after applying the deep learning filter (Filtered fMRI) vs their difference (Diff) for the Human Connectome Project (HCP) participants for the 353 runs with quantifiable plethysmogram data (see “Plethysmogram data quality”). The correlation coefficient between the estimates is 0.988 with p < 1.543e-286.
Figure 7.
Figure 7.
A) High correlation (r=0.8–0.85) between the timecourse of the cardiac phase derived by using RETROICOR for all methods of deriving the cardiac waveform. B) and C) show the reduced variance in the grey matter for Human Connectome (HCP) and MyConnectome data, respectively. The deep learning estimate performed better than both the raw signal estimate (Raw.filt, p=7.1881e-08) or the plethysmogram data (Pleth, p=0.0038) in the HCP data (B) as well as better than the raw signal estimate (Raw.filt, p= 1.7275e-15) in the MyConnectome data (C).
Figure 8
Figure 8
RR interval timecourses for HCP subject 100206, REST1, LR. A) is derived from the raw fMRI extracted timecourse, B) is from the deep learning filtered timecourse, and C) is from the simultaneous plethysmogram. D) Shows a magnified portion of the RRIs from the plethysmogram with the filtered fMRI RRI trace overlaid to show the match. All R-wave timecourses were obtained using the PhysIO toolbox to process the raw waveforms.
Figure 9
Figure 9
Histogram of crosscorrelation values between plethysmogram waveforms before and after application of the deep learning filter. High quality plethysmograms are not significantly changed by the filter, but signals without a strong cardiac waveform are. “Unusable” plethysmograms were visually verified to have either no signal, extremely poor SNR, strong artifacts, or distorted cardiac waveforms. 47 of 400 runs (11.75%) were found to be unusable.
Figure 10
Figure 10
Bland-Altman plots characterizing the relationship of the measured heart rate (HR) estimated before (“Morning”) and after (“After”) the MR imaging session with the rate estimated from the signal extracted from the MR data, after applying the deep learning filter for the Myconnectome dataset (“Deep Learning Prediction”). It is noteworthy that the correlation coefficient both between the “Morning” and “Deep Learning Prediction” (R=0.610, p<1.18e-9, panel A) and the “Deep Learning Prediction” and “After” (R=0.660, p<2.64e-11, panel B) are higher than the correlation between the “Morning” and “After” measurements (R=0.589, p<1.31e- 9, panel C). Correlations are summarized in panel D. This highlights the fact that heartrate measured outside of the scanner is variable, and may not truly reflect the heart rate during the fMRI scan. Again, the plot shows no bias or dependence on heart rate.
Figure 11
Figure 11
Boxplots of maximum cross-correlation values between the fMRI derived cardiac waveforms and the simultaneously acquired plethysmograms before (“raw”) and after (“filtered”) application of the deep learning reconstruction filter for the three resting state (Rest) scans in the left-most panel, the two visual checkerboard (CB) scans in the middle panel, and one breath hold (BH) scan in the right-most panel. The fMRI and plethysmogram data were obtained from the Discovery Science Study of the Enhanced Nathan Kline Institute – Rockland Sample (NKI-RS) dataset. Participants (out of N=67) included in this figure met the threshold of maximum cross- correlation of the filtered cardiac waveform with its associated plethysmogram >0.70. TR=repetition time, s=seconds, and MB=multiband factor.
Figure 12
Figure 12
Frames from cardiac pressure wave movies generated using phase projections using cardiac phase from the deep learning filtered cardiac regressor extracted from typical fMRI data for a run in A) the HCP dataset (participant 100307 REST1 LR) and B) the Myconnectome dataset (run 060). Frames are equally spaced in phase across a single cycle of the cardiac waveform. Full movies can be found in the supplemental material.

Similar articles

Cited by

References

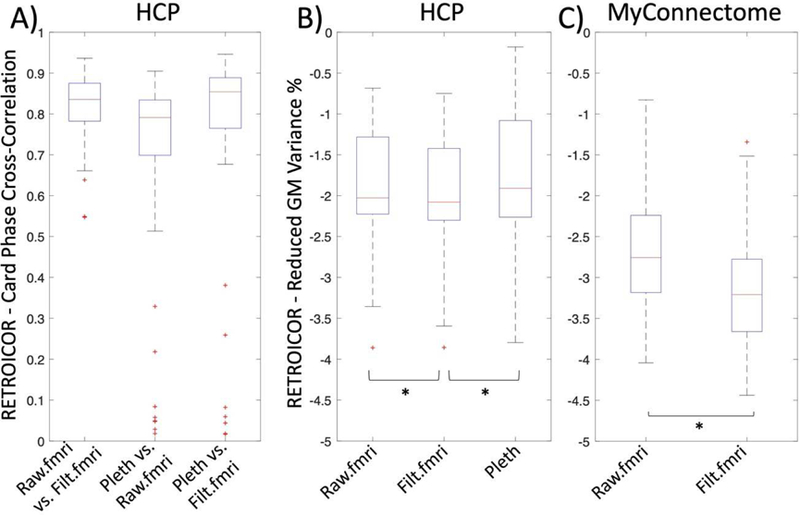
    1. Glover GH, Li TQ, and Ress D, Image-based method for retrospective correction of physiological motion effects in fMRI: RETROICOR. Magn Reson Med, 2000. 44(1): p. 162–7. - PubMed
    1. Birn RM, Diamond JB, Smith MA, and Bandettini PA, Separating respiratory-variation-related fluctuations from neuronal-activity-related fluctuations in fMRI. Neuroimage, 2006. 31(4): p. 1536–48. - PubMed
    1. Behzadi Y, Restom K, Liau J, and Liu TT, A component based noise correction method (CompCor) for BOLD and perfusion based fMRI. NeuroImage, 2007. 37(1): p. 90–101. - PMC - PubMed
    1. Birn RM, Smith MA, Jones TB, and Bandettini PA, The respiration response function: the temporal dynamics of fMRI signal fluctuations related to changes in respiration. Neuroimage, 2008. 40(2): p. 644–54. - PMC - PubMed
    1. Kelley DJ, Oakes TR, Greischar LL, Chung MK, Ollinger JM, Alexander AL, Shelton SE, Kalin NH, Davidson RJ, and Greene E, Automatic Physiological Waveform Processing for fMRI Noise Correction and Analysis. PLoS ONE, 2008. 3(3): p. e1751. - PMC - PubMed

Publication types