

Epidemiology of dengue and the effect of seasonal climate variation on its dynamics: a spatio-temporal descriptive analysis in the Chao-Shan area on China's southeastern coast
- PMID: 31129573
- PMCID: PMC6538008
- DOI: 10.1136/bmjopen-2018-024197
Epidemiology of dengue and the effect of seasonal climate variation on its dynamics: a spatio-temporal descriptive analysis in the Chao-Shan area on China's southeastern coast
Abstract
Objective: Dengue is a mosquito-transmitted virus infection that remains rampant across the tropical and subtropical areas worldwide. However, the spatial and temporal dynamics of dengue transmission are poorly understood in Chao-Shan area, one of the most densely populated regions on China's southeastern coast, limiting disease control efforts. We aimed to characterise the epidemiology of dengue and assessed the effect of seasonal climate variation on its dynamics in the area.
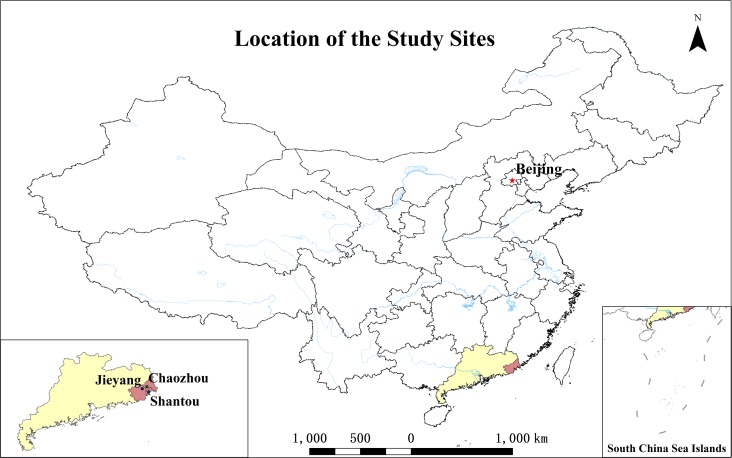
Design: A spatio-temporal descriptive analysis was performed in three cities including Shantou, Chaozhou and Jieyang in Chao-Shan area during the period of 2014-2017.
Setting: Data of dengue cases of three cities including Shantou, Chaozhou and Jieyang in Chao-Shan area during 2014-2017 were extracted. Data for climatic variables including mean temperature, relative humidity and rainfall were also compiled.
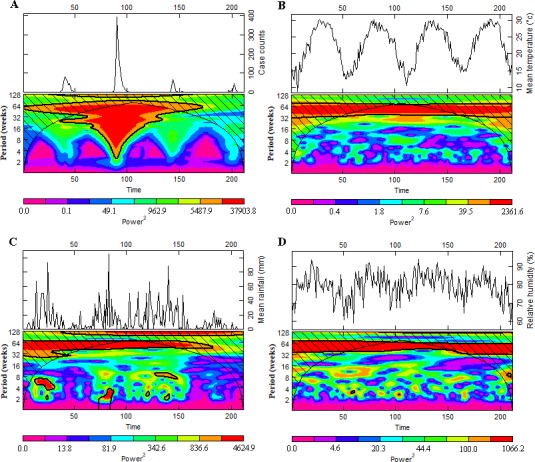
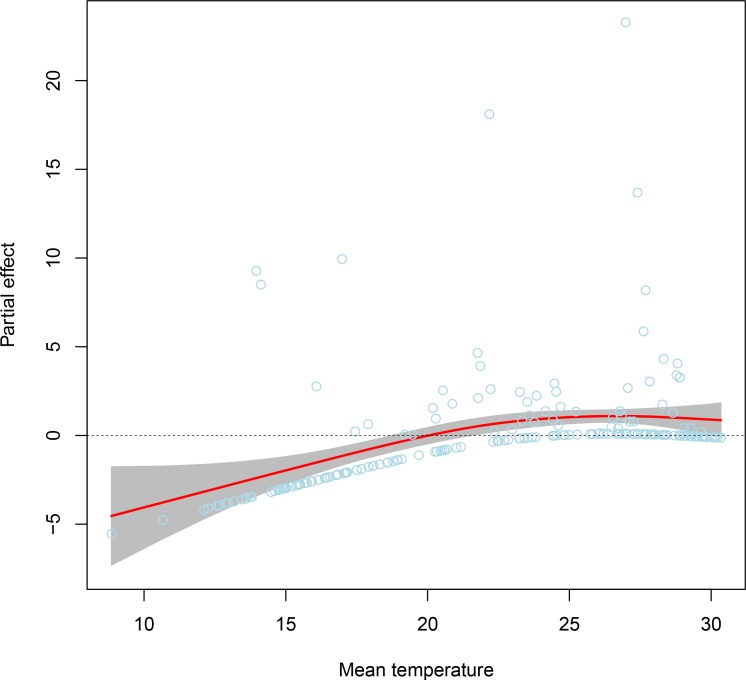
Methodology: The epidemiology and dynamics of dengue were initially depicted, and then the temporal dynamics related to climatic drivers was assessed by a wavelet analysis method. Furthermore, a generalised additive model for location, scale and shape model was performed to study the relationship between seasonal dynamics of dengue and climatic drivers.
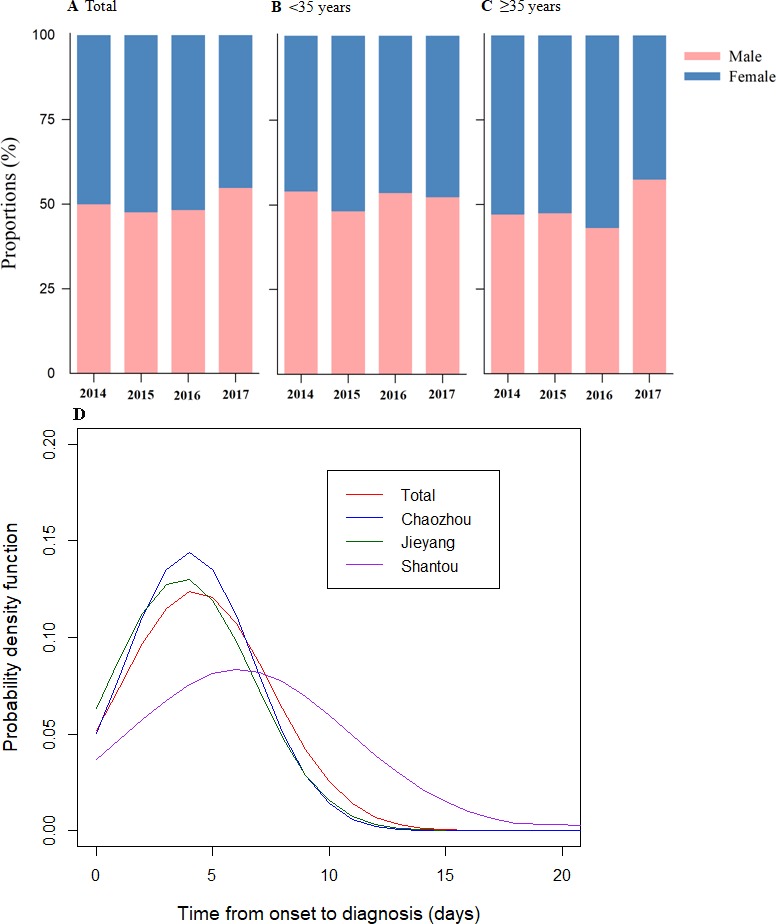
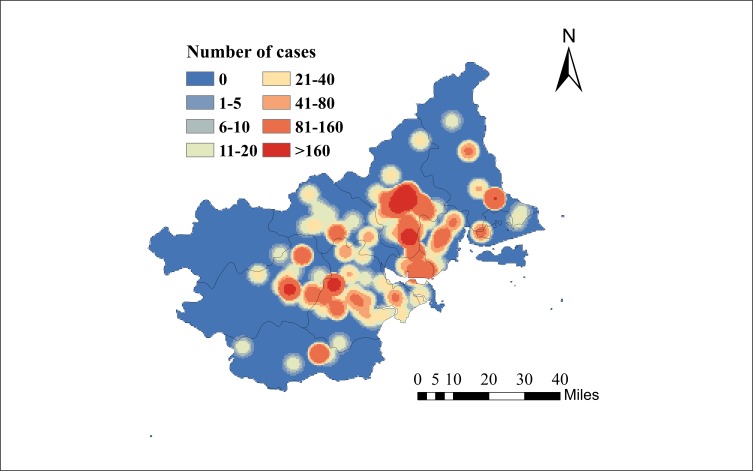
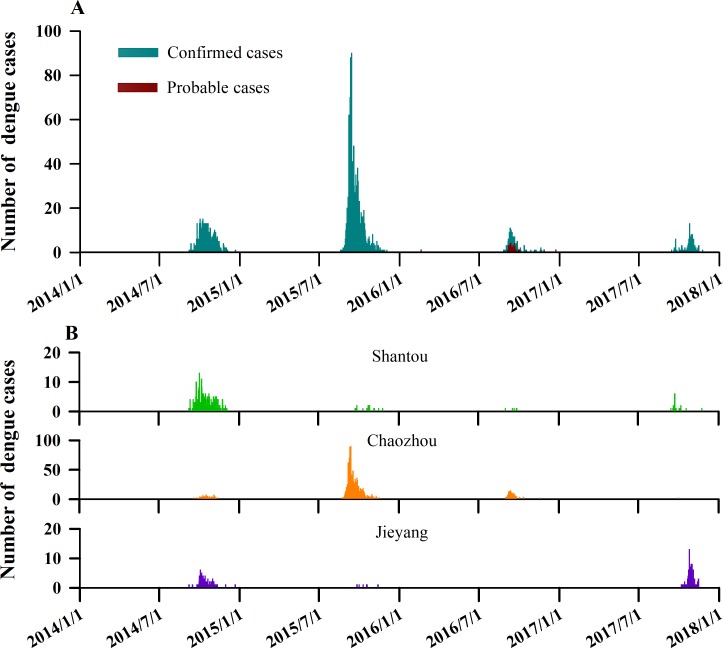
Results: Among the cities, the number of notified dengue cases in Chaozhou was greatest, accounting for 78.3%. The median age for the notified cases was 43 years (IQR: 27.0-58.0 years). Two main regions located in Xixin and Chengxi streets of Chaozhou with a high risk of infection were observed, indicating that there was substantial spatial heterogeneity in intensity. We found an annual peak incidence occurred in autumn across the region, most markedly in 2015. This study reveals that periods of elevated temperatures can drive the occurrence of dengue epidemics across the region, and the risk of transmission is highest when the temperature is between 25°C and 28°C.
Conclusion: Our study contributes to a better understanding of dengue dynamics in Chao-Shan area.
Keywords: China; climate; dengue; seasonal variation; spatial; wavelet analysis.
© Author(s) (or their employer(s)) 2019. Re-use permitted under CC BY-NC. No commercial re-use. See rights and permissions. Published by BMJ.
Conflict of interest statement
Competing interests: None declared.
Figures
References
-
- World Health Organization. Dengue: guidelines for diagnosis, treatment, prevention and control. Geneva: World Health Organization, 2009. - PubMed
Publication types
MeSH terms
LinkOut - more resources
Full Text Sources
Medical
Molecular Biology Databases