

Physiologically Based Pharmacokinetic Models for Prediction of Complex CYP2C8 and OATP1B1 (SLCO1B1) Drug-Drug-Gene Interactions: A Modeling Network of Gemfibrozil, Repaglinide, Pioglitazone, Rifampicin, Clarithromycin and Itraconazole
- PMID: 31129789
- PMCID: PMC6885506
- DOI: 10.1007/s40262-019-00777-x
Physiologically Based Pharmacokinetic Models for Prediction of Complex CYP2C8 and OATP1B1 (SLCO1B1) Drug-Drug-Gene Interactions: A Modeling Network of Gemfibrozil, Repaglinide, Pioglitazone, Rifampicin, Clarithromycin and Itraconazole
Abstract
Background: Drug-drug interactions (DDIs) and drug-gene interactions (DGIs) pose a serious health risk that can be avoided by dose adaptation. These interactions are investigated in strictly controlled setups, quantifying the effect of one perpetrator drug or polymorphism at a time, but in real life patients frequently take more than two medications and are very heterogenous regarding their genetic background.
Objectives: The first objective of this study was to provide whole-body physiologically based pharmacokinetic (PBPK) models of important cytochrome P450 (CYP) 2C8 perpetrator and victim drugs, built and evaluated for DDI and DGI studies. The second objective was to apply these models to describe complex interactions with more than two interacting partners.
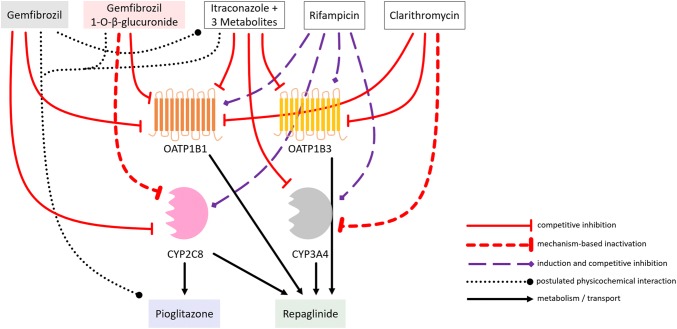
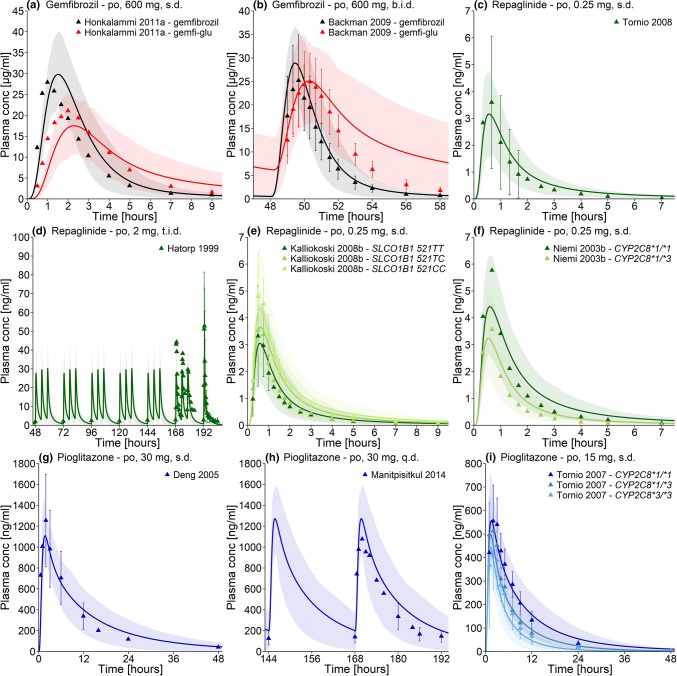
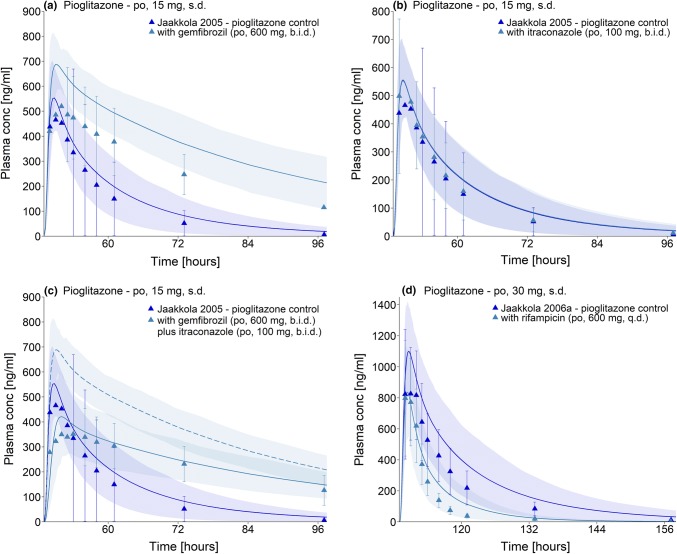
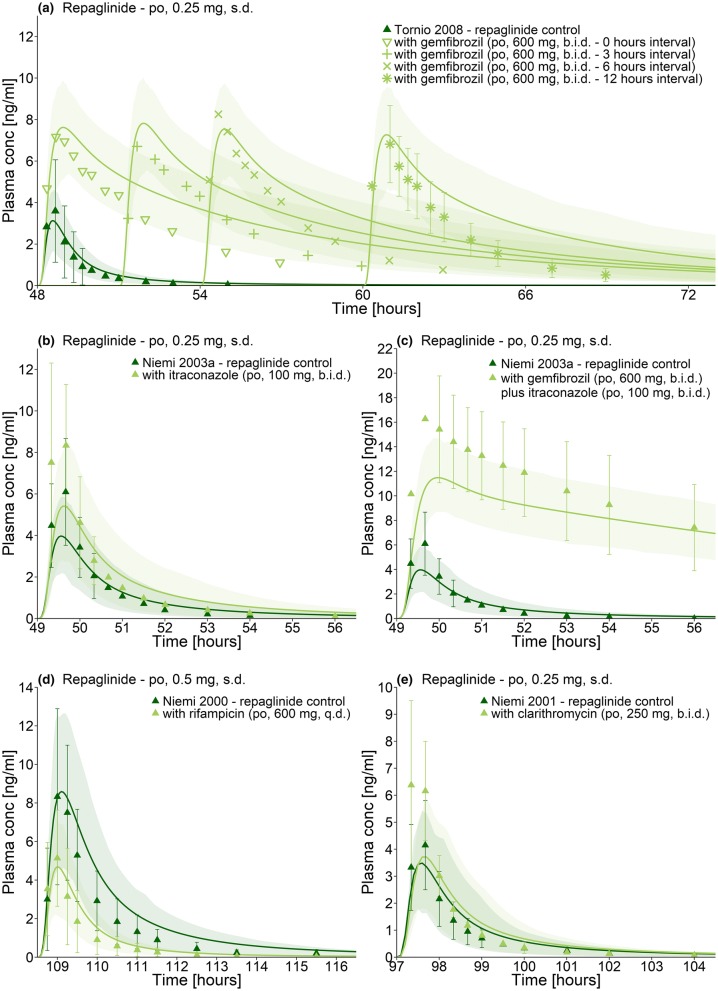
Methods: PBPK models of the CYP2C8 and organic-anion-transporting polypeptide (OATP) 1B1 perpetrator drug gemfibrozil (parent-metabolite model) and the CYP2C8 victim drugs repaglinide (also an OATP1B1 substrate) and pioglitazone were developed using a total of 103 clinical studies. For evaluation, these models were applied to predict 34 different DDI studies, establishing a CYP2C8 and OATP1B1 PBPK DDI modeling network.
Results: The newly developed models show a good performance, accurately describing plasma concentration-time profiles, area under the plasma concentration-time curve (AUC) and maximum plasma concentration (Cmax) values, DDI studies as well as DGI studies. All 34 of the modeled DDI AUC ratios (AUC during DDI/AUC control) and DDI Cmax ratios (Cmax during DDI/Cmax control) are within twofold of the observed values.
Conclusions: Whole-body PBPK models of gemfibrozil, repaglinide, and pioglitazone have been built and qualified for DDI and DGI prediction. PBPK modeling is applicable to investigate complex interactions between multiple drugs and genetic polymorphisms.
Conflict of interest statement
Sebastian Frechen, Thomas Eissing, and Thomas Wendl are employees and potential shareholders of Bayer AG. No potential conflicts of interest were disclosed by the other authors (Denise Türk, Nina Hanke, Sarah Wolf, Matthias Schwab, and Thorsten Lehr).
Figures

Similar articles
-
Analysis of the repaglinide concentration increase produced by gemfibrozil and itraconazole based on the inhibition of the hepatic uptake transporter and metabolic enzymes.Drug Metab Dispos. 2013 Feb;41(2):362-71. doi: 10.1124/dmd.112.049460. Epub 2012 Nov 8. Drug Metab Dispos. 2013. PMID: 23139378
-
Mechanistic modeling to predict the transporter- and enzyme-mediated drug-drug interactions of repaglinide.Pharm Res. 2013 Apr;30(4):1188-99. doi: 10.1007/s11095-012-0956-5. Epub 2013 Jan 10. Pharm Res. 2013. PMID: 23307347
-
Physiologically Based Pharmacokinetic Modeling of Rosuvastatin to Predict Transporter-Mediated Drug-Drug Interactions.Pharm Res. 2021 Oct;38(10):1645-1661. doi: 10.1007/s11095-021-03109-6. Epub 2021 Oct 18. Pharm Res. 2021. PMID: 34664206 Free PMC article.
-
Effects of CYP2C8 and SLCO1B1 Genetic Polymorphisms on Repaglinide Pharmacokinetics: A Systematic Review and Meta-Analysis.Curr Drug Metab. 2019;20(4):266-274. doi: 10.2174/1389200220666190111114146. Curr Drug Metab. 2019. PMID: 30636597
-
Drug-drug and food-drug pharmacokinetic interactions with new insulinotropic agents repaglinide and nateglinide.Clin Pharmacokinet. 2007;46(2):93-108. doi: 10.2165/00003088-200746020-00001. Clin Pharmacokinet. 2007. PMID: 17253883 Review.
Cited by
-
Evaluation for Potential Drug-Drug Interaction of MT921 Using In Vitro Studies and Physiologically-Based Pharmacokinetic Models.Pharmaceuticals (Basel). 2021 Jul 7;14(7):654. doi: 10.3390/ph14070654. Pharmaceuticals (Basel). 2021. PMID: 34358080 Free PMC article.
-
Physiologically Based Pharmacokinetic (PBPK) Modeling of Clopidogrel and Its Four Relevant Metabolites for CYP2B6, CYP2C8, CYP2C19, and CYP3A4 Drug-Drug-Gene Interaction Predictions.Pharmaceutics. 2022 Apr 22;14(5):915. doi: 10.3390/pharmaceutics14050915. Pharmaceutics. 2022. PMID: 35631502 Free PMC article.
-
Cytochrome P450 Enzymes and Drug Metabolism in Humans.Int J Mol Sci. 2021 Nov 26;22(23):12808. doi: 10.3390/ijms222312808. Int J Mol Sci. 2021. PMID: 34884615 Free PMC article. Review.
-
A Physiologically-Based Pharmacokinetic Model of Trimethoprim for MATE1, OCT1, OCT2, and CYP2C8 Drug-Drug-Gene Interaction Predictions.Pharmaceutics. 2020 Nov 10;12(11):1074. doi: 10.3390/pharmaceutics12111074. Pharmaceutics. 2020. PMID: 33182761 Free PMC article.
-
Data Digitizing: Accurate and Precise Data Extraction for Quantitative Systems Pharmacology and Physiologically-Based Pharmacokinetic Modeling.CPT Pharmacometrics Syst Pharmacol. 2020 Jun;9(6):322-331. doi: 10.1002/psp4.12511. Epub 2020 Jun 16. CPT Pharmacometrics Syst Pharmacol. 2020. PMID: 32543786 Free PMC article. Review.
References
-
- European Medicines Agency. Guideline on the investigation of drug interactions. London: EMA; 2015. https://www.ema.europa.eu/en/documents/scientific-guideline/guideline-in.... Accessed 1 Mar 2019.
Publication types
MeSH terms
Substances
LinkOut - more resources
Full Text Sources
