. 2019 Jun 20;74(6):1264-1277.e7.
doi: 10.1016/j.molcel.2019.04.010. Epub 2019 May 23.

Cyclin F Controls Cell-Cycle Transcriptional Outputs by Directing the Degradation of the Three Activator E2Fs

Affiliations

Cyclin F Controls Cell-Cycle Transcriptional Outputs by Directing the Degradation of the Three Activator E2Fs

Linda Clijsters et al. Mol Cell. .

Abstract

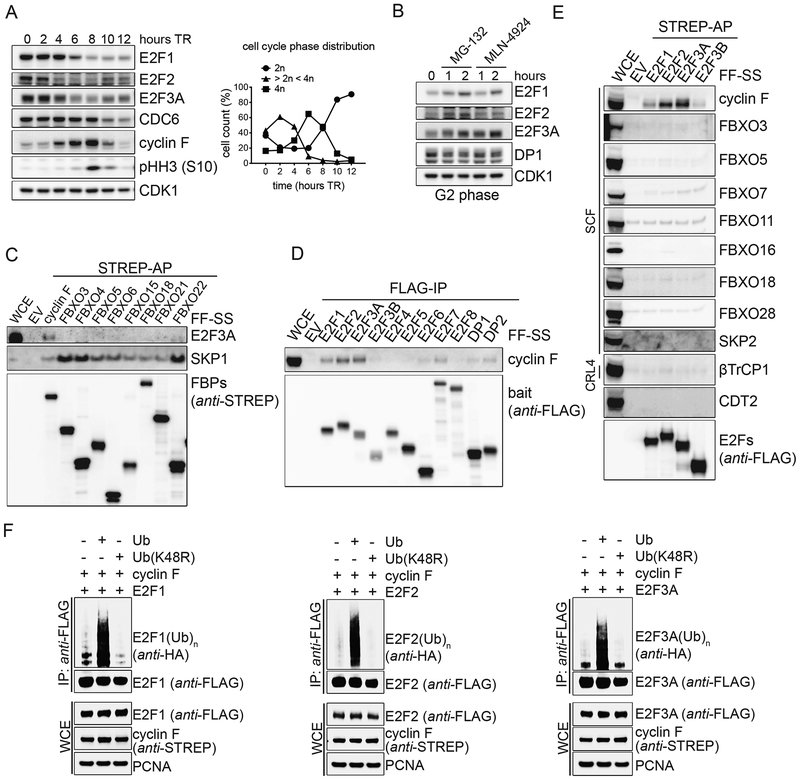
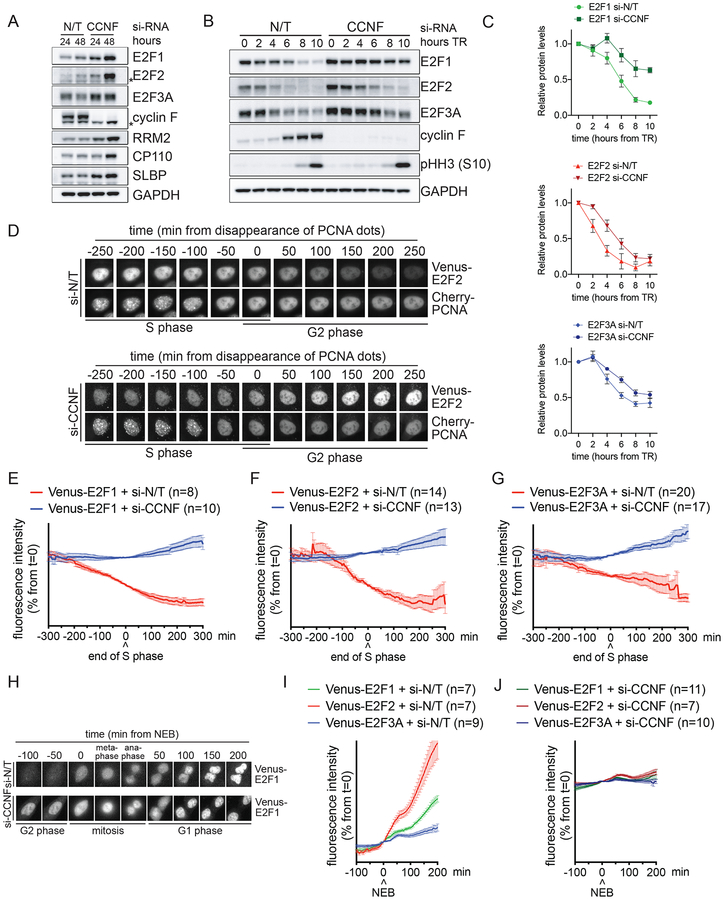
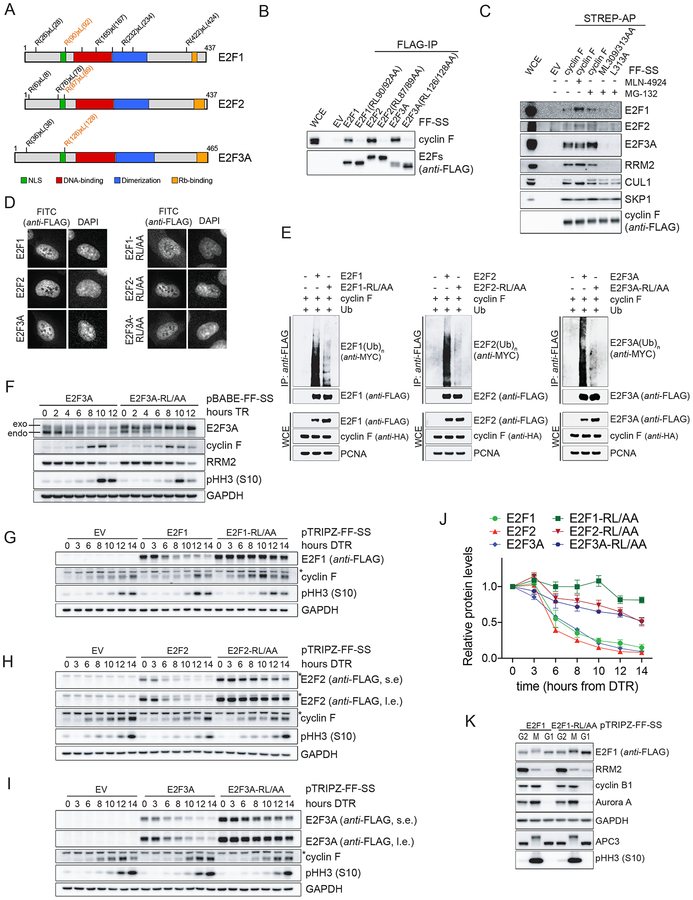
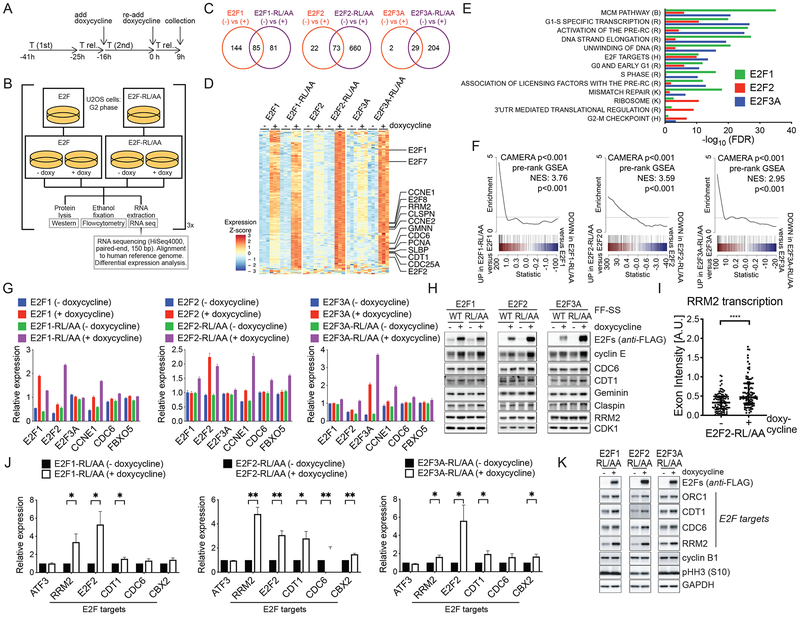
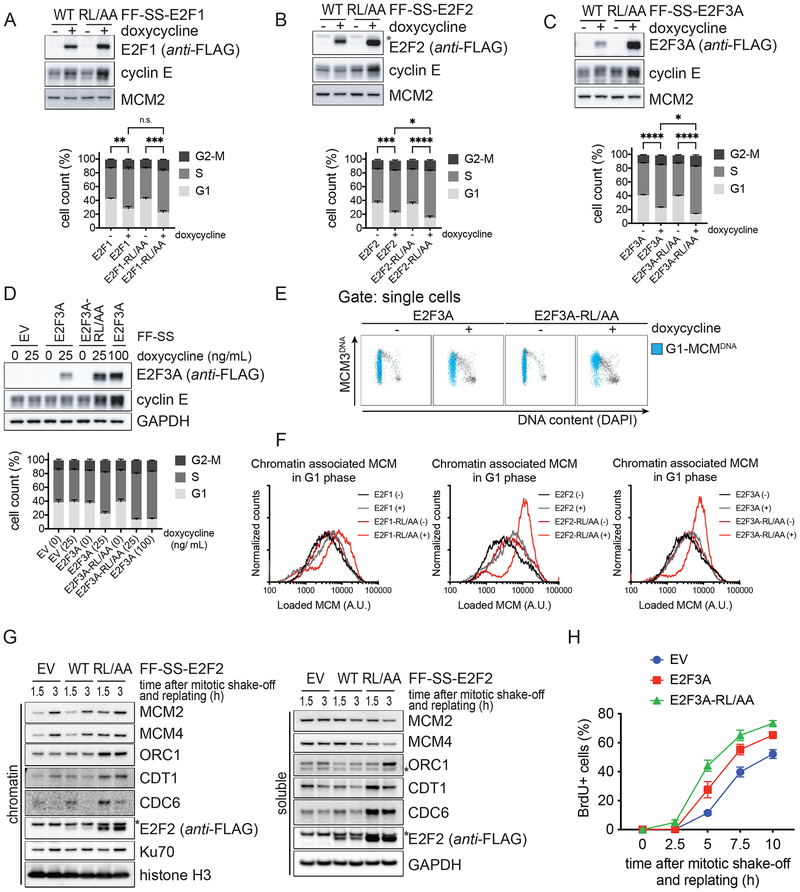
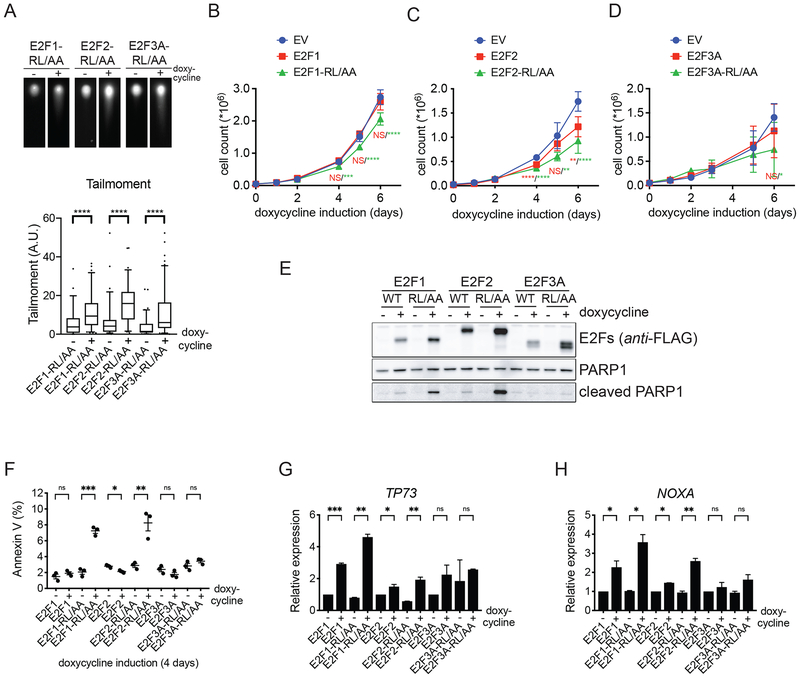
E2F1, E2F2, and E2F3A, the three activators of the E2F family of transcription factors, are key regulators of the G1/S transition, promoting transcription of hundreds of genes critical for cell-cycle progression. We found that during late S and in G2, the degradation of all three activator E2Fs is controlled by cyclin F, the substrate receptor of 1 of 69 human SCF ubiquitin ligase complexes. E2F1, E2F2, and E2F3A interact with the cyclin box of cyclin F via their conserved N-terminal cyclin binding motifs. In the short term, E2F mutants unable to bind cyclin F remain stable throughout the cell cycle, induce unscheduled transcription in G2 and mitosis, and promote faster entry into the next S phase. However, in the long term, they impair cell fitness. We propose that by restricting E2F activity to the S phase, cyclin F controls one of the main and most critical transcriptional engines of the cell cycle.

Keywords: E2F1; E2F2; E2F3A; F-box proteins; RNA-seq; SCF ligases; cell cycle; cyclin F; retinoblastoma; ubiquitin.


Conflict of interest statement

Declaration of Interests

M.P. is a member of the scientific advisory boards of CullGen Inc. and Kymera Therapeutics, and a consultant for BeyondSpring Pharmaceutical.

Figures

Figure 1.
Figure 1.. E2F1, E2F2, and E2F3A bind to and are ubiquitylated by cyclin F
A. RPE-1 cells were synchronized in G1/S by a thymidine block and then released in fresh medium for the indicated hours. Cells were collected and processed for FACS analysis (Fig. S1A), and Western blot. The graph on the right summarizes the results of the FACS analysis. TR, thymidine block and release. B. RPE-1 cells were synchronized in G2 by a thymidine block followed by a release in fresh medium for 8 hours, and treated with either MG-132 or MLN-4924 for the indicated hours. Cells were then collected, lysed and immunoblotted. C. HEK-293T cells were transfected with an empty vector (EV) or the indicated STREP-tagged F-box protein constructs (FBPs). Whole cell extracts (WCEs) were subjected to affinity-purification (AP) with Streptavidin resin and immunoblotted. D. HEK-293T cells were transfected with an EV or constructs expressing FLAG-tagged members of the E2F transcription factor family and their hetero-dimerization partners. WCEs were subjected to immune-purification (IP) with an anti-FLAG resin and immunoblotted. E. The experiment was performed as in (C), except that HEK-293T cells were transfected with the indicated constructs. F. HEK-293T cells were co-transfected with FLAG-tagged activator E2Fs, STREP-tagged cyclin F, and either HA-tagged Ubiquitin or Ubiquitin(K48R) mutant. WCEs were subjected to IP with an anti-FLAG resin under denaturing conditions and immunoblotted.
Figure 2.
Figure 2.. The degradation of E2F1/2/3A in late S and in G2 is mediated by cyclin F
A. U2OS cells were transfected with either a non-targeting (N/T) si-RNA or CCNF si-RNA for the indicated hours. Cells were then collected and processed for FACS analysis (Fig. S2A), qRT-PCR (Fig. S2B) and Western blot. The asterisks indicate non-specific bands. B. RPE-1 cells were transfected with either a N/T si-RNA or CCNF si-RNA, synchronized by a TR for the indicated hours. Cells were then collected and processed for FACS analysis (Fig. S2E) and Western blot. C. Quantification of the densitometric intensity of four independent experiments, included that shown in (B) represented as percentage change compared to time 0 (mean ± SEM). D. Live U2OS cells stably co-expressing Cherry-PCNA and Venus-E2F2 were imaged by fluorescence microscopy. Still images of control cells (upper panel) and cells treated with CCNF si-RNA (bottom panel) are shown at the indicated times. E-G. Live U2OS cells stably co-expressing Cherry-PCNA and either Venus-E2F1 (E), Venus-E2F2 (F) or Venus-E2F3A (G) were imaged by fluorescence microscopy in three independent experiments. The intensity of fluorescence was plotted against the time from the disappearance of PCNA dots (time 0). The graphs show the average fluorescence (mean ± SEM) of individual cells after transfection with CCNF si-RNA (blue) compared to N/T si-RNA (red). H. Live U2OS cells stably co-expressing Cherry-PCNA and Venus-E2F1 were imaged by fluorescence microscopy. Still images of control cells (upper panel) and cells treated with CCNF si-RNA (bottom panel) are shown at the indicated times. I-J. Live U2OS cells stably co-expressing Cherry-PCNA and Venus-E2F1 (green), Venus-E2F2 (red) or Venus-E2F3A (blue) were imaged by fluorescence microscopy in three independent experiments. The intensity of fluorescence was plotted against the time from nuclear envelope breakdown (NEB) (time 0). The graphs show the average fluorescence (mean ± SEM) of all individual cells after transfection with N/T si-RNA (I) or CCNF si-RNA (J).
Figure 3.
Figure 3.. Conserved N-terminal CY motifs are required for the binding of E2F1/2/3A to cyclin F and their degradation in S and G2
A. Schematic representation of activator E2Fs. Potential CY motifs are indicated. Functional CY motifs are indicated in orange. B. The experiment was performed as in (1D), except that HEK-293T cells were transfected with the indicated constructs. C. The experiment was performed as in (1C), except that HEK-293T cells were transfected with the indicated constructs. D. RPE-1 cells were transduced with lentiviruses expressing FLAG-FLAG-STREP-STREP (FF-SS)-tagged WT activating E2Fs, or their respective E2F-RL/AA mutants under the control of a doxycycline-inducible promoter. Cells were treated with doxycycline and, 24 hours later, processed for immune-fluorescence microscopy. E. HEK-293T cells were co-transfected with MYC-tagged Ubiquitin, HA-tagged cyclin F, and either FLAG-tagged WT activator E2Fs, or the E2F-RL/AA mutants. WCEs were subjected to IP with an anti-FLAG resin under denaturing conditions and immunoblotted. F. RPE-1 cells stably expressing FF-SS-tagged WT E2F3A or E2F3A-RL/AA were synchronized in G1/S by a TR for the indicated hours. Cells were collected, lysed, and immunoblotted. G-H-I. U2OS cells were transduced with lentiviruses expressing an EV or FF-SS-tagged WT E2F1 (G), E2F2 (H), E2F3A (I) or their respective E2F-RL/AA mutants under the control of a doxycycline-inducible promoter. Cells were synchronized in G1/S by a double-TR (DTR) for the indicated hours. Doxycycline was added during the second thymidine block and not re-added after release from the block. Cells were collected, lysed, and immunoblotted. (l.e., long exposure; s.e., short exposure). J. Quantification of the densitometric intensity of three independent experiments, included that shown in (G-I), represented as percentage change compared to time 0 (mean ± SEM). K. U2OS cells expressing doxycycline inducible E2F1 or E2F1-RL/AA were synchronized in G1/S by a TR in the presence of nocodazole and doxycycline for the last 16 hours. Mitotic cells (M) were collected by mitotic shake-off. Adherent cells were also collected (G2). A fraction of mitotic cells was released for 2 hours after nocodazole washout (G1). Cells were lysed and immunoblotted.
Figure 4.
Figure 4.. Stable E2F1/2/3A mutants deregulate the expression of E2F target genes in G2 and M
A-B. Experimental workflow: U2OS cells expressing either inducible activator WT E2Fs or E2F-RL/AA mutants were synchronized in G2 phase by a DTR for 9 hours. Doxycycline was added during the second thymidine block and re-added after release from the block. Cells were collected and processed for FACS analysis (Fig. S4A–C), RNA sequencing (C-F), qRT-PCR (G), and Western blot (H). n = 3 biologically independent experiments. C. Venn diagrams of differentially expressed genes (doxycycline treated versus doxycycline untreated; adjusted p-value < 0.05, |log2(fold change)| > 1) for each E2F construct. D. Expression heatmap of genes differentially induced in E2F-RL/AA versus WT E2F samples (adjusted p-value < 0.05, |log2(fold change)| > log2(1.25); up to 100 most significant genes per E2F gene analysis plotted). Expression values (variance-stabilized for each E2F analysis and, for E2F3A analysis, adjusted for variation-covariates, details in Methods) were Z-scaled per each experiment. Genes of particular interest are indicated. Triplicate samples appear in grouped columns. E. Bar plots of gene set enrichment testing (CAMERA) results. Data are shown for the top 10 most significant (by adjusted p-value) gene sets differentially induced by the expression of E2F-RL/AA mutants relative to corresponding WT E2Fs expression in independent E2F1, E2F2, and E2F3A analyses. Comprehensive results are presented in Table S4. F. Barcode plots depicting differential enrichment of an E2F target gene-set (Ren et al., 2002) (see Table S5) for each E2F analysis (E2F-RL/AA induction versus WT E2F induction). Color bar represents all genes ranked by differential expression statistic (F statistic, directional by fold change) for the indicated contrast. E2F target gene set members are indicated in black lines. Line plot displays sliding average of gene set enrichment. Corresponding CAMERA and pre-ranked GSEA p-values for E2F target gene set enrichment appear on each plot. G. qRT-PCR of indicated transcripts. H. Western blot of indicated proteins. I. RPE-1 cells expressing inducible E2F2-RL/AA were synchronized in G2 by a TR for 9 hours. Doxycycline was added after release from the thymidine block. Cells were processed for RNA FISH and hybridized with RRM2-exon and RRM2-intron specific probe sets. Results are from a representative experiment out of two repeats. The scatter dot plot shows the exon intensity at individual loci (median ± interquartile range; Wilcoxon-Mann-Whitney test). J-K. U2OS cells expressing inducible E2F-RL/AA mutants were synchronized in mitosis by a 16-hour treatment with nocodazole in the presence of doxycycline. Mitotic cells were collected by mitotic shake-off and processed for FACS analysis (Fig. S4G), qRT-PCR (J) and Western blot (K). Random hexamer-primed cDNAs were prepared from the isolated RNA and analyzed by qRT-PCR for the levels of the indicated transcripts, and the significance of differences in E2F targets calculated (mean ± SEM; Multiple t-tests without correction for multiple comparisons). Primary transcripts were detected using intron-exon-directed primers (Fig. S4D). (J) shows the relative expression of primary transcript levels as the ratio Target over GAPDH, corrected for PCR primer efficiency.
Figure 5.
Figure 5.. Stable E2F1/2/3A mutants deregulate cell cycle progression
A-C. U2OS cells expressing inducible activator E2Fs or corresponding E2F-RL/AA mutants were treated with or without doxycycline and, 24 hours later, pulsed with BrdU and processed for Western blot (top) and FACS analysis (bottom). BrdU incorporation and propidium iodide (PI) staining were analyzed using flow cytometry. The bar graph shows the percentage of cells in the different cell cycle phases from five independent experiments (mean ± SEM; Ordinary one-way ANOVA and Holm-Sidak’s multiple comparisons test, on S-phase population). D. The experiment was performed as in (C) using the indicated amounts of doxycycline. E. U2OS cells expressing inducible E2F3A or E2F3A-RL/AA were treated with doxycycline and, two days later, pulsed with EdU and processed for chromatin flow cytometry. EdU incorporation, DAPI-, and DNA-loaded MCM3-staining were analyzed using flow cytometry. Cells with DNA-bound MCM3 in G1 are indicated in blue. F. Histograms of G1 cells that contain DNA-loaded MCM represent the quantification of four independent experiments. G. U2OS cells expressing EV, inducible E2F2, or inducible E2F2-RL/AA were synchronized as in (3K). Mitotic cells were harvested by mitotic shake-off, released from the block, and replated in fresh medium without doxycycline. At the indicated time points, cells were collected, and processed for chromatin-fractionation and Western blot. H. U2OS cells expressing EV, inducible E2F3A, or inducible E2F3A-RL/AA were synchronized as in (3K), except that BrdU was added 2 hours after replating. At the indicated time points, cells were collected, and processed for Western blot (Fig. S5I) and FACS analysis to measure BrdU incorporation and PI staining. The graphs show the percentage of cells entering S phase as observed by BrdU positivity from three independent experiments (mean ± SEM).
Figure 6.
Figure 6.. Prolonged expression of stable E2F1/2/3A mutants impairs cell fitness
A. U2OS cells expressing inducible E2F-RL/AA mutants were treated with doxycycline for two days, collected, and processed for a neutral comet assay. Top panels, representative images of comets. The box plot (bottom) shows the quantification of tailmoment of a representative experiment out of three repeats (median ± interquartile range, and 5–95% whiskers; two-tailed Wilcoxon-Mann-Whitney test). B-D. U2OS cells expressing EV, inducible activator E2Fs, or E2F-RL/AA mutants were treated with doxycycline for the indicated days, collected, and counted. Proliferation was plotted as the number of cells (mean ± SEM; n = 2 independent experiments with technical triplicates; One-way ANOVA with multiple comparisons to EV and Dunnett’s multiple comparisons test). E. U2OS cells expressing inducible activator E2Fs, or E2F-RL/AA mutants were treated with doxycycline for three days, collected, and processed for Western blot. F. U2OS cells expressing inducible activator E2Fs or E2F-RL/AA mutants were treated with doxycycline for four days, collected and processed for Annexin V/PI staining. The graph shows the percentage of apoptotic cells as observed by Annexin V (mean ± SEM; n = 3 independent experiments; Multiple t-tests without correction for multiple comparisons). G-H. U2OS cells expressing inducible activator E2Fs or E2F-RL/AA mutants were treated with doxycycline for three days, collected and total RNA was isolated. PolyAAA-primed cDNAs were prepared from the RNA and analyzed by qRT-PCR for the levels of TP73 (G) and NOXA (H) transcripts. Relative expression of mRNA levels was indicated as the ratio Target over GAPDH, and corrected for PCR primer efficiency (mean ± SEM; representative out of two repeats; Multiple t-tests without correction for multiple comparisons).

References

    1. Anders S, Pyl P, and Huber W (2015). HTSeq-A Python framework to work with high-throughput sequencing data. Bioinformatics 31, 166–169. - PMC - PubMed
    1. Bagchi S, Weinmann R, and Raychaudhuri P (1991). The retinoblastoma protein copurifies with E2F-I, an E1A-regulated inhibitor of the transcription factor E2F. Cell 65, 1063–1072. - PubMed
    1. Bai C, Richman R, and Elledge SJ (1994). Human cyclin F. EMBO J. 13, 6087–6098. - PMC - PubMed
    1. Bandara LR, Buck VM, Zamanian M, Johnston LH, and La TN (1993). Functional synergy between DP-1 and E2F-1 in the cell cycle-regulating transcription factor DRTF1/E2F. Embo J 12, 4317–4324. - PMC - PubMed
    1. Benjamini Y, and Hochberg Y (1995). Controlling the False Discovery Rate: A practical and powerful approach to multiple testing. J Royal Stat Soc 57, 289–300.

Publication types

MeSH terms