. 2019 Jun 13;177(7):1915-1932.e16.
doi: 10.1016/j.cell.2019.04.040. Epub 2019 May 23.

A Cellular Taxonomy of the Bone Marrow Stroma in Homeostasis and Leukemia

Affiliations

A Cellular Taxonomy of the Bone Marrow Stroma in Homeostasis and Leukemia

Ninib Baryawno et al. Cell. .

Abstract

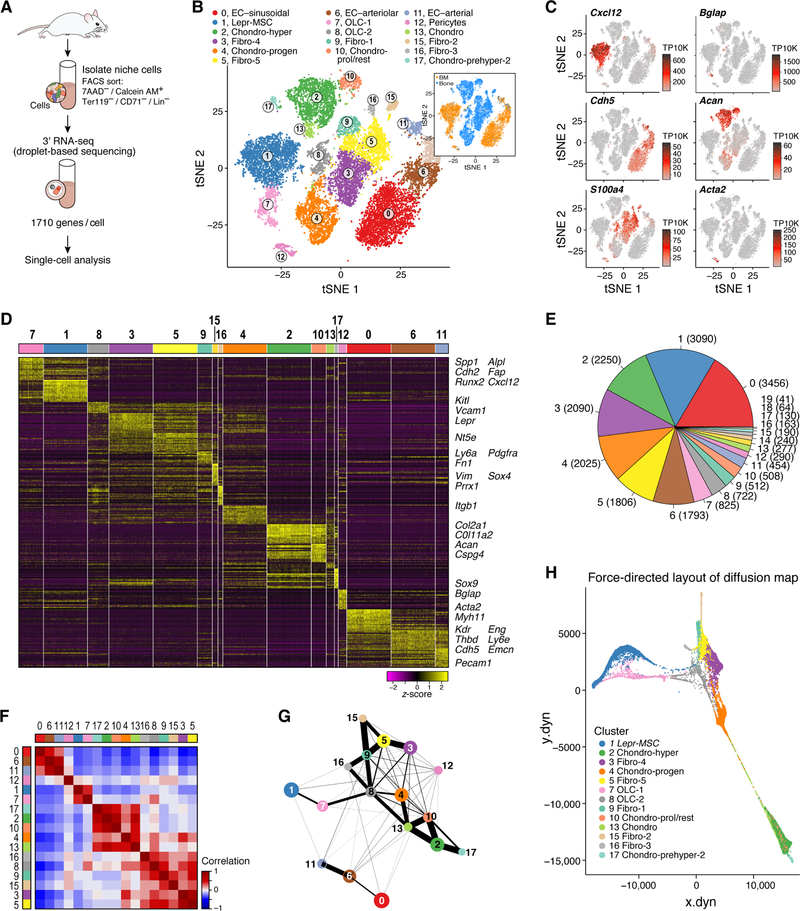
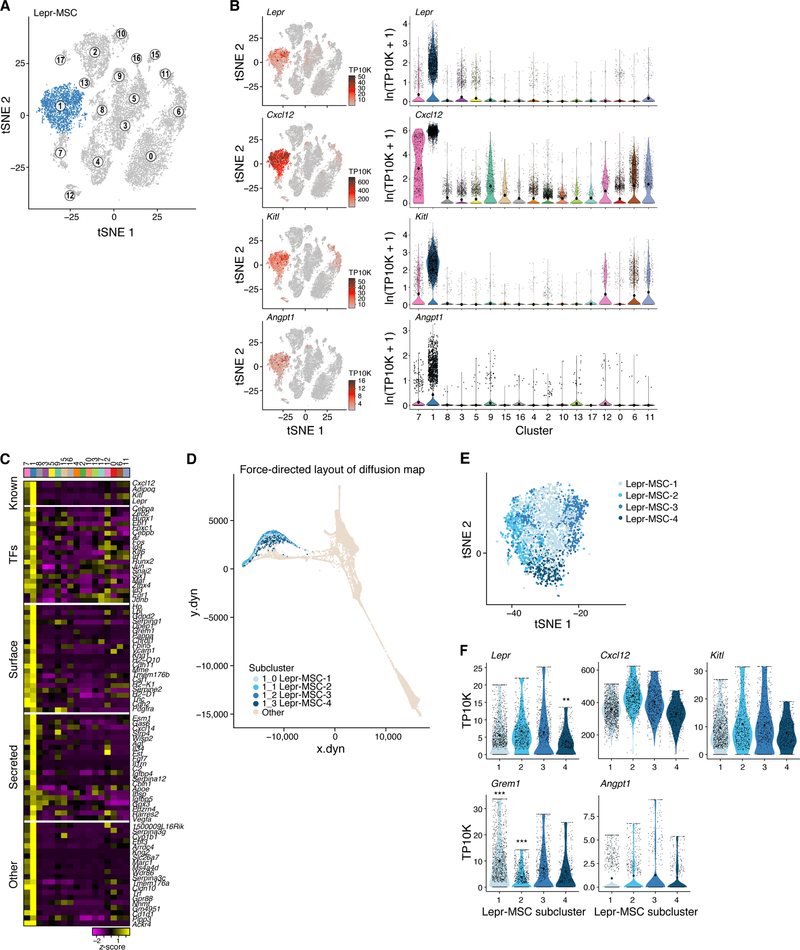
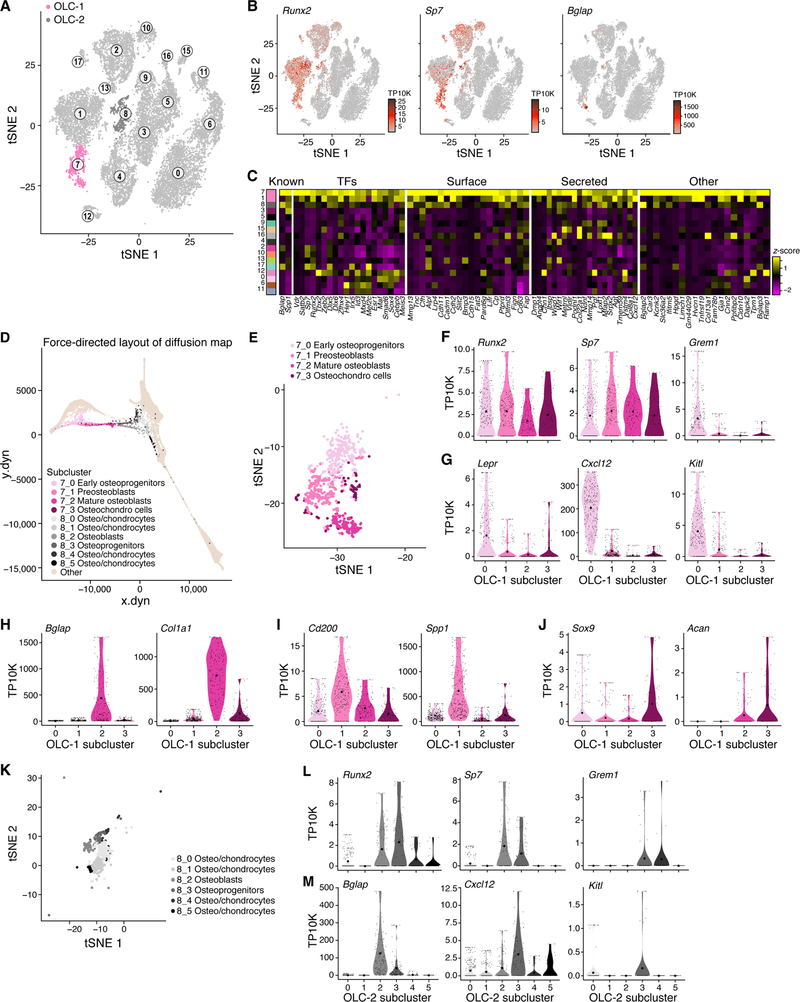
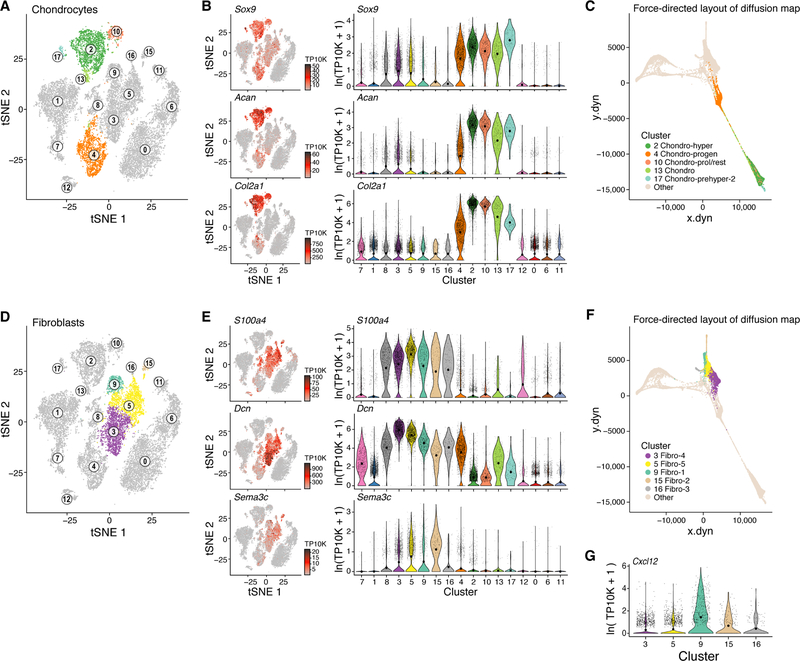
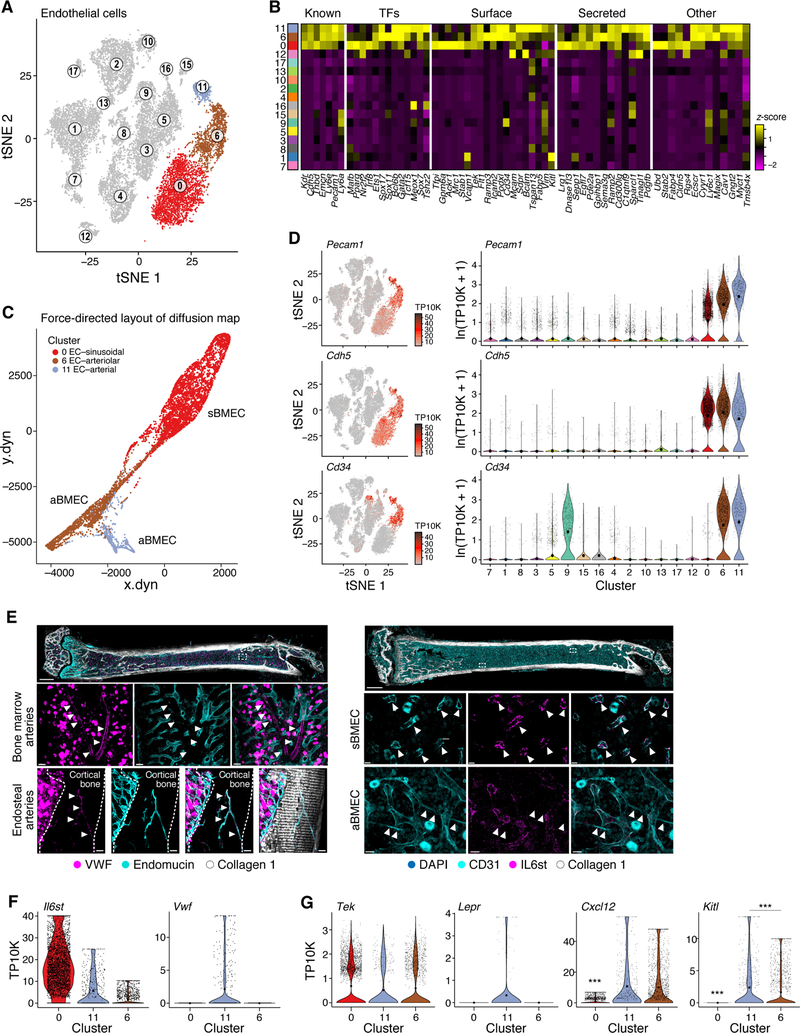
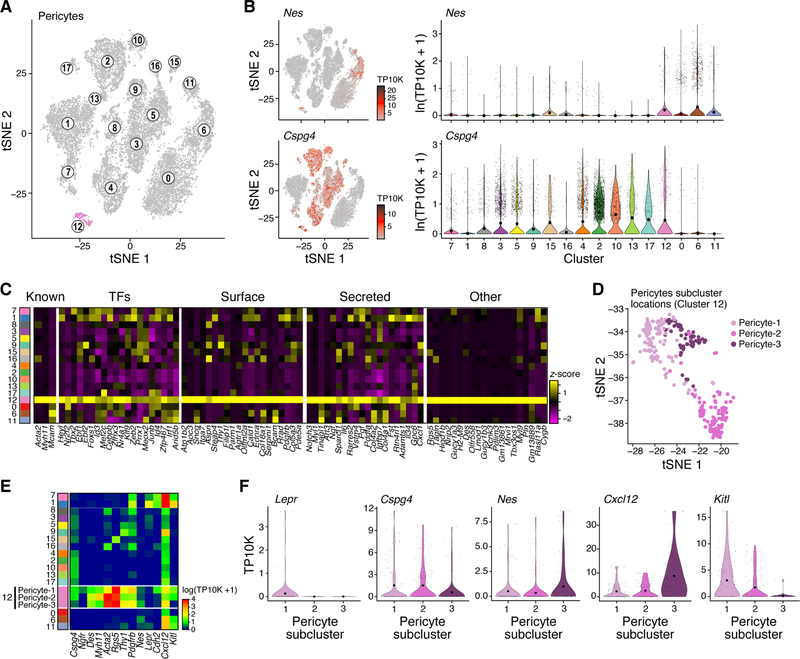
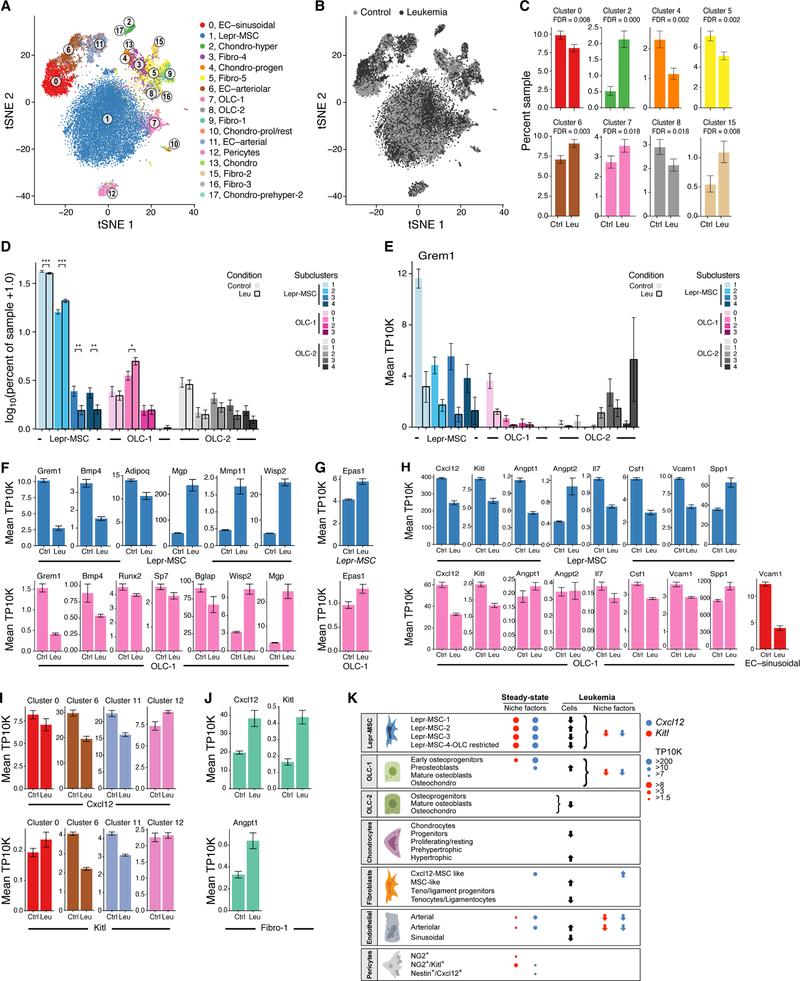
Stroma is a poorly defined non-parenchymal component of virtually every organ with key roles in organ development, homeostasis, and repair. Studies of the bone marrow stroma have defined individual populations in the stem cell niche regulating hematopoietic regeneration and capable of initiating leukemia. Here, we use single-cell RNA sequencing (scRNA-seq) to define a cellular taxonomy of the mouse bone marrow stroma and its perturbation by malignancy. We identified seventeen stromal subsets expressing distinct hematopoietic regulatory genes spanning new fibroblastic and osteoblastic subpopulations including distinct osteoblast differentiation trajectories. Emerging acute myeloid leukemia impaired mesenchymal osteogenic differentiation and reduced regulatory molecules necessary for normal hematopoiesis. These data suggest that tissue stroma responds to malignant cells by disadvantaging normal parenchymal cells. Our taxonomy of the stromal compartment provides a comprehensive bone marrow cell census and experimental support for cancer cell crosstalk with specific stromal elements to impair normal tissue function and thereby enable emergent cancer.

Keywords: bone marrow niche; hematopoiesis; leukemia; single-cell RNA-sequencing; stem cell; stroma; tumor microenvironment.


Conflict of interest statement

Declaration of Interests

D.T.S., director and shareholder of Magenta Therapeutics, Agios Pharmaceuticals, Editas Medicines, Clear Creek Bio, Red Oak Medicines and LifeVaultBio; a shareholder of Fate Therapeutics, a consultant for Magenta Therapeutics, Clear Creek Bio, Red Oak Medicines, VCanBio and a SAB member of FOG Pharma. A.R., a founder and equity holder of Celsius Therapeutics; a member of the SAB for ThermoFisher Scientific and Syros Pharmaceuticals. M.S.K., employed by Celsius Therapeutics. The authors have filed for patent (62/808,177).

Figures

Figure 1.
Figure 1.. A single cell atlas of the mouse bone marrow stroma.
(A) Study Overview. (B,C) Seventeen bone marrow stroma cell clusters. t-SNE of 20,896 nonhematopoietic cells (mixed bone and bone marrow fractions, n=6 mice), annotated post hoc and colored by clustering or bone (~10,000, non-hematopoietic cells, n=4 mice) or bone marrow (~10,000 non-hematopoietic cells, n=4 mice) location (insert) (B) or by expression (color bar, TP10K) of key cell type marker genes (C). (D) Cluster signature genes. Expression (row-wide z-score of ln(TP10K+1)) of top differentially expressed genes (rows) across the cells (columns) in each cluster (color bar, top, as in B). The largest clusters were down-sampled. Key genes highlighted on right. (E) Number of cells in each subset. Color bar as in B. (F–G) Differentiation relations between cells or clusters. (F) Pearson’s correlation (color bar) between the average gene expression profiles of clusters (rows, columns, color code as in B). (G) Relatedness (edges; width indicates strength) between clusters (nodes, colored as in B) based on cluster graph abstraction. (H) A force directed layout embedding (FLE) of the cells (dots) from a diffusion map (50 components) computed with the cells from strongly connected clusters (as indicated in G and F, without clusters 1, 6, 11, 12).
Figure 2.
Figure 2.. Four subsets of HSC regulator-producing Lepr-MSCs form a differentiation continuum.
(A–C) Signature genes for Lepr-MSCs in the stroma atlas. (A,B) tSNE of Figure 1B colored by cluster-1 membership (A), or by expression (color bar, TP10K) of key MSC marker genes (B, left) (right), along with the corresponding distributions of expression levels (ln(TP10K+1), y axis) across clusters of Figure 1B (x axis). (C) Expression (row-wide z-score of ln of average TP10K) of top differentially expressed genes (rows) in the cells of each cluster (columns) (color bar, top, as in Figure 1B), ordered by five gene categories (labels on left). (D–F) Four Lepr-MSC subclusters span a differentiation continuum. (D,E) Continuous transition across the subclusters. Four subclusters colored on the FLE of the diffusion map from Figure 1H (E) or on a zoom-in to the Lepr-MSC cluster in Figure 2A. (F) Distributions of expression levels (TP10K, y axis, censored scale) for select marker genes across the 4 subclusters. Stars for significant differential expression of select genes.
Figure 3.
Figure 3.. Two OLC subsets of distinct differentiation origins and hematopoietic support potential.
(A–C) Two OLC subsets. (A,B) tSNE of Figure 1B colored by cluster 7 (OLC-1) and cluster 8 (OLC-2) membership (A), or by expression (color bar, TP10K) of key OLC marker genes (B). (C) Expression (column-wide z-score of ln of average TP10K) of top differentially expressed genes (rows) ordered by four gene categories (labels on top) in the cells of each cluster (columns, color bar, left, as in Figure 1B). (D) Continuous transition across the subclusters. OLC-1 and OLC-2 subclusters color coded on the FLE of the diffusion map from Figure 1H (D). (E–J) OLC-1 subsets. (E) A zoom-in to OLC-1 in Figure 3A labeled by four subclusters and annotated post hoc (legend). (F–J) Distributions of expression levels (TP10K, y axis, censored scale) for select marker genes across the OLC-1 subclusters. (K–M) OLC-2 subsets. (K) A zoom-in to OLC-2 in Figure 3A labeled by six subclusters and annotated post hoc (legend). (L,M) Distributions of expression levels (TP10K, y axis, censored scale) for select marker genes across the OLC-2 subclusters.
Figure 4.
Figure 4.. Chondrocyte and fibroblasts subsets highlight differentiation paths and hematopoiesis support, respectively.
(A–C) Subsets across chondrocyte differentiation. (A,B) Signature genes for chondroid subsets. tSNE of Figure 1B colored by membership in five chondroid clusters (A), or by expression (color bar, TP10K) of key marker genes (B, left) (right), along with the distributions of expression levels (ln(TP10K+1), y axis) for the same genes across clusters of Figure 1B (x axis). (C) Continuous transition across the chondroid subclusters. The five subclusters colored on the FLE of the diffusion map from Figure 1H. (D–F) Fibroblast subsets. (D,E) Signature genes for fibroblast subsets. tSNE of Figure 1B colored by membership in five fibroblast clusters (A), or by expression (color bar, TP10K) of key marker genes (B, left) (right), along with the distributions of expression levels (ln(TP10K+1), y axis) for the same genes across the clusters of Figure 1B (x axis). (F) Relations between the fibroblast subclusters. The clusters colored on the FLE of the diffusion map from Figure 1H. (G) Distribution of Cxcl12 expression level (ln(TP10K+1), y axis) across the fibroblast clusters (x axis).
Figure 5.
Figure 5.. Arterial BMECs express higher levels of niche factors compared to sinusoidal and arteriolar vascular BMECs.
(A–B) Three BMEC subsets. (A,B) tSNE of Figure 1B colored by membership in three BMEC clusters (A), orexpression (column-wide z-score of ln of average TP10K) of top differentially expressed genes (columns) ordered by five gene categories (labels on top) in the cells of each cluster (rows, color bar, left, as in Figure 1B) (B). (C) Continuous transition across the subclusters. FLE of a diffusion map of BMECs, color coded by cluster membership. (D) Expression (color bar, TP10K) of key marker genes (D, right), along with the distributions of expression levels (ln(TP10K+1), y axis) for the same genes across clusters of Figure 1B (x axis) (D, left). (E) (left) VWF expression in endosteal arteries, but not sinusoids. (left-top) High magnification images of femoral diaphysis showing VWF expression by arteries (white arrowheads) in addition to megakaryocytes, but not endomucin-expressing sinusoids or central sinus (left bottom). Endosteal arteries (white arrowheads) marked by both VWF and endomucin. Bone surface is marked by Col.1 expression. Scale bars are 100um (full bone) 50um.(right) IL6st expression in venous, but not arteriolar endothelium. Full-bone imaging of femoral sections showing sinusoidal endothelium expressing both CD31 and IL6st (right-top), while arteriolar endothelium is only expressing CD31. Bone surface is marked by Col.1 expression. Scale bars are 700um (full bone), 15um (mid panel) and 20um (low panel). (F–G) Key marker genes. Distributions of expression levels (TP10K, y axis) for select genes across the three clusters (x axis).
Figure 6.
Figure 6.. Three distinct subpopulations of pericytes that vary in hematopoietic regulatory gene expression.
(A–C) Signature genes for Pericytes in the stroma atlas. (A,B) tSNE of Figure 1B colored by cluster-12 membership (A), or by expression (color bar, TP10K) of key pericyte marker genes (B, left) (right), along with the distributions of expression levels (ln(TP10K+1), y axis) for the same genes across the clusters of Figure 1B (x axis). (C) Expression (column-wide z-score of ln of average TP10K) of top differentially expressed genes (columns) in the cells of each cluster (rows) (color bar, left, as in Figure 1B), ordered by five gene categories (labels on left). (D) Pericyte subclusters color coded on the zoom-in of to the pericyte cluster from Figure 6A. (E) Average expression (ln(TP10K+1)) of select HSC niche genes (x axis) in clusters of Figure 1B (y axis). Three pericyte subclusters indicated. (F) Distributions of expression levels (TP10K, y axis, censored scale) for select marker genes across the subclusters.
Figure 7.
Figure 7.. Remodeling of the bone marrow stroma in leukemia.
(A,B) A census of the leukemic bone marrow stroma. tSNE of 23,004 cells (dots) from mice transplanted with control (n=5, 12,456 cells) or leukemia allele bearing (n=4, 10,548 cells) bone marrow colored by cluster assignment (as in Figure 1B), or by condition (control: light grey; leukemia: dark grey). (C,D) Compositional changes in bone marrow stroma. Binomial fit mean as percent of cells (y axis) assigned to specific cluster (C) or to Lepr-MSC and OLCs subclusters (D) among control or leukemic samples (x axis). Error bars: 95% confidence interval of the binomial fit mean. (E) Changes in Grem1 expression in Lepr-MSCs and OLCs. Average of samples (TP10K, y axis) in Lepr-MSC and OLC subclusters (x axis). Error bars: SEM. (F–H) Changes in niche remodeling, hypoxia and hematopoietic regulator genes in Lepr-MSCs, OLC-1s and sBMECs in leukemia. Average expression (TP10K, y axis) of niche genes in Lepr-MSCs (top) and OLC-1s (bottom). Error bars: SEM. (I,J) Changes in Cxcl12, Kitl and Angpt1 expression in BMECs, pericytes or fibroblasts. Average expression (TP10K, y axis) of the denoted genes in specific cell clusters. Error bars: SEM. (K) A census of the bone marrow stroma in homeostasis and leukemia. Horizontal boxes: broad cell types, with subsets noted. Circles: expression levels of key niche factors, Kitl and Cxcl12. Dark arrows: changes in subset proportion in Leukemia. Colored arrows: changes in relative expression in leukemia.

Comment in

References

    1. Abdallah BM, Al-Shammary A, Skagen P, Abu Dawud R, Adjaye J, Aldahmash A, and Kassem M (2015). CD34 defines an osteoprogenitor cell population in mouse bone marrow stromal cells. Stem cell research 15, 449–458. - PubMed
    1. Acar M, Kocherlakota KS, Murphy MM, Peyer JG, Oguro H, Inra CN, Jaiyeola C, Zhao Z, Luby-Phelps K, and Morrison SJ (2015). Deep imaging of bone marrow shows non-dividing stem cells are mainly perisinusoidal. Nature 526, 126–130. - PMC - PubMed
    1. Ahirwar DK, Nasser MW, Ouseph MM, Elbaz M, Cuitino MC, Kladney RD, Varikuti S, Kaul K, Satoskar AR, Ramaswamy B, et al. (2018). Fibroblast-derived CXCL12 promotes breast cancer metastasis by facilitating tumor cell intravasation. Oncogene. - PMC - PubMed
    1. Angerer P, Haghverdi L, Buttner M, Theis FJ, Marr C, and Buettner F (2016). destiny: diffusion maps for large-scale single-cell data in R. Bioinformatics 32, 1241–1243. - PubMed
    1. Arai F, Hirao A, Ohmura M, Sato H, Matsuoka S, Takubo K, Ito K, Koh GY, and Suda T (2004). Tie2/angiopoietin-1 signaling regulates hematopoietic stem cell quiescence in the bone marrow niche. Cell 118, 149–161. - PubMed

Publication types