. 2019 Aug 6;30(2):352-363.e8.
doi: 10.1016/j.cmet.2019.05.003. Epub 2019 May 23.

Polyamines and eIF5A Hypusination Modulate Mitochondrial Respiration and Macrophage Activation

Affiliations

Polyamines and eIF5A Hypusination Modulate Mitochondrial Respiration and Macrophage Activation

Daniel J Puleston et al. Cell Metab. .

Abstract

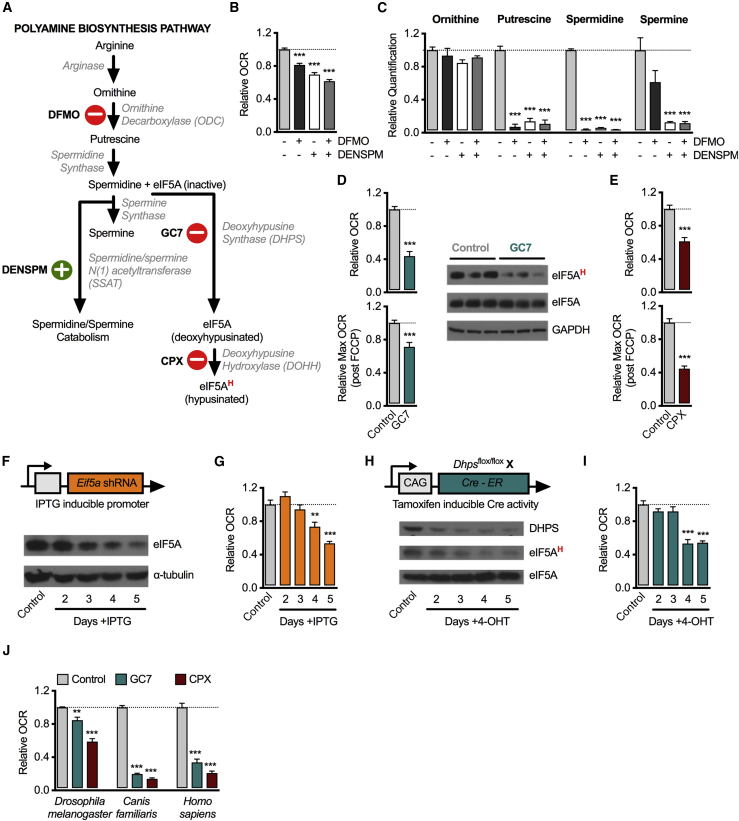
How cells adapt metabolism to meet demands is an active area of interest across biology. Among a broad range of functions, the polyamine spermidine is needed to hypusinate the translation factor eukaryotic initiation factor 5A (eIF5A). We show here that hypusinated eIF5A (eIF5AH) promotes the efficient expression of a subset of mitochondrial proteins involved in the TCA cycle and oxidative phosphorylation (OXPHOS). Several of these proteins have mitochondrial targeting sequences (MTSs) that in part confer an increased dependency on eIF5AH. In macrophages, metabolic switching between OXPHOS and glycolysis supports divergent functional fates stimulated by activation signals. In these cells, hypusination of eIF5A appears to be dynamically regulated after activation. Using in vivo and in vitro models, we show that acute inhibition of this pathway blunts OXPHOS-dependent alternative activation, while leaving aerobic glycolysis-dependent classical activation intact. These results might have implications for therapeutically controlling macrophage activation by targeting the polyamine-eIF5A-hypusine axis.

Keywords: deoxyhypusine hydroxylase; deoxyhypusine synthase; eIF5A; hypusination; immunometabolism; macrophage activation; metabolism; polyamines.


Conflict of interest statement

D.J.P. and E.L.P. have filed a provisional patent application: modulating activation of macrophages (M2 cells) through the polyamine-eIF5A-hypusine axis. E.L.P is a SAB member of ImmunoMet and a founder of Rheos Medicines. E.J.P. is a founder of Rheos Medicines.

Figures

None
Graphical abstract
Figure 1
Figure 1
The Polyamine Synthesis Pathway and Hypusinated eIF5A Modulates OXPHOS (A) The polyamine pathway comprises the cationic metabolites putrescine, spermidine, and spermine, which are synthesized downstream of the amino acid ornithine. Spermidine acts as a substrate for the hypusination of eIF5A, catalyzed by DHPS and DOHH. DFMO inhibits ODC, whereas DENSPM induces polyamine catabolism. Both GC7 and CPX inhibit hypusination. (B) Relative OCR of MEFs (NIH-3T3) incubated for 48 h with 2.5 mM DFMO ± 50 μM DENSPM assessed by Seahorse Extracellular Flux Analyzer (relative OCR = OCR of treated cells normalized to OCR of untreated control cells). (C) Intracellular ornithine, putrescine, spermidine, and spermine levels detected by LC-MS of MEFs treated as in (B). (D) Relative OCR, maximum OCR, and western blot analysis of eIF5AH levels in MEFs treated with 10 μM GC7 for 24 h (relative OCR = basal OCR of treated cells normalized to basal OCR of untreated control cells). (E) Relative OCR (relative OCR = basal OCR of treated cells normalized to basal OCR of untreated control cells) and maximum OCR (OCR post-FCCP injection) in MEFs treated with 20 μM CPX for 24 h (OCR is normalized to the baseline OCR of untreated cells). (F and G) Immunoblot analysis of eIF5A (F) and relative OCR of MEFs (NIH-3T3) expressing isopropyl β-D-1-thiogalactopyranoside (IPTG)-inducible Eif5a-shRNA (G). Cells were treated with 100 μM IPTG for the indicated length of time. OCR is normalized to the baseline OCR of non-IPTG-treated control cells. (H and I) Western blot of DHPS, total eIF5A, and eIF5A-hypusine levels (H) and relative OCR in Dhpsflox/flox MEFs expressing a 4-OHT-inducible Cre (Cre-ER) (controls are 4-OHT-treated Dhpsflox/flox Cre-ER cells) (I). OCR is normalized to the baseline OCR of control cells. Cells were treated with 10 μM 4-OHT for the indicated length of time. (J) S2 (D. melanogaster), Madin-Darby Canine Kidney (MDCK) (C. familiaris), and MCF-7 (H. sapiens) cells treated with 10 μM GC7 and 20 μM CPX for 24 h. All data are means ± SEM (p∗∗ < 0.005, p∗∗∗ < 0.0005, compared with control or untreated). (B)–(E) and (J) Representative of two experiments and (F)–(I) representative of three experiments.
Figure 2
Figure 2
Hypusinated eIF5A Maintains TCA Cycle and ETC Integrity in Macrophages (A) TCA cycle schematic highlighting points of entry for glucose, palmitate, and glutamine. (B) LC-MS quantification of indicated metabolites in M(IL-4) exposed to 10 μM GC7 for 24 h, relative to control cells. (C) D-13C-Glucose and 13C-glutamine gas chromatography-mass spectrometry trace analysis of M(IL-4) treated with 10 μM GC7 for 24 h. (D) Proteomic analysis of M(IL-4) treated with 10 μM GC7 for 24 h. (E and F) Immunoblot assessment of selected TCA cycle enzymes, as depicted in (A), and ETC-associated proteins in (E) M0, M(LPS/IFN-γ) = M(L/γ), and M(IL-4) treated with 10 μM GC7 for 22 h, and in (F) MEFs (NIH-3T3) transduced with Eif5a-shRNA for the indicated amount of days or Dhpsflox/flox Cre-ER MEFs treated with 4-OHT for the stated length of time. All data are means ± SEM (p∗∗ < 0.005, p∗∗∗ < 0.0005). (B and C) Representative of two experiments, (D) of one experiment (n = 3/group), and (E and F) of three experiments. Duplicate loading control. Due to overlapping sizes, loading controls were analyzed on separate gels. Same amount of protein was run for analyses (E).
Figure 3
Figure 3
The MTS of Several Mitochondrial Enzymes Exhibit an Increased Dependency on eIF5AH for Efficient Translation (A) Relative mRNA expression of indicated genes in M(IL-4) treated with 10 μM GC7 for 24 h. (B) Polysome profiles of MEFs (NIH-3T3) expressing Eif5a-shRNA for 5 days versus control MEFs. The y axis indicates absorption at 254 nm, and the x axis represents fractions separated over a 15%–55% sucrose gradient. (C) RT-PCR analysis of indicated mRNAs in ribosome fractions generated from control and Eif5a-shRNA-expressing MEFs (NIH-3T3). (D) Target sequences were cloned into the N terminus of mCherry fused to a degron (to limit its half-life and circumvent differential MTS mCherry half-life between constructs) separated by a GSGSG flexible linker to allow correct and independent folding of the introduced sequences and mCherry. These were subcloned into the MIGR1 vector and transduced into MEFs (SUCLG1 is a subunit of succinyl-CoA synthetase). (E) Representative confocal images of cloned constructs SV40 NLS-, IDH2 MTS-, and control mCherry. Scale bar, 10 μm. (F) Representative histograms of indicated constructs in MEFs (NIH-3T3) ± 10 μM GC7 for 24 h. (G) Indicated constructs were transfected with Eif5a siRNA plus a nontargeting AF647-labeled siRNA as a control for transfection into MEFs (NIH-3T3). Control cells only received nontargeting siRNA. mCherry mean fluorescence intensity (MFI) was assessed 48 h after transfection by flow cytometry. Shown are representative histograms. Histograms are gated on GFP+ AF647+ cells. Bar graphs depict percent reduction of mCherry MFI between Eif5a siRNA and nontargeting siRNA: NS, nonsignificant; NR, no reduction in mCherry (n = 3/group). All data are means ± SEM (p < 0.05, p∗∗ < 0.005, p∗∗∗ < 0.0005). (A) Representative of two to three experiments (n = 3 per group), (B and C) of one experiment, (E) of two experiments, and (F and G) of three to four experiments.
Figure 4
Figure 4
A Role for eIF5AH in Differential Macrophage Activation (A) Immunoblot analysis and densitometry of eIF5A and eIF5AH levels in BMMφ exposed to LPS plus IFN-γ or IL-4 for the indicated length of time. Representative of three individual mice. (B) 13C-Arginine trace analysis in M0, M(LPS), M(L/γ), and M(IL-4). Cells were polarized overnight in SILAC media containing 1.1 mM 13C arginine ± 2.5 mM DFMO. (C) Expression of macrophage alternative activation markers assessed by flow cytometry in BMMφ exposed to IL-4 ± 500 nM rotenone (complex I inhibitor) or 5 μM antimycin A (complex III inhibitor) or 200 nM myxothiazol (complex III inhibitor) or 5 μM oligomycin (complex V inhibitor) for 20 h (n = 7). (D) CD301 and RELMα expression assayed by flow cytometry in M(IL-4) treated with 10 μM GC7 or 20 μM CPX for 24 h. (E) Expression of human macrophage alternative activation markers assessed by flow cytometry in human monocyte-derived macrophages exposed to IL-4 ± 10 μM GC7 for 20 h (n = 3 individual donors). (F) C57BL/6 mice were administered IL-4:αIL-4 complex at 5:25 μg by intraperitoneal (i.p.) injection. 24 h later eIF5A and eIF5AH levels were assessed by flow cytometry in peritoneal macrophages (Ly6G Ly6C Siglec-F F4/80hi CD11b+) (n = 5 per group). (G) Absolute number of peritoneal macrophages elicited from mice treated with IL-4:αIL-4 complex at 5:25 μg on days 2 and 4 ± 10 mg/kg GC7 on days 0–3 (n = 4–5 per group). (H) C57BL/6 mice were treated with IL-4:αIL-4 complex by i.p. injection at 5:25 μg on days −4, −2, and day 0 ± 10 mg/kg GC7 on days −4 to 0. On day 0, mice were orally infected with H. polygyrus by gavage and absolute counts of peritoneal macrophages and intestinal worm burden were assessed on day 15 postinfection (∅ = naive control) (n = 6 per group). (I) Mice were treated with 8 mg/kg LPS ± 10 mg/kg GC7 by i.p. injection, 12-h later serum IL-12 and IL-6 levels were quantified, as were markers of classical macrophage activation in peritoneal macrophages (Ly6G Ly6C Siglec-F F4/80hi CD11b+) measured by flow cytometry (n = 5 per group). All data are means ± SEM (p < 0.05, p∗∗ < 0.005, compared with M(IL-4) condition, or IL-4c). (A) Representative of three individual mice and two experiments, (B, C, G, and I) of two experiments, (D) of three experiments, and (E, H) of one experiment.

References

    1. Abbruzzese A., Park M.H., Folk J.E. Deoxyhypusine hydroxylase from rat testis. Partial purification and characterization. J. Biol. Chem. 1986;261:3085–3089. - PubMed
    1. Arpa L., Valledor A.F., Lloberas J., Celada A. IL-4 blocks M-CSF-dependent macrophage proliferation by inducing p21WAF1 in a STAT6-dependent way. Eur. J. Immunol. 2009;39:514–526. - PubMed
    1. Bando J.K., Nussbaum J.C., Liang H.E., Locksley R.M. Type 2 innate lymphoid cells constitutively express arginase-I in the naive and inflamed lung. J. Leukoc. Biol. 2013;94:877–884. - PMC - PubMed
    1. Bevec D., Klier H., Holter W., Tschachler E., Valent P., Lottspeich F., Baumruker T., Hauber J. Induced gene expression of the hypusine-containing protein eukaryotic initiation factor 5A in activated human T lymphocytes. Proc. Natl. Acad. Sci. USA. 1994;91:10829–10833. - PMC - PubMed
    1. Buck M.D., Sowell R.T., Kaech S.M., Pearce E.L. Metabolic instruction of immunity. Cell. 2017;169:570–586. - PMC - PubMed

Publication types