. 2019 May 26;8(5):506.
doi: 10.3390/cells8050506.

Nilotinib: A Tyrosine Kinase Inhibitor Mediates Resistance to Intracellular Mycobacterium Via Regulating Autophagy

Affiliations

Nilotinib: A Tyrosine Kinase Inhibitor Mediates Resistance to Intracellular Mycobacterium Via Regulating Autophagy

Tariq Hussain et al. Cells. .

Abstract

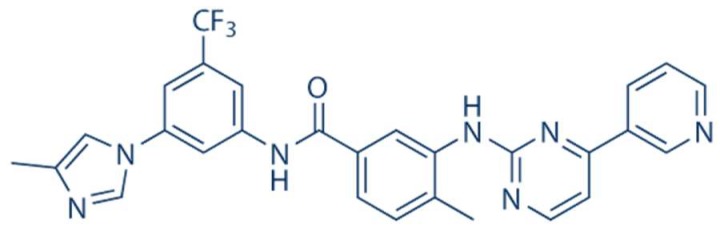
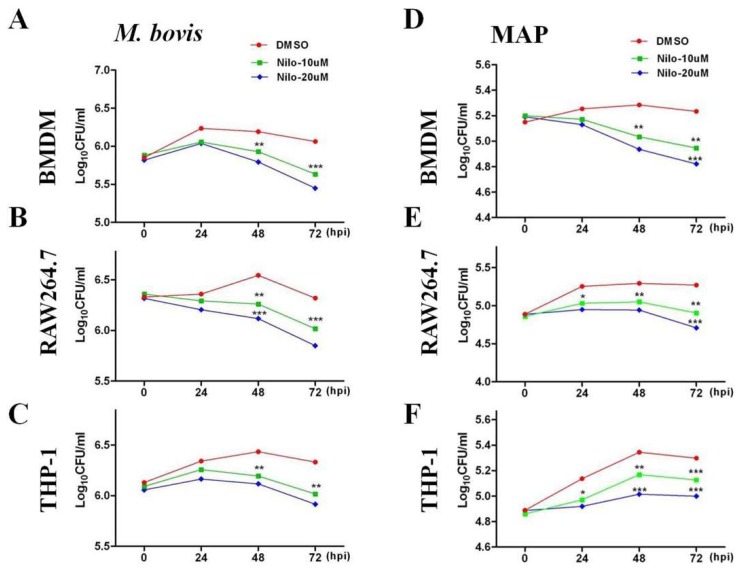
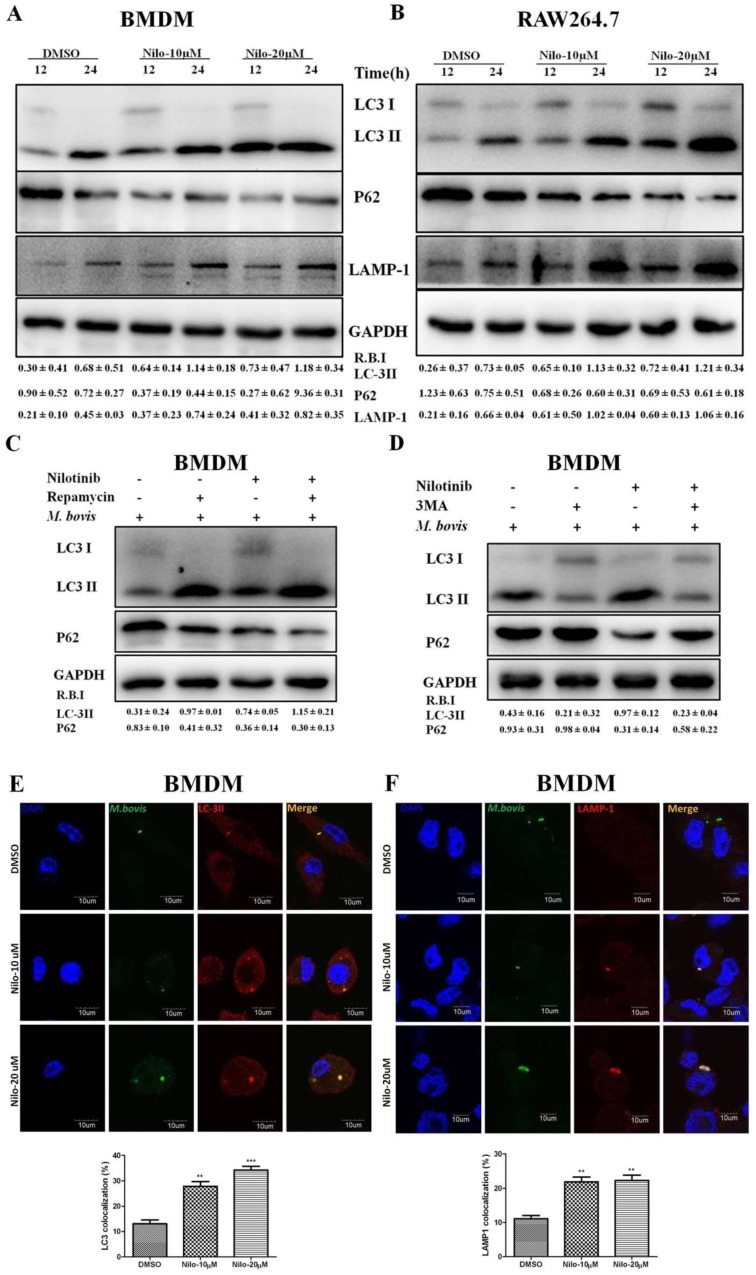
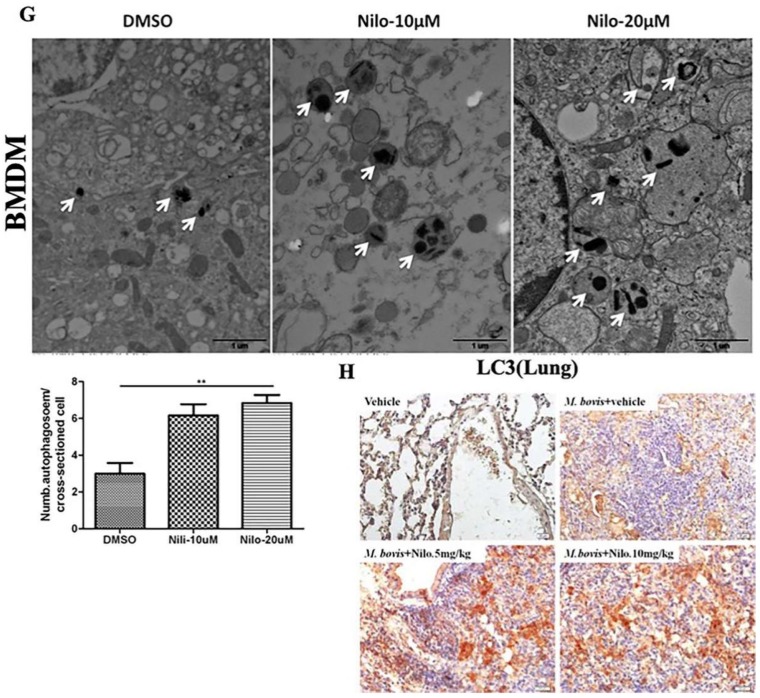
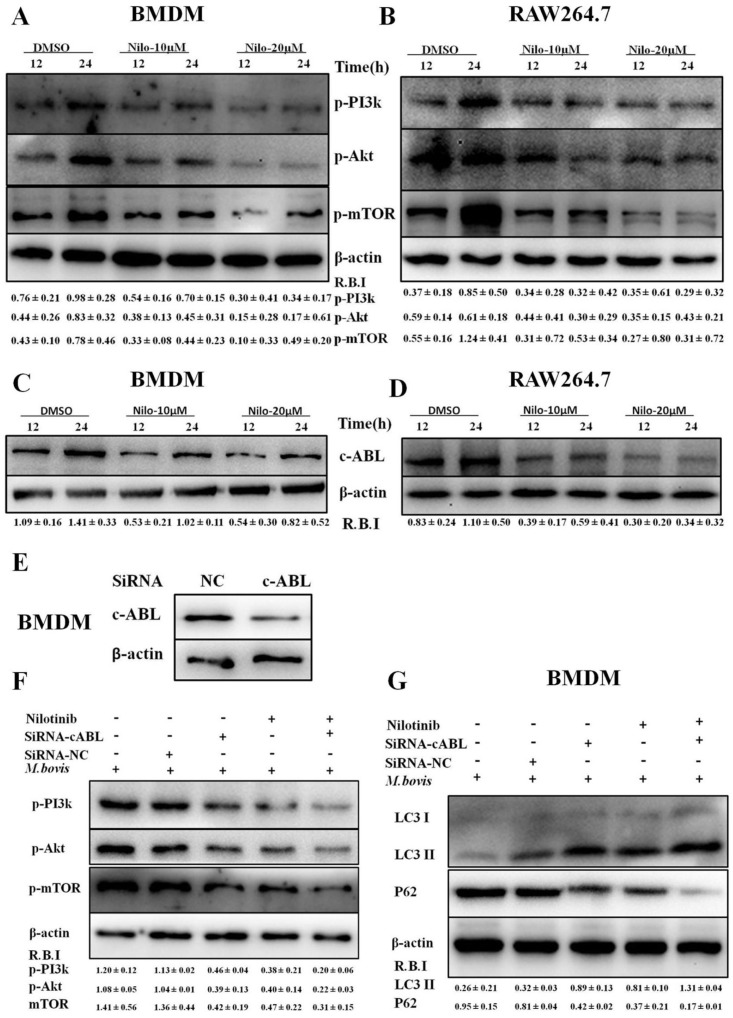
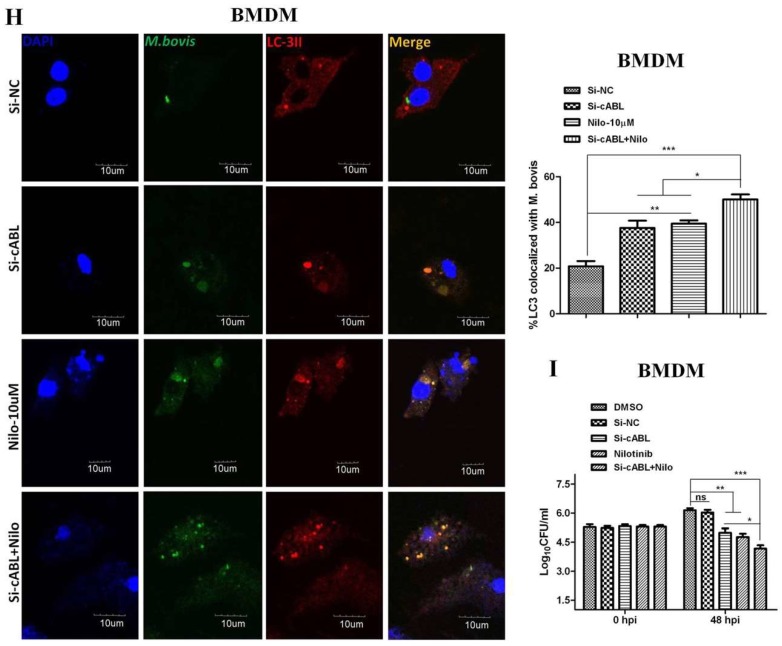
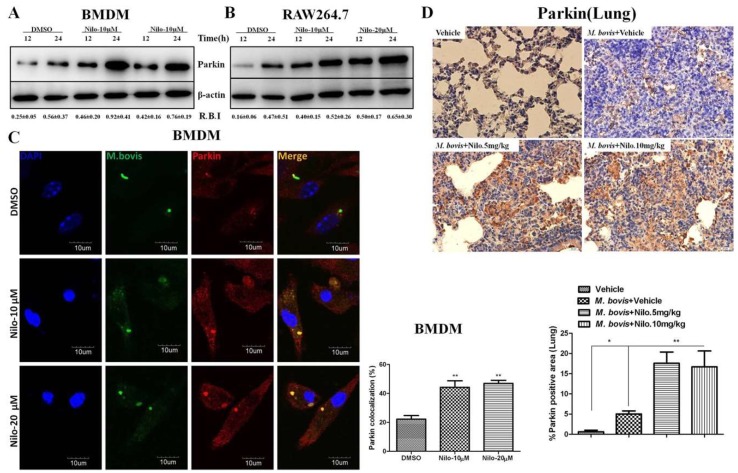
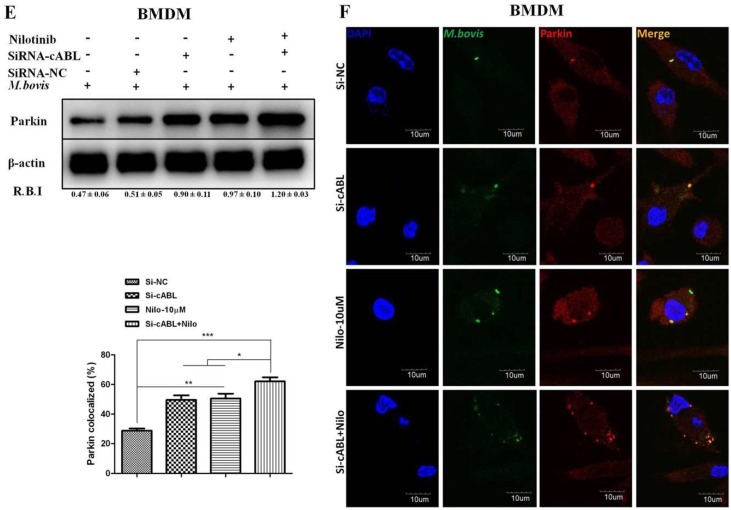
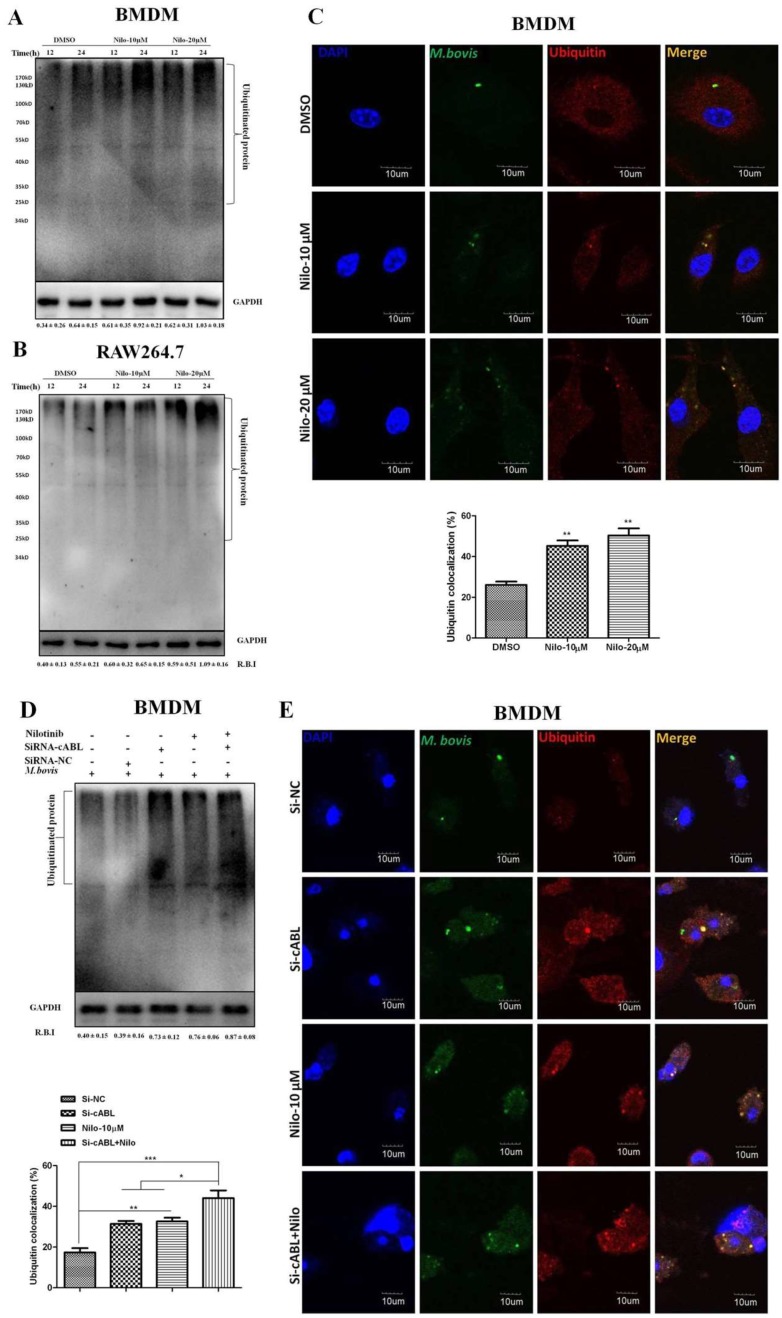
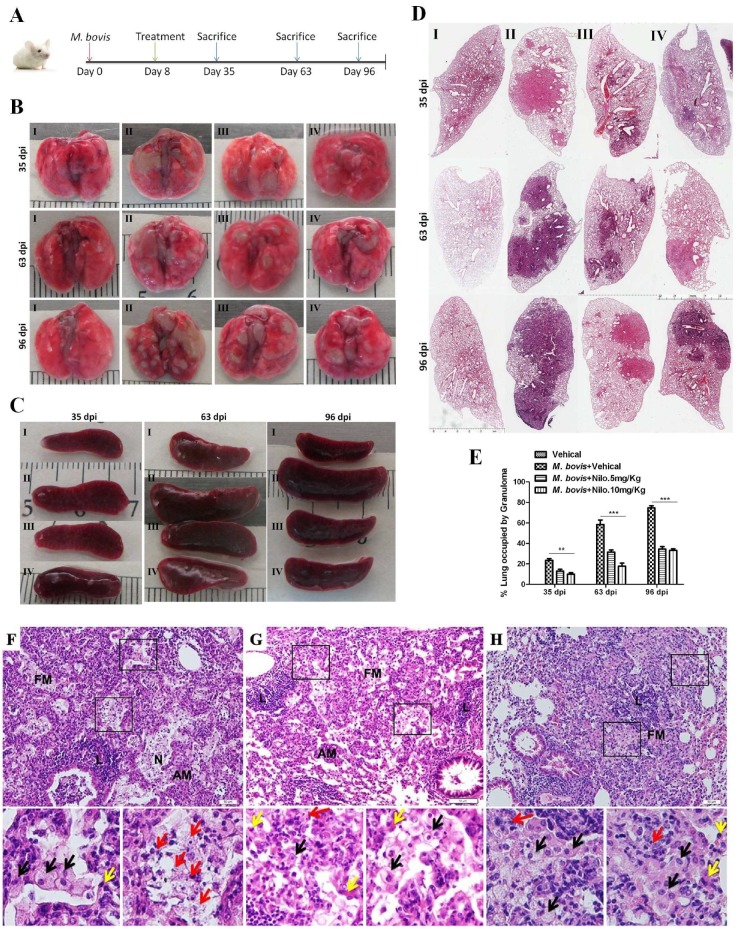
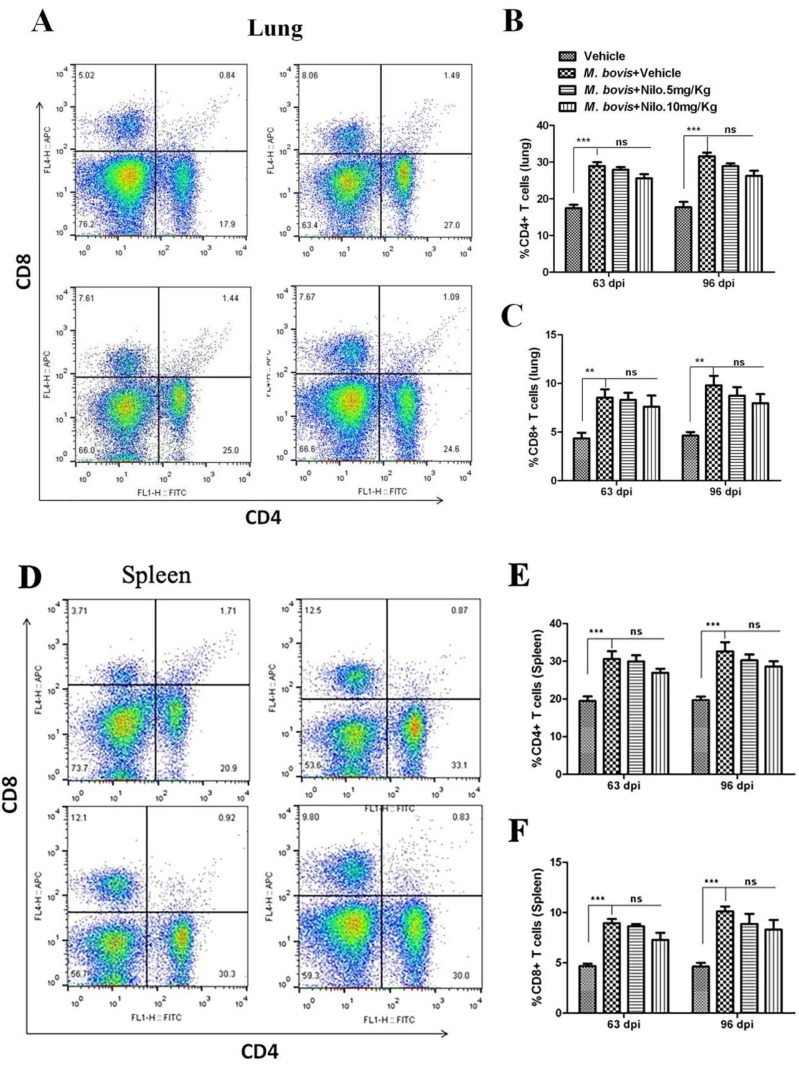
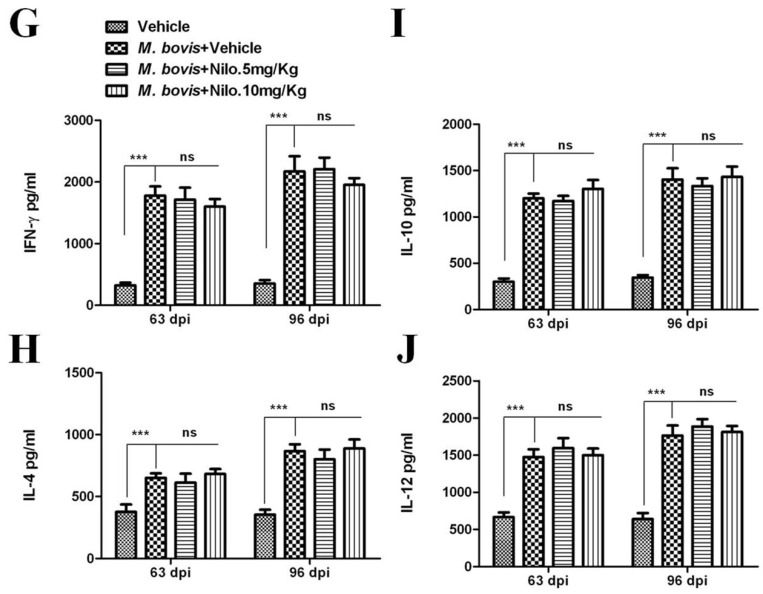
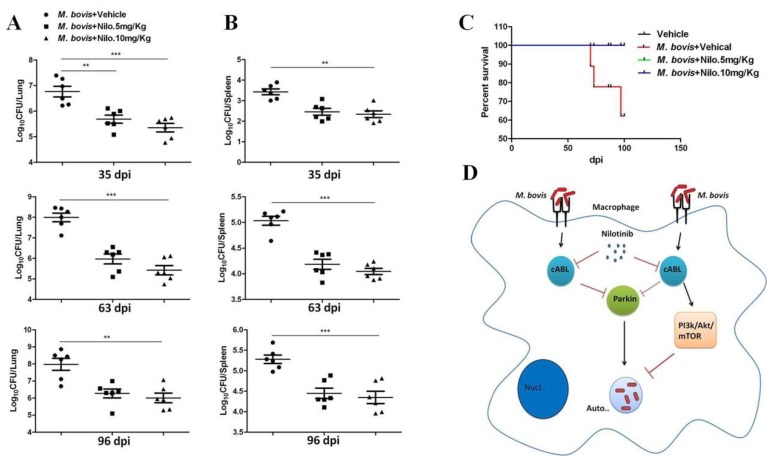
Nilotinib, a tyrosine kinase inhibitor, has been studied extensively in various tumor models; however, no information exists about the pharmacological action of nilotinib in bacterial infections. Mycobacterium bovis (M. bovis) and Mycobacterium avium subspecies paratuberculosis (MAP) are the etiological agents of bovine tuberculosis and Johne's disease, respectively. Although M. bovis and MAP cause distinct tissue tropism, both of them infect, reside, and replicate in mononuclear phagocytic cells of the infected host. Autophagy is an innate immune defense mechanism for the control of intracellular bacteria, regulated by diverse signaling pathways. Here we demonstrated that nilotinib significantly inhibited the intracellular survival and growth of M. bovis and MAP in macrophages by modulating host immune responses. We showed that nilotinib induced autophagic degradation of intracellular mycobacterium occurred via the inhibition of PI3k/Akt/mTOR axis mediated by abelson (c-ABL) tyrosine kinase. In addition, we observed that nilotinib promoted ubiquitin accumulation around M. bovis through activation of E3 ubiquitin ligase parkin. From in-vivo experiments, we found that nilotinib effectively controlled M. bovis growth and survival through enhanced parkin activity in infected mice. Altogether, our data showed that nilotinib regulates protective innate immune responses against intracellular mycobacterium, both in-vitro and in-vivo, and can be exploited as a novel therapeutic remedy for the control of M. bovis and MAP infections.

Keywords: Mycobacterium avium subspecies paratuberculosis (MAP); Mycobacterium bovis (M. bovis); autophagy; macrophage; nilotinib.


Conflict of interest statement

All authors read and approved the final manuscript. The authors declare that neither they nor their institutes have any competing conflict of interests.

Figures

Scheme 1
Scheme 1
Chemical Structure of Nilotinib (Selleck Chemicals; Houston, TX, USA).
Figure 1
Figure 1
Nilotinib inhibits the intracellular survival of M. bovis and Mycobacterium avium subspecies paratuberculosis (MAP) in vitro. (A,D) BMDM, (B,E) RAW264.7 and (C,F) THP-1 cells were treated with DMSO (0.1%) or nilotinib 10µM and 20 µM followed by infection with M. bovis and MAP for indicated time periods. Cells were lysed and intracellular survival of M. bovis and MAP was determined by performing Colony forming unit (CFU) assay. Mean ± SD were evaluated from three independent experiments. The data was analyzed by using two-way analysis of variance (ANOVA) followed by Bonferroni’s multiple comparison test. (* p < 0.05, ** p < 0.01, *** p < 0.001).
Figure 2
Figure 2
Nilotinib induces autophagy during M. bovis infection. (A,B) BMDM and RAW264.7 cells were pretreated with DMSO (0.1%) or nilotinib 10 µM and 20 µM, followed by M. bovis infection (MOI 1:10) for indicated time. The expression levels of LC3, P62, and LAMP-1 were normalized to GAPDH after treatment for the indicated times. (C) BMDM cells were treated with ripamycin (5 µM) and nilotinib (10 µM) alone and in combination with ripamycin before infection with M. bovis. (D) BMDM cells were treated with 3-MA (5 mM) and nilotinib (10 μM/mL) alone and in combination with 3-MA before infection with M. bovis. (C,D) LC-3 and P62 expression level were determined by Western blot (WB). Relative band intensity (R.B.I) values represent the mean ± SD of densitometric analysis of each WB band. (E,F) BMDM cells were infected with M. bovis and pretreated with DMSO (0.1%) or nilotinib 10 µM and 20 µM. The colocalization of (E) LC3-II and (F) LAMP-1 with M. bovis was determined by confocal microscopy. The colocalization % was calculated by image-J software (National institute of health, Bethesda, MD, USA) Scale bar: 10 µm. (G) BMDM cells were infected with M. bovis and pretreated with DMSO (0.1%) and nilotinib 10 µM and 20 µM. Cross-sections of cytoplasm were observed by TEM and the autophagosomes per cross-sectioned cell were counted (20 cells per group) Scale bar: 1 µm. Data represents the mean ± SD from three independent experiments. The data was analyzed by using one-way analysis of variance (ANOVA) followed by Tukey’s multiple comparison. (** p < 0.001, *** p < 0.001). (H) Immunohistochemistry (IHC) for LC-3 protein (63dpi) in lung section of BALB/c mice uninfected or infected with M. bovis (200 CFU), treated with vehicle, nilotinib 5 mg/kg or 10 mg/kg (n = 3).
Figure 2
Figure 2
Nilotinib induces autophagy during M. bovis infection. (A,B) BMDM and RAW264.7 cells were pretreated with DMSO (0.1%) or nilotinib 10 µM and 20 µM, followed by M. bovis infection (MOI 1:10) for indicated time. The expression levels of LC3, P62, and LAMP-1 were normalized to GAPDH after treatment for the indicated times. (C) BMDM cells were treated with ripamycin (5 µM) and nilotinib (10 µM) alone and in combination with ripamycin before infection with M. bovis. (D) BMDM cells were treated with 3-MA (5 mM) and nilotinib (10 μM/mL) alone and in combination with 3-MA before infection with M. bovis. (C,D) LC-3 and P62 expression level were determined by Western blot (WB). Relative band intensity (R.B.I) values represent the mean ± SD of densitometric analysis of each WB band. (E,F) BMDM cells were infected with M. bovis and pretreated with DMSO (0.1%) or nilotinib 10 µM and 20 µM. The colocalization of (E) LC3-II and (F) LAMP-1 with M. bovis was determined by confocal microscopy. The colocalization % was calculated by image-J software (National institute of health, Bethesda, MD, USA) Scale bar: 10 µm. (G) BMDM cells were infected with M. bovis and pretreated with DMSO (0.1%) and nilotinib 10 µM and 20 µM. Cross-sections of cytoplasm were observed by TEM and the autophagosomes per cross-sectioned cell were counted (20 cells per group) Scale bar: 1 µm. Data represents the mean ± SD from three independent experiments. The data was analyzed by using one-way analysis of variance (ANOVA) followed by Tukey’s multiple comparison. (** p < 0.001, *** p < 0.001). (H) Immunohistochemistry (IHC) for LC-3 protein (63dpi) in lung section of BALB/c mice uninfected or infected with M. bovis (200 CFU), treated with vehicle, nilotinib 5 mg/kg or 10 mg/kg (n = 3).
Figure 3
Figure 3
Nilotinib attenuates c-ABL (abelson tyrosine kinase) dependent PI3k/Akt/mTOR signaling pathway in M. bovis infected macrophages. (A,C) BMDM and (B,D) RAW264.7 cells were treated with DMSO (0.1%) or nilotinib 10 µM and 20 µM followed by M. bovis infection (MOI 1:10). (A,B) Cells were lysed at the indicated time periods and lysates were probed for p-PI3k, p-Akt and p-MTOR by WB. (C,D) The expression level of c-ABL was determined by WB. © cABL protein level was determined by western blot from BMDMs transfected with 50 µM SiRNA negative control and SiRNA cABL for 36 h. (EI) BMDMs were transfected with 50 µM of the SiRNA negative control and SiRNA cABL for 36 h. After transfection, cells were treated or untreated with nilotinib (10 µM) followed by infection with M. bovis for 24 h. The protein expression levels of (F) p-PI3k, p-Akt, p-MTOR, (G) LC3-II, and P62 were determined by WB and normalized to β-actin. R.B.I values represent the mean ± SD of densitometric analysis of each WB band. (H) The colocalization of LC3 with M. bovis was determined by confocal microscopy Scale bar: 10 µm. The colocalization % of LC3 was calculated by image-J software (National institute of health, Bethesda, MD, USA). Similar results were observed in three independent experiments. The data was analyzed by using one-way analysis of variance (ANOVA) followed by tukey’s multiple comparison test. (* p < 0.05, ** p < 0.01, *** p < 0.001). (I) The intracellular survival of M. bovis was determined by performing a CFU assay. Data represent the mean ± SD from three independent experiments. The data was analyzed by using two-way analysis of variance (ANOVA) followed by Bonferroni’s multiple comparison test. (* p < 0.05, ** p < 0.01, *** p < 0.001).
Figure 3
Figure 3
Nilotinib attenuates c-ABL (abelson tyrosine kinase) dependent PI3k/Akt/mTOR signaling pathway in M. bovis infected macrophages. (A,C) BMDM and (B,D) RAW264.7 cells were treated with DMSO (0.1%) or nilotinib 10 µM and 20 µM followed by M. bovis infection (MOI 1:10). (A,B) Cells were lysed at the indicated time periods and lysates were probed for p-PI3k, p-Akt and p-MTOR by WB. (C,D) The expression level of c-ABL was determined by WB. © cABL protein level was determined by western blot from BMDMs transfected with 50 µM SiRNA negative control and SiRNA cABL for 36 h. (EI) BMDMs were transfected with 50 µM of the SiRNA negative control and SiRNA cABL for 36 h. After transfection, cells were treated or untreated with nilotinib (10 µM) followed by infection with M. bovis for 24 h. The protein expression levels of (F) p-PI3k, p-Akt, p-MTOR, (G) LC3-II, and P62 were determined by WB and normalized to β-actin. R.B.I values represent the mean ± SD of densitometric analysis of each WB band. (H) The colocalization of LC3 with M. bovis was determined by confocal microscopy Scale bar: 10 µm. The colocalization % of LC3 was calculated by image-J software (National institute of health, Bethesda, MD, USA). Similar results were observed in three independent experiments. The data was analyzed by using one-way analysis of variance (ANOVA) followed by tukey’s multiple comparison test. (* p < 0.05, ** p < 0.01, *** p < 0.001). (I) The intracellular survival of M. bovis was determined by performing a CFU assay. Data represent the mean ± SD from three independent experiments. The data was analyzed by using two-way analysis of variance (ANOVA) followed by Bonferroni’s multiple comparison test. (* p < 0.05, ** p < 0.01, *** p < 0.001).
Figure 4
Figure 4
Nilotinib increases parkin activation during M. bovis infection. (A,B) BMDM and RAW264.7 cells were treated with DMSO (0.1%) or Nilotinib 10 µM and 20 µM followed by M. bovis (MOI 1:10) infection. Cells lysates were used for Parkin protein expression by WB. (C) BMDM cells were infected with M. bovis and treated with DMSO (0.1%) and Nilotinib 10 µM and 20 µM for 24 h. Parkin colocalization with M. bovis was determined by confocal microscopy Scale bar: 10 µm. The colocalization% of Parkin was calculated by Image-J software (National institute of health, Bethesda, MD, USA). (D) IHC for the parkin protein (63 dpi) in the lung section of BALB/c mice uninfected or infected with M. bovis (200 CFU), treated with vehicle, or nilotinib at 5 mg/kg or 10 mg/kg (n = 3) Scale bar: 20 µm. € and (F) BMDMs were transfected with a 50 nM SiRNA negative control and SiRNA cABL for 36 h. After transfection, the cells were treated or untreated with nilotinib (10 µM) followed by infection with M. bovi€ (E) The expression level of parkin was determined by WB. R.B.I values represent the mean ± SD of densitometric analysis of each WB band. (F) Parkin colocalization with M. bovis was determined by confocal microscopy Scale bar: 10 µm. The colocalization % of Parkin was calculated by image-J software. Data represent the mean ± SD from three independent experiments. The data was analyzed by using one-way analysis of variance (ANOVA) followed by tukey’s multiple comparison test. (* p < 0.05, ** p < 0.001, *** p < 0.001).
Figure 4
Figure 4
Nilotinib increases parkin activation during M. bovis infection. (A,B) BMDM and RAW264.7 cells were treated with DMSO (0.1%) or Nilotinib 10 µM and 20 µM followed by M. bovis (MOI 1:10) infection. Cells lysates were used for Parkin protein expression by WB. (C) BMDM cells were infected with M. bovis and treated with DMSO (0.1%) and Nilotinib 10 µM and 20 µM for 24 h. Parkin colocalization with M. bovis was determined by confocal microscopy Scale bar: 10 µm. The colocalization% of Parkin was calculated by Image-J software (National institute of health, Bethesda, MD, USA). (D) IHC for the parkin protein (63 dpi) in the lung section of BALB/c mice uninfected or infected with M. bovis (200 CFU), treated with vehicle, or nilotinib at 5 mg/kg or 10 mg/kg (n = 3) Scale bar: 20 µm. € and (F) BMDMs were transfected with a 50 nM SiRNA negative control and SiRNA cABL for 36 h. After transfection, the cells were treated or untreated with nilotinib (10 µM) followed by infection with M. bovi€ (E) The expression level of parkin was determined by WB. R.B.I values represent the mean ± SD of densitometric analysis of each WB band. (F) Parkin colocalization with M. bovis was determined by confocal microscopy Scale bar: 10 µm. The colocalization % of Parkin was calculated by image-J software. Data represent the mean ± SD from three independent experiments. The data was analyzed by using one-way analysis of variance (ANOVA) followed by tukey’s multiple comparison test. (* p < 0.05, ** p < 0.001, *** p < 0.001).
Figure 5
Figure 5
Nilotinib promotes the ubiquitination of M. bovis in infected macrophage. (A,B) BMDM and RAW264.7 cells were treated with DMSO (0.1%) or Nilotinib 10 µM and 20 µM followed by infection with M. bovis (MOI 1:10) for 12 and 24 h. Cell lysates were used for ubiquitin protein expression by WB. (C) BMDM cells were treated with DMSO or nilotinib followed by M. bovis (MOI 1:10) for the indicated time periods. Ubiquitin colocalization with M. bovis was determined by confocal microscopy Scale bar: 10 µm. The colocalization% of ubiquitin was calculated by Image-J software (NIH, Bethesda, MD, USA). (D,E) BMDMs were transfected with 50 nM SiRNA negative control and SiRNA cABL for 36 h and then treated or untreated with nilotinib (10 µM) followed by M. bovis for 24 h. (D) Cells lysates were used for ubiquitin expression by WB. R.B.I values represent the mean ± SD of densitometric analysis of each €band. (E) Ubiquitin colocalization with M. bovis was determined by confocal microscopy—Scale bar: 10 µm. The colocalization% of ubiquitin was calculated by Image-J software (NIH, Bethesda, MD, USA). Data represent the mean ± SD from three independent experiments. The data was analyzed by using one-way analysis of variance (ANOVA) followed by tukey’s multiple comparison test. (* p < 0.05, ** p < 0.001, *** p < 0.001).
Figure 6
Figure 6
Nilotinib reduces the severity of M. bovis pathogenesis in mice. (A) BALB/c mice were infected with M. bovis at 200 CFU via the intranasal route; after one week of infection mice were treated with the vehicle (DMSO 30 µL/mice), Nilotinib 5 mg/Kg, and 10 mg/kg via intraperitoneal (i.p.) injection on alternate dasy. On days 35, 63, and 96 after infection, animals were slaughtered and different organs plus blood serum were collected. (B,C) show the representative lung and spleen morphology of mice injected with the vehicle uninfected or infected with M. bovis followed by nilotinib treatment, as described above. (D) The representative left lung lobe of the vehicle injected uninfected or infected and nilotinib treated mice. (E) Area% of lung occupied by granuloma of uninfected mice injected with vehicle, infected, and nilotinib treated or untreated group (n = 3). Statistical significance was determined by using a two-way analysis of variance (ANOVA) correcting for multiple comparisons. (** p < 0.001, *** p < 0.001). (FH) Higher magnification of lung lesions (63 dpi) showing a characteristic dark stained lymphocyte dense area (L) next to a light stained foamy macrophages ring (FM), alveolar macrophages (AM), and necrotic area (N). Lower panels are representative of a square marked area of F, G and H panel, Foamy macrophages (black arrows), alveolar macrophages (yellow arrows) and karyorrhectic debris (red arrows). Scale bar: 20 µm (F–H). I represent uninfected mice injected with the vehicle, II represents infected mice injected with the vehicle, III represents infected mice injected with nilotinib 5 mg/kg, and IV represents infected mice injected with nilotinib 10 mg/kg, respectively.
Figure 7
Figure 7
The effect of nilotinib on T cells activation in mice infected with M. bovis. Lung and spleen tissues were collected at different time points from M. bovis infected and uninfected mice that were injected with the vehicle, nilotinib 5 mg/kg and 10 mg/kg (n = 3). (A) Representative flow cytometry plots and summary graph of the lung, (B) CD4+ and (C) CD8+ T-cells after ESAT-6 re-stimulation for 12–18 h. (D) Representative flow cytometry plots and summary graph of spleen, (E) CD4+ and (F) CD8+ T-cells after ESAT-6 re-stimulation for 12–18 h. CD4+ and CD8+ T cells population shown have pre-gated on CD3. (GJ) Blood serum samples were collected from uninfected, infected with M. bovis, and treated or untreated mice (n = 6). Serum samples were assayed for (G) IFN-γ, (H) IL-4, (I) IL-10, and (J) IL-12 by the ELISA technique. Statistical significance was determined by using two-way ANOVA followed by Bonferroni’s multiple comparisons. (** p < 0.01, *** p < 0.001).
Figure 7
Figure 7
The effect of nilotinib on T cells activation in mice infected with M. bovis. Lung and spleen tissues were collected at different time points from M. bovis infected and uninfected mice that were injected with the vehicle, nilotinib 5 mg/kg and 10 mg/kg (n = 3). (A) Representative flow cytometry plots and summary graph of the lung, (B) CD4+ and (C) CD8+ T-cells after ESAT-6 re-stimulation for 12–18 h. (D) Representative flow cytometry plots and summary graph of spleen, (E) CD4+ and (F) CD8+ T-cells after ESAT-6 re-stimulation for 12–18 h. CD4+ and CD8+ T cells population shown have pre-gated on CD3. (GJ) Blood serum samples were collected from uninfected, infected with M. bovis, and treated or untreated mice (n = 6). Serum samples were assayed for (G) IFN-γ, (H) IL-4, (I) IL-10, and (J) IL-12 by the ELISA technique. Statistical significance was determined by using two-way ANOVA followed by Bonferroni’s multiple comparisons. (** p < 0.01, *** p < 0.001).
Figure 8
Figure 8
The effect of nilotinib on the growth and survival of M. bovis in infected mice. Lung and spleen tissues were collected at different time points from M. bovis infected mice that were injected with vehicle, nilotinib 5 mg/kg and 10 mg/kg (n = 6). Viable bacilli were determined by plating (A) lung and (B) spleen homogenates on 7H11 agar plates after making tenfold dilution in PBS. (C) Survival curve of mice following intranasal infection with M. bovis, treated or untreated with nilotinib. Statistical significance was determined by using two-way ANOVA (analysis of variance) followed by Bonferroni’s multiple comparisons. (** p < 0.01, *** p < 0.001). (D) A model illustrating how nilotinib modulate autophagy in macrophages infected with M. bovis; Nilotinib attenuate M. bovis induced activation of PI3k/Akt/mTOR is dependendent on c-ABL. In addition, nilotinib induces M. bovis ubiquitination via parkin-ubiquitin activation.

References

    1. Ashford D.A., Whitney E., Raghunathan P., Cosivi O. Epidemiology of selected mycobacteria that infect humans and other animals. J. Revue Scientifique Et Technique De L Office International Des Epizooties. 2001;20:325–337. doi: 10.20506/rst.20.1.1266. - DOI - PubMed
    1. Grange J.M. Mycobacterium bovis infection in human beings. J. Tuberc. 2001;81:71–77. doi: 10.1054/tube.2000.0263. - DOI - PubMed
    1. Lombard J.E. Epidemiology and economics of paratuberculosis. J. Vet. Clin. North Am. Food Anim. Pract. 2011;27:525–535. doi: 10.1016/j.cvfa.2011.07.012. - DOI - PubMed
    1. McNees A.L., Markesich D., Zayyani N.R., Graham D.Y. Mycobacterium paratuberculosis as a cause of Crohn’s disease. J. Expert Rev. Gastroenterol. Hepatol. 2015;9:1523–1534. doi: 10.1586/17474124.2015.1093931. - DOI - PMC - PubMed
    1. Dalziel T.K. Thomas Kennedy Dalziel 1861–1924. Chronic interstitial enteritis. J. Dis. Colon. Rectum. 1989;32:1076–1078. doi: 10.1007/BF02553886. - DOI - PubMed

Publication types

MeSH terms

LinkOut - more resources