. 2019 Jan;22(1):150-167.
doi: 10.1111/avsc.12401. Epub 2019 Feb 27.

Vegetation on mesic loamy and sandy soils along a 1700-km maritime Eurasia Arctic Transect

Affiliations

Vegetation on mesic loamy and sandy soils along a 1700-km maritime Eurasia Arctic Transect

Donald A Walker et al. Appl Veg Sci. 2019 Jan.

Abstract

Questions: How do plant communities on zonal loamy vs. sandy soils vary across the full maritime Arctic bioclimate gradient? How are plant communities of these areas related to existing vegetation units of the European Vegetation Classification? What are the main environmental factors controlling transitions of vegetation along the bioclimate gradient?

Location: 1700-km Eurasia Arctic Transect (EAT), Yamal Peninsula and Franz Josef Land (FJL), Russia.

Methods: The Braun-Blanquet approach was used to sample mesic loamy and sandy plots on 14 total study sites at six locations, one in each of the five Arctic bioclimate subzones and the forest-tundra transition. Trends in soil factors, cover of plant growth forms (PGFs) and species diversity were examined along the summer warmth index (SWI) gradient and on loamy and sandy soils. Classification and ordination were used to group the plots and to test relationships between vegetation and environmental factors.

Results: Clear, mostly non-linear, trends occurred for soil factors, vegetation structure and species diversity along the climate gradient. Cluster analysis revealed seven groups with clear relationships to subzone and soil texture. Clusters at the ends of the bioclimate gradient (forest-tundra and polar desert) had many highly diagnostic taxa, whereas clusters from the Yamal Peninsula had only a few. Axis 1 of a DCA was strongly correlated with latitude and summer warmth; Axis 2 was strongly correlated with soil moisture, percentage sand and landscape age.

Conclusions: Summer temperature and soil texture have clear effects on tundra canopy structure and species composition, with consequences for ecosystem properties. Each layer of the plant canopy has a distinct region of peak abundance along the bioclimate gradient. The major vegetation types are weakly aligned with described classes of the European Vegetation Checklist, indicating a continuous floristic gradient rather than distinct subzone regions. The study provides ground-based vegetation data for satellite-based interpretations of the western maritime Eurasian Arctic, and the first vegetation data from Hayes Island, Franz Josef Land, which is strongly separated geographically and floristically from the rest of the gradient and most susceptible to on-going climate change.

Keywords: Arctic; Braun‐Blanquet classification; DCA ordination; Normalized Difference Vegetation Index; above‐ground biomass ordination; bioclimate subzones; plant growth forms; remote sensing; soil texture; summer warmth index; tundra biome.


Figures
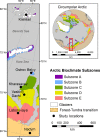
Figure 1
Figure 1
The Eurasia Arctic Transect and Arctic bioclimate subzones. Inset map shows circumpolar distribution of the subzones according to the Circumpolar Arctic Vegetation Map (CAVM Team et al., 2003)
Figure 2
Figure 2
Mean soil textures for EAT loamy sites and sandy sites. (a) Mean soil texture classes for each site plotted on a USDA soil texture triangular (percentage sand, silt, clay) with 12 size classes defined by the US Department of Agriculture (Soil Survey Staff, 1999). Each point represents the mean of five plots except for the FT‐sandy (brown squares), which portray mean values for hummocks (loamy sand) and inter‐hummock (sand) plots. (b) Sand, silt and clay percentages at loamy sites vs. summer warmth index (SWIg). (c) Sand, silt and clay percentages at sandy sites vs. summer warmth index (SWIg). Best‐fit regression equations are in Supplemental Information Appendix 9
Figure 3
Figure 3
Cluster analysis of EAT plots. The plot is based on similarity of species composition within the 76 plots using Sørensen's coefficient of distance measure and square root data transformation. The numbers on the left side of the diagram are consecutive plot numbers assigned in the Turboveg program. Corresponding plot field numbers are in the Supporting Information Appendix S3. All species (vascular plants, bryophytes and lichens) were included. Plots linked toward the left side of the diagram have high species similarity; linkages toward the right side of the diagram have low levels of similarity. The flexible‐β group linkage method (β = −0.25) was used to hierarchically link the plots. The vertical red dashed line shows the second optimal level of clustering based the Crispness of Classification approach (Botta‐Dukát et al., 2005) available through the Optimclass function in JUICE (Tichý, 2002), which resulted in the six optimal clusters (red numbers). The red line is where the line was adjusted to separate out cluster 6, which based on field observations was distinct from cluster 5. Background colours correspond to the bioclimate subzones (A to Forest–tundra). Also shown are loamy and sandy groups of plots (black Roman labels), and micro‐topographic groups of plots in patterned ground complexes (italics)
Figure 4
Figure 4
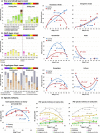
Plant‐growth‐form (PGF) cover and species richness trends along the summer‐warmth (SWIg) gradient. (a–c) PGF cover in the layers of the plant canopy (tree and shrub, herb and cryptogam). Left: Bar graphs of mean cover of plant growth forms at each location in loamy and sandy sites. Right: Trend lines of mean cover of major PGF groups (deciduous shrubs, evergreen shrubs, graminoids, forbs, bryophytes and lichens) vs. SWIg. (d) Mean species richness vs. summer warmth (SWIg). (a) Mean total species richness on loamy and sandy sites. (b) Mean species richness of major PFG groups on loamy sites. (c) Mean species richness of major PFG groups on sandy sites. Equations of the trend lines are in Supplementary Information, Appendix S9
Figure 5
Figure 5
DCA ordination of EAT plots. (a) Plot ordination with environmental joint plot. Units along the axes are SD units, an indicator of the amount of species turnover in the data set. Four SD units are considered to represent approximately one complete species turnover. Plot symbols are colour‐coded according to bioclimate subzones; shapes of symbols correspond to soil texture. Small letters (a, b) are microhabitats corresponding to patterned ground features at the Nadym Site ND‐2 (hummocks and inter‐hummocks) and Ostrov Belyy Site OB‐1 (non‐sorted circles and inter‐circle areas) and Site OB‐2 (small non‐sorted polygon centres and cracks). Red cluster numbers are according to clusters in Figure 3. Joint‐plot arrows denote direction and strength of correlations with environmental variables with p ≤ 0.05. (b) Species ordination. Centres of distributions are shown for the top five diagnostic taxa in each cluster. The alphabetic taxon codes are abbreviations containing the first four letters of the genus and first three letters of species names. Colours of taxa labels correspond to dominant bioclimate subzones of the clusters for which the taxa are diagnostic (Dark brown, cluster 1, FT‐Forest; light brown, cluster 2, FT‐tundra; red, cluster 4, subzone E & subzone D, sandy; green, cluster 5, subzone D, loamy & subzone C; dark blue, cluster 6, subzone B, loamy; light blue, cluster 7, subzone B, sandy; purple, cluster 3, subzone A.

References

    1. Alexandrova, V. D. (1980). The arctic and antarctic: Their division into geobotanical areas. Cambridge, UK: Cambridge University Press.
    1. AMAP . (2010). Assessment 2007: Oil and gas activities in the Arctic — effects and potential effects. (Vol. 1 & 2; pp. 423–277). Oslo, Norway: Arctic Monitoring and Assessment Programme (AMAP) Retrieved from https://www.amap.no/documents/doc/assessment-2007-oil-and-gas-activities...
    1. Belland, R. (2012). Arctic moss database. Retrieved 20 May 2016, cited in Raynolds, M. K., Breen, A. L., Walker, D. A., Elven, R., Belland, R., Konstantinova, N., … Hennekens, S. (2013) The Pan‐Arctic Species List (PASL). Arctic Vegetation Archive Workshop, Krakow, Poland, 14‐16 April 2013, CAFF Proceedings Series Report No. 10 (pp. 92–95).
    1. Bhatt, U. S. , Walker, D. A. , Raynolds, M. K. , Bieniek, P. A. , Epstein, H. E. , Comiso, J. C. , … Polyakov, I. (2013). Recent declines in warming and vegetation greening trends over pan‐Arctic tundra. Remote Sensing, 5, 4229–4254. 10.3390/rs5094229 - DOI
    1. Bhatt, U. S. , Walker, D. A. , Raynolds, M. K. , Comiso, J. C. , Epstein, H. E. , Jia, G. , … Webber, P. J. (2010). Circumpolar Arctic tundra vegetation change is linked to sea ice decline. Earth Interactions, 14, 1–20. 10.1175/2010EI315.1 - DOI

LinkOut - more resources