. 2019 May 3:13:167.
doi: 10.3389/fncel.2019.00167. eCollection 2019.

5-HT1A Receptor Agonist Promotes Retinal Ganglion Cell Function by Inhibiting OFF-Type Presynaptic Glutamatergic Activity in a Chronic Glaucoma Model

Affiliations

5-HT1A Receptor Agonist Promotes Retinal Ganglion Cell Function by Inhibiting OFF-Type Presynaptic Glutamatergic Activity in a Chronic Glaucoma Model

Xujiao Zhou et al. Front Cell Neurosci. .

Abstract

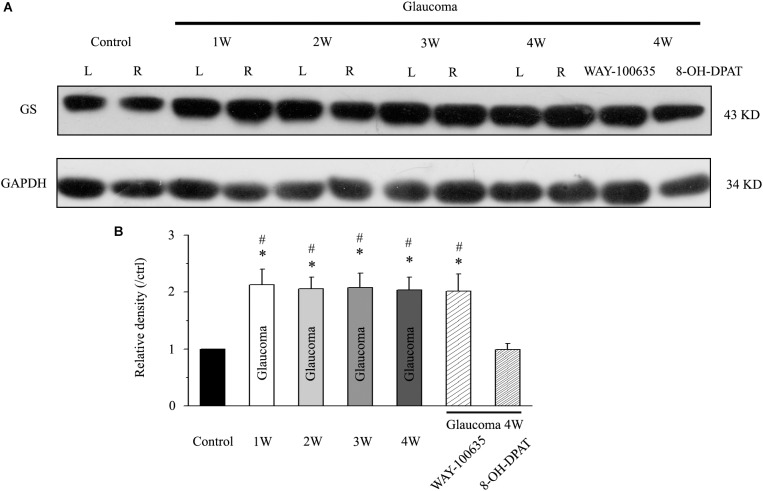
Serotonin receptors are potential neuroprotective agents in degenerative diseases of the central nervous system. The protective effects of serotonin receptor (5-HT1A) agonists on the survival and function of retinal ganglion cells (RGCs) by regulating the release of the presynaptic neurotransmitter γ-aminobutyric acid (GABA) were confirmed in our previous study of a chronic glaucoma rat model. However, the roles of excitatory amino acids and their interactions with the 5-HT1A receptor in glaucoma remain unknown. Here, we found that ocular hypertension increased glutamine synthetase (GS) and excitatory amino acid transporter 2 (EAAT2) expression in rat retinas. In addition, the high expression of GS and EAAT2 induced by glaucoma was downregulated by the 5-HT1A receptor agonist 8-OH-DPAT and the 5-HT1A receptor antagonist WAY-100635, respectively. Patch-clamp techniques were used to record glutamate receptor-mediated spontaneous and miniature glutamatergic excitatory post-synaptic currents (sEPSCs and mEPSCs) as well as L-glutamate-induced current in OFF-type and ON-type RGCs in rat retinal slices. Although there were no significant differences in the frequency and amplitude of sEPSC and mEPSC release between normal and glaucoma OFF- and ON-type RGCs, exogenous 8-OH-DPAT administration specifically reduced the frequency, but not the amplitude, of sEPSC and mEPSC release in glaucoma OFF-type rather than ON-type RGCs; these effects were completely blocked by WAY-100635. In summary, 8-OH-DPAT decreases and increases GS and EAAT2 expression of glaucomatous retina, respectively, while decreasing sEPSC and mEPSC frequency. In contrast, WAY-100635 increases and decreases GS and EAAT2 expression of glaucomatous retina, respectively, while increasing sEPSC and mEPSC frequency. The reduction of glutamatergic presynaptic transmission by 8-OH-DPAT deactivates RGCs at the neural network level and reduces the excitotoxic damage in the pathological process of chronic glaucoma.

Keywords: 5-HT1A receptor; OFF-type RGCs; glaucoma; glutamate release; neuroprotection.


Figures

FIGURE 1
FIGURE 1
Chronic ocular hypertension and WAY-100635 upregulated GS expression in the rat retina, but this effect was reversed by 8-OH-DPAT. (A) Representative western blot of GS expression in control and glaucomatous retinas at 1, 2, 3, and 4 weeks after EVC and in glaucoma 4W + WAY-100635 retinas and glaucoma 4W + 8-OH-DPAT retinas. The expression of the 43 kDa protein was decreased from 1 week to up to 4 weeks after EVC. WAY-100635 upregulated GS expression and 8-OH-DPAT downregulated GS expression 4 weeks after glaucoma induction. (B) Densitometric analysis of GS expression from 1 to 4 weeks (n = 6) after EVC. GS expression was normalized to the expression in the control retinas. ANOVA, p < 0.05 vs. control retina, #p < 0.05 vs. glaucoma 4W + 8-OH-DPAT. W, week; GS, glutamate synthetase; L, the left eye; R, the right eye.
FIGURE 2
FIGURE 2
Chronic ocular hypertension and 8-OH-DPAT upregulated EAAT2 expression in the rat retina, but this effect was reversed by WAY-100635. (A) Representative western blot of EAAT2 expression in control and glaucomatous retinas 4 weeks after EVC and in glaucoma 4W + 8-OH-DPAT retinas and glaucoma 4W + WAY-100635 retinas. The expression of the 72 kDa protein was increased in the glaucomatous retinas and in the glaucoma 4W + 8-OH-DPAT group. WAY-100635 downregulated EAAT2 expression 4 weeks after glaucoma induction. (B) Densitometric analysis of EAAT2 expression in the glaucoma 4W and drug intervention groups (n = 7). EAAT2 expression was normalized to the expression in the control retinas. ANOVA, ∗∗p < 0.01 and ∗∗∗p < 0.001 vs. control retina, #p < 0.05 vs. glaucoma 4W + WAY-100635. W, week; EAAT, glutamate transporter.
FIGURE 3
FIGURE 3
Ocular hypertension did not significantly change the frequency or amplitude of sEPSCs and mEPSCs in RGCs. (A) Top: representative recording from a normal rat experiment. Vertical scale bar: 10 pA; horizontal scale bar: 0.5 s. Bottom: representative recording from a glaucomatous rat experiment. Vertical scale bar: 10 pA; horizontal scale bar: 0.5 s. Summarized data for the frequency (B) and amplitude (C) of sEPSCs between normal and glaucomatous RGCs (n = 7). (D) Top: representative recording from a normal rat experiment. Vertical scale bar: 10 pA; horizontal scale bar: 0.5 s. Bottom: representative recording from a glaucomatous rat experiment. Vertical scale bar: 10 pA; horizontal scale bar: 0.5 s. Summarized data for the frequency (E) and amplitude (F) of mEPSCs between normal and glaucomatous RGCs (n = 9). (G) The signal and noise can be identified under recording conditions in which TTX + SR95531 + strychnine + CNQX +AP5 are administered. (H) The enlarged AMPA component EPSCs in the blue box of (D); horizontal scale bar: 3 ms. (I) The enlarged NMDA component EPSCs in the blue box of (D); vertical scale bar: 10 pA; horizontal scale bar: 10 ms. The results in (B,C,E,F) are expressed as the mean ± standard error.
FIGURE 4
FIGURE 4
8-OH-DPAT significantly reduced the frequency, but not the amplitude, of glutamatergic sEPSCs in OFF-type RGCs. (A,B) The micrograph in (A) was taken with an infrared interferometric phase microscope, and the retinal layers can be seen. Representative Lucifer yellow-filled OFF-type RGCs with dendritic arborizations in the proximal (a) and distal (b) parts of the IPL are shown. GCL, ganglion cell layer; IPL, inner plexiform layer; INL, inner nuclear layer. Scale bar: 10 μm. (C) Representative traces showing the effect of 10 μM 8-OH-DPAT on glutamatergic sEPSCs. Vertical scale bar: 10 pA; horizontal scale bar: 1 s. (D) Summarized data from 11 RGCs showing that 10 μM 8-OH-DPAT significantly decreased the average frequency of glutamatergic sEPSCs. (E) Normalized glutamatergic sEPSC frequency (n = 11). (F) Summarized data from 11 RGCs showing that the average amplitude of glutamatergic sEPSCs was not significantly changed by 10 μM 8-OH-DPAT. (G) Normalized glutamatergic sEPSC amplitude (n = 11). p < 0.05 and ∗∗p < 0.01 vs. control, Student’s paired t-test.
FIGURE 5
FIGURE 5
WAY-100635 prevented the inhibitory effects of 8-OH-DPAT on sEPSCs in OFF-type RGCs. (A) Representative recordings during control conditions (A1), during WAY-100635 (10 μM) application (A2), during WAY-100635 (10 μM) + 8-OH-DPAT (10 μM) application (A3) and during recovery (A4). Vertical scale bar: 10 pA; horizontal scale bar: 0.5 s. After preincubation with WAY-100635 (10 μM), 8-OH-DPAT (10 μM) did not significantly change either the frequency (B) or amplitude (D) of EPSCs in RGCs (n = 8). (C,E) Normalized glutamatergic sEPSC frequency (n = 8) and amplitude. Note that WAY-100635 increased the baseline frequency (B,C) of the sEPSCs. p < 0.05, ANOVA.
FIGURE 6
FIGURE 6
8-OH-DPAT significantly decreased the frequency, but not the amplitude, of mEPSCs in OFF-type RGCs. (A) Representative traces showing the effect of 10 μM 8-OH-DPAT on mEPSCs. Vertical scale bar: 10 pA; horizontal scale bar: 0.5 s. (B,E) Frequency (10 s bin) and amplitude histograms of the mEPSCs from the trace in (A) showing the effects of 8-OH-DPAT. Summarized data from 11 RGCs showing that 10 μM 8-OH-DPAT significantly decreased the average frequency (C) and amplitude (F) of the mEPSCs. (D,G) Normalized mEPSC frequency and amplitude (n = 11). p < 0.05 and ∗∗∗p < 0.001 vs. control, Student’s paired t-test.
FIGURE 7
FIGURE 7
8-OH-DPAT-induced decreases in the frequency of mEPSCs in OFF-type RGCs were blocked by WAY-100635. (A) Representative recordings showing that WAY-100635 prevented 8-OH-DPAT-induced changes in mEPSC frequency. (A1) Control condition; (A2) during WAY-100635 treatment; (A3) during WAY-100635 + 8-OH-DPAT treatment; (A4) recovery. (B,E) Cumulative interevent interval and amplitude distributions of the mEPSCs in a representative neuron during control recording and during WAY-100635 and WAY-100635 + 8-OH-DPAT application. WAY-100635 and WAY-100635 + 8-OH-DPAT significantly shifted the distribution of interevent intervals to the left (B) but did not shift the distribution of mEPSC amplitudes (E). The WAY-100635 and WAY-100635 + 8-OH-DPAT-induced changes in the distribution of interevent intervals and amplitudes were statistically significant (n = 8). ∗∗∗p < 0.001, Kolmogorov–Smirnov test. Summarized data for the frequency (C) and amplitude (F) of the mEPSCs (n = 9). (D,G) Normalized mEPSC frequency and amplitude (n = 9). p < 0.05, ∗∗p < 0.01, and ∗∗∗ p < 0.001, ANOVA.
FIGURE 8
FIGURE 8
8-OH-DPAT did not change the amplitude of L-glutamate-induced current in OFF- and ON-type RGCs. The micrograph in (A) was taken with an infrared interferometric phase microscope, and the retinal layers can be seen. The microelectrode on the left was used for sealing the RGC, and the microelectrode on the right was used for pressure injection. (B) Bar graph illustrating no differences in the peak amplitudes of the responses recorded from control, 8-OH-DPAT and recovery conditions (n = 7). (C) Representative traces of L-glutamate-induced current during control (left), 8-OH-DPAT (middle), and wash (right) conditions. Vertical scale bar: 100 pA; horizontal scale bar: 5 s. GCL, ganglion cell layer; IPL, inner plexiform layer. Scale bar: 10 μm.
FIGURE 9
FIGURE 9
8-OH-DPAT did not change the frequency or amplitude of sEPSCs or mEPSCs in ON-type RGCs. (A,B) The micrograph in (A) was taken with an infrared interferometric phase microscope, and the retinal layers can be seen. Representative Lucifer yellow-filled ON-type RGCs with dendritic arborizations in the distal (b) parts of the IPL are shown. (C,D) Normalized sEPSC frequency and amplitude (n = 7). (E,F) Normalized mEPSC frequency and amplitude (n = 10). GCL, ganglion cell layer; IPL, inner plexiform layer. Scale bar: 10 μm. a, the dendritic arborizations in the proximal (a) parts of the IPL.

References

    1. Akaike A. (2006). Preclinical evidence of neuroprotection by cholinesterase inhibitors. Alzheimer Dis. Assoc. Disord. 20(2 Suppl. 1), S8–S11. 10.1097/01.wad.0000213802.74434.d6 - DOI - PubMed
    1. Almasieh M., Wilson A. M., Morquette B., Cueva Vargas J. L., Di Polo A. (2012). The molecular basis of retinal ganglion cell death in glaucoma. Prog. Retin. Eye Res. 31 152–181. 10.1016/j.preteyeres.2011.11.002 - DOI - PubMed
    1. Bai N., Aida T., Yanagisawa M., Katou S., Sakimura K., Mishina M., et al. (2013). NMDA receptor subunits have different roles in NMDA-induced neurotoxicity in the retina. Mol. Brain 6:34. 10.1186/1756-6606-6-34 - DOI - PMC - PubMed
    1. Bjorn-Yoshimoto W. E., Underhill S. M. (2016). The importance of the excitatory amino acid transporter 3 (EAAT3). Neurochem. Int. 98 4–18. 10.1016/j.neuint.2016.05.007 - DOI - PMC - PubMed
    1. Chang Q., Martin L. J. (2009). Glycinergic innervation of motoneurons is deficient in amyotrophic lateral sclerosis mice: a quantitative confocal analysis. Am. J. Pathol. 174 574–585. 10.2353/ajpath.2009.080557 - DOI - PMC - PubMed