. 2019 May 3:10:991.
doi: 10.3389/fimmu.2019.00991. eCollection 2019.

MASP-1 Increases Endothelial Permeability

Affiliations

MASP-1 Increases Endothelial Permeability

Márta L Debreczeni et al. Front Immunol. .

Abstract

Pathologically increased vascular permeability is an important dysfunction in the pathomechanism of life-threatening conditions, such as sepsis, ischemia/reperfusion, or hereditary angioedema (HAE), diseases accompanied by uncontrolled activation of the complement system. HAE for example is caused by the deficiency of C1-inhibitor (the main regulator of early complement activation), which leads to edematous attacks threatening with circulatory collapse. We have previously reported that endothelial cells become activated during HAE attacks. A natural target of C1-inhibitor is mannan-binding lectin-associated serine protease-1 (MASP-1), a multifunctional serine protease, which plays a key role in the activation of complement lectin pathway. We have previously shown that MASP-1 induces the pro-inflammatory activation of endothelial cells and in this study we investigated whether MASP-1 can directly affect endothelial permeability. All experiments were performed on human umbilical vein endothelial cells (HUVECs). Real-time micro electric sensing revealed that MASP-1 decreases the impedance of HUVEC monolayers and in a recently developed permeability test (XperT), MASP-1 dose-dependently increased endothelial paracellular transport. We show that protease activated receptor-1 mediated intracellular Ca2+-mobilization, Rho-kinase activation dependent myosin light chain (MLC) phosphorylation, cytoskeletal actin rearrangement, and disruption of interendothelial junctions are underlying this phenomenon. Furthermore, in a whole-transcriptome microarray analysis MASP-1 significantly changed the expression of 25 permeability-related genes in HUVECs-for example it up-regulated bradykinin B2 receptor expression. According to our results, MASP-1 has potent permeability increasing effects. During infections or injuries MASP-1 may help eliminate the microbes and/or tissue debris by enhancing the extravasation of soluble and cellular components of the immune system, however, it may also play a role in the pathomechanism of diseases, where edema formation and complement lectin pathway activation are simultaneously present. Our findings also raise the possibility that MASP-1 may be a promising target of anti-edema drug development.

Keywords: C1-inhibitor; MASP-1; PAR-1; XPerT assay; angioedema; endothelial cell; permeability; transcriptome analysis.


Figures

Figure 1
Figure 1
rMASP-1 treatment reversibly decreases the impedance of the endothelial monolayer. 96 well E-plate (Roche, Hungary) mounted by golden microelectronic sensor arrays was pre-coated with 0.5% gelatin, and HUVECs were seeded onto the surface and cultured for 3 days. Confluent HUVEC monolayers were treated with 2 μM rMASP-1 or 100 nM thrombin or the culture medium only. Throughout the experiments, cells were kept in incubator at 37°C and monitored every 1 min. Cell index for each time point was determined using the following formula: (Rn—Rb)/15, where Rn is the cell-electrode impedance of the well when it contains cells and Rb is the background impedance of the well with the medium alone. Values of cell index are therefore dimensionless and are directly proportional to the electrical permeability of the cell layer. Cell indices of MASP-1 and thrombin treated cells were normalized with that of the control (cells treated with growth medium only). Representative of three independent experiments. The arrow indicates the addition of treatment.
Figure 2
Figure 2
rMASP-1 treatment increases endothelial permeability. Confluent layers of HUVECs were seeded onto 96 well plates pre-coated with biotinylated gelatin and were treated with various concentrations of rMASP-1 or a mixture of rMASP-1 and its inhibitors SGMI-1 or C1-inhibitor together or with the culture medium alone (control) for 20 min. Streptavidin-Alexa488 was added to each well, and after cell fixation, pictures were taken using an Olympus IX-81 fluorescence microscope and an Olympus XM-10 camera with 10x magnification Olympus lenses (numerical aperture: 0.3). (A) Representative images of three independent experiments. The scale bar applies to all photomicrographs. (B) Size of the stained area was determined on each image using the CellP software. Mean values of three independent experiments normalized to the controls are shown. ***p < 0.005, compared to the control, analyzed by one-way ANOVA and post-test for linear trend; ns, non-significant; ###p < 0.005, compared to the 2 μM rMASP-1 treated.
Figure 3
Figure 3
PAR-1 mediates the rMASP-1 triggered intracellular Ca2+ mobilization in HUVECs. Confluent layers of HUVECs were seeded onto 96 well plates and cultured for 1 day. Cells were loaded with Fluo-4 AM. (A,B) Sequential images were obtained every 5 s by fluorescence microscopy using an Olympus IX-81 fluorescence microscope and an Olympus XM-10 camera with 20x magnification Olympus lenses (numerical aperture: 0.45). Three photos were taken to determine the baseline fluorescence, then cells were treated with 2 μM rMASP-1 or PAR-agonists (4 μM PAR-1 agonist, 0.4 μM PAR-2 agonist or 1 mM PAR-4 agonist) or the culture medium only (control). (C,D) Cells were pretreated with or without PAR antagonists (0.68 μM PAR-1 antagonist; 20 μM PAR-2 antagonist or 0.28 μM PAR-4 antagonist) for 10 min. Sequential images were obtained every 5 s by fluorescence microscopy. Three photos were taken to determine the baseline fluorescence, then cells were treated with rMASP-1 or with culture medium alone (control) and the response was measured for 2 min. Images were then analyzed using the CellP software. (A,C) data from a single, representative experiment, where fluorescence intensity values were background corrected and normalized to the control. (B) Means of the maximum fluorescence intensity values normalized to that of the control are presented. Data from three independent experiments. (D) Means of the maximum fluorescence intensity values are expressed as the percentage of rMASP-1 treatment (control: 0%). Data from three independent experiments. ***p < 0.005, compared to the control; ###p < 0.005 compared to the rMASP-1 treated; ns, non-significant.
Figure 4
Figure 4
PAR-1 and ROCK plays a key role in the rMASP-1 induced endothelial permeability. Confluent layers of HUVECs were seeded onto 96 well plates pre-coated with biotinylated gelatin and were cultured for 2 days. Following cell treatment, streptavidin-Alexa488 was added to each well and after cell fixation, pictures were taken using fluorescence microscopy using an Olympus IX-81 fluorescence microscope and an Olympus XM-10 camera with 10x magnification Olympus lenses (numerical aperture: 0.3). Size of the stained area was determined on each image using the CellP software in three independent experiments. (A) Cells were treated with 2 μM rMASP-1 or PAR-agonists (4 μM PAR-1 agonist, 0.4 μM PAR-2 agonist or 1 mM PAR-4 agonist) or the culture medium alone for 20 min. Values are expressed as fold-change relative to the control. (B) Cells were pretreated with or without PAR antagonists (0.68 μM PAR-1 antagonist; 20 μM PAR-2 antagonist or 0.28 μM PAR-4 antagonist) for 10 min then were treated with 2 μM rMASP-1 for 20 min. Values are expressed as the percentage of rMASP-1 treatment (0% = cells treated only with the culture medium). ***p < 0.005, compared to the control; ###p < 0.005, compared to rMASP-1 treated; ns, non-significant.
Figure 5
Figure 5
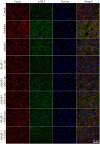
rMASP-1 treatment reorganizes the actin cytoskeleton of endothelial cells. Confluent layers of HUVECs were seeded onto 18 well ibidi™ slides and were cultured for 2 days. Cells were pretreated with or without PAR antagonists (0.68 μM PAR-1 antagonist; 20 μM PAR-2 antagonist or 0.28 μM PAR-4 antagonist) for 10 min or 2.5 μM ROCK inhibitor (Y-27632) for 15 min, then were treated with 2 μM rMASP-1 or 300 nM thrombin for 20 min. Cells treated with culture medium only served as a negative control. After fixation, cells were stained with anti-pMLC antibody. F-actin cytoskeleton was stained with phalloidin-Alexa488, cell nuclei were labeled with Hoechst 33258 and pictures were taken using an Olympus IX-81 fluorescence microscope and an Olympus XM-10 camera with 40x magnification Olympus lenses (numerical aperture: 0.75). Representative images from three independent experiments are shown. The scale bar applies to all photomicrographs.
Figure 6
Figure 6
rMASP-1 treatment changes the pattern of endothelial cell adhesion molecules. Confluent layers of HUVECs were seeded onto 18 well ibidi™ slides and cultured for 2 days. Cells were either treated with 300 nM thrombin, 2 μM rMASP-1, a mixture of rMASP-1 and C1-inhibitor or with the culture medium alone (control) for 20 min. After fixation, cells were stained with anti-VE-cadherin, anti-ZO-1, or anti PECAM-1 antibodies (green). Cell nuclei were labeled with Hoechst 33258 (blue) and images were taken using an Olympus IX-81 fluorescence microscope and an Olympus XM-10 camera with 40x magnification Olympus lenses (numerical aperture: 0.75). Representative images from three independent experiments are shown. The scale bar applies to all photomicrographs. In the case of adhesion molecule VE-cadherin and intracellular adaptor ZO-1, the untreated control shows a well-organized, uninterrupted network of junctional molecules in the cell-cell junction areas, while rMASP-1 treatment (similarly to the positive control thrombin) resulted in a prominent disruption of this pattern (white arrows) indicating paracellular gap formation. This effect of rMASP-1 was completely blocked by C1-INH. A clear visualization of paracellular gaps can be seen in the case of adhesion molecule PECAM-1 as it is distributed evenly throughout the cell surface. Untreated cells form a continuous layer, while in response to rMASP-1 treatment, cells moved apart from each other to form paracellular gaps (white arrows), which was completely inhibited by C1-INH.

References

    1. Pavlov VI, Skjoedt MO, Siow Tan Y, Rosbjerg A, Garred P, Stahl GL. Endogenous and natural complement inhibitor attenuates myocardial injury and arterial thrombogenesis. Circulation. (2012) 126:2227–35. 10.1161/CIRCULATIONAHA.112.123968 - DOI - PMC - PubMed
    1. Dobó J, Pál G, Cervenak L, Gál P. The emerging roles of mannose-binding lectin-associated serine proteases (MASPs) in the lectin pathway of complement and beyond. Immunol Rev. (2016) 274:98–111. 10.1111/imr.12460 - DOI - PubMed
    1. Héja D, Kocsis A, Dobó J, Szilágyi K, Szász R, Závodszky P, et al. . Revised mechanism of complement lectin-pathway activation revealing the role of serine protease MASP-1 as the exclusive activator of MASP-2. Proc Natl Acad Sci USA. (2012b) 109:10498–503. 10.1073/pnas.1202588109 - DOI - PMC - PubMed
    1. Megyeri M, Harmat V, Major B, Végh Á, Balczer J, Héja D, et al. . Quantitative characterization of the activation steps of mannan-binding lectin (MBL)-associated serine proteases (MASPs) points to the central role of MASP-1 in the initiation of the complement lectin pathway. J Biol Chem. (2013) 288:8922–34. 10.1074/jbc.M112.446500 - DOI - PMC - PubMed
    1. Dobó J, Harmat V, Beinrohr L, Sebestyén E, Závodszky P, Gál P. MASP-1, a promiscuous complement protease: structure of its catalytic region reveals the basis of its broad specificity. J Immunol. (2009) 183:1207–14. 10.4049/jimmunol.0901141 - DOI - PubMed

Publication types

MeSH terms

Substances