Review
. 2019 May 3:10:421.
doi: 10.3389/fgene.2019.00421. eCollection 2019.

DiVenn: An Interactive and Integrated Web-Based Visualization Tool for Comparing Gene Lists

Affiliations
Review

DiVenn: An Interactive and Integrated Web-Based Visualization Tool for Comparing Gene Lists

Liang Sun et al. Front Genet. .

Abstract

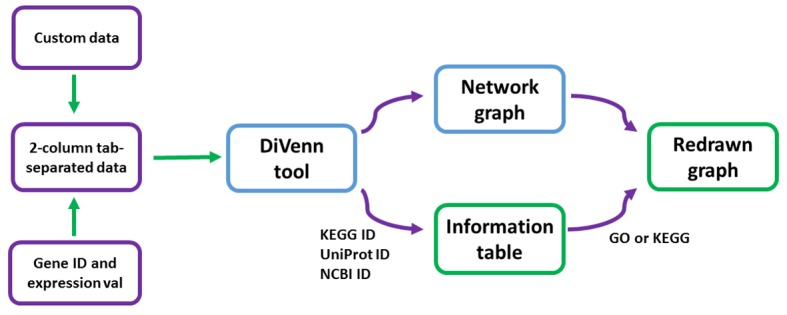
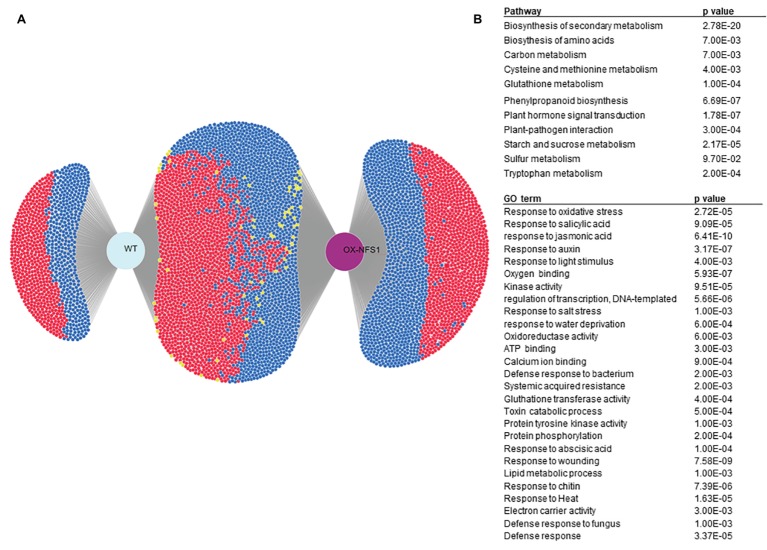
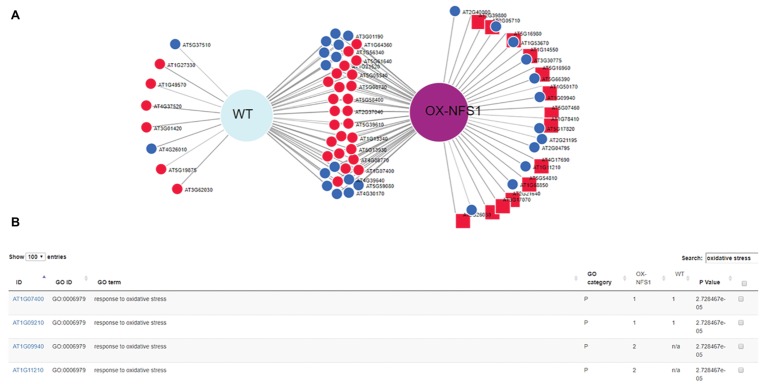
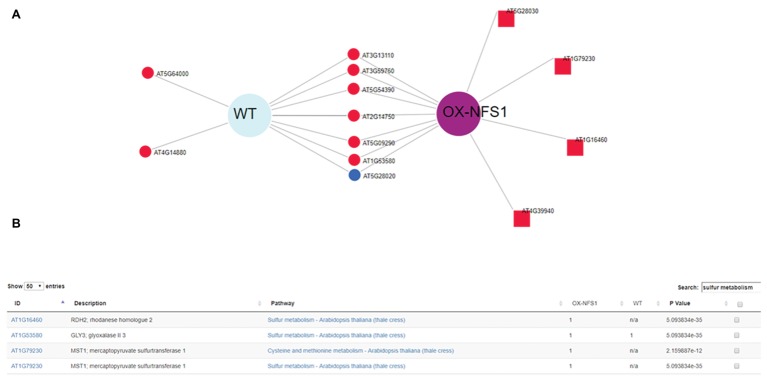
Gene expression data generated from multiple biological samples (mutant, double mutant, and wild-type) are often compared via Venn diagram tools. It is of great interest to know the expression pattern between overlapping genes and their associated gene pathways or gene ontology (GO) terms. We developed DiVenn (Dive into the Venn diagram and create a force directed graph)-a novel web-based tool that compares gene lists from multiple RNA-Seq experiments in a force-directed graph, which shows the gene regulation levels for each gene and integrated KEGG pathway and gene ontology knowledge for the data visualization. DiVenn has four key features: (1) informative force-directed graph with gene expression levels to compare multiple data sets; (2) interactive visualization with biological annotations and integrated pathway and GO databases, which can be used to subset or highlight gene nodes to pathway or GO terms of interest in the graph; (3) Pathway and GO enrichment analysis of all or selected genes in the graph; and (4) high resolution image and gene-associated information export. DiVenn is freely available at http://divenn.noble.org/.

Keywords: KEGG; Venn diagram; gene ontology; pathogen infection; transcriptome data; visualization.


Figures

Figure 1
Figure 1
Flow chart of DiVenn. Two-column tab-separated gene ID and expression value data from supported 14 species can be used to redraw the graph based on the KEGG or GO information table.
Figure 2
Figure 2
DiVenn case study showing differentially expressed genes between WT and NFS1 overexpression line (OX-NFS1) in Arabidopsis upon bacterial pathogen inoculation. (A) Differentially expressed genes, up and downregulated (log2(FC)≤ −2 and ≥2) between 0 and 3 days, after pathogen inoculation in Arabidopsis for WT and OX-NFS1 plants. Blue and red nodes denote downregulated and upregulated genes between different genotypes, respectively. Yellow nodes denote upregulation in one sample but downregulation in another. (B) Several pathways and GO terms significantly enriched (p < 0.05) in our dataset.
Figure 3
Figure 3
DiVenn subset analysis of genes obtained using redraw function from gene ontology (GO) search “oxidative stress” displaying 73 DE genes up and downregulated from OX-NFS1 and WT. (A) Genes upregulated only for OX-NFS1 are highlighted as square nodes via the redraw function. (B) Table consisting of genes from subset graphic GO search “oxidative stress” displaying DE genes between the two genotypes OX-NFS1 and WT (just the four first rows out of 73) and GO category p’s. The numbers 1 and 2 refer to upregulated and downregulated genes, respectively, for each Arabidopsis gene accession number.
Figure 4
Figure 4
DiVenn subset analysis of genes obtained using redraw function from KEGG pathway analysis search “sulfur metabolism” showing 14 DE genes up and downregulated from OX-NFS1 and WT. (A) Genes upregulated only for OX-NFS1 are highlighted as square nodes via the redraw function. (B) Table consisting of genes from subset graphic KEGG pathway search “sulfur metabolite” displaying DE genes between the two genotypes OX-NFS1 and WT (just first four rows out of 14) and pathway p’s. The numbers 1 and 2 refer to upregulated and downregulated genes, respectively, for each Arabidopsis gene accession number.

References

    1. Benson D. A., Cavanaugh M., Clark K., Karsch-Mizrachi I., Ostell J., Pruitt K. D., et al. . (2018). GenBank. Nucleic Acids Res. 46, D41–D47. 10.1093/nar/gkx1094, PMID: - DOI - PMC - PubMed
    1. Bostock M., Ogievetsky V., Heer J. (2011). D(3): data-driven documents. IEEE Trans. Vis. Comput. Graph. 17, 2301–2309. 10.1109/TVCG.2011.185, PMID: - DOI - PubMed
    1. Du Z., Zhou X., Ling Y., Zhang Z., Su Z. (2010). agriGO: a GO analysis toolkit for the agricultural community. Nucleic Acids Res. 38, W64–W70. 10.1093/nar/gkq310, PMID: - DOI - PMC - PubMed
    1. Heberle H., Meirelles G. V., Da Silva F. R., Telles G. P., Minghim R. (2015). InteractiVenn: a web-based tool for the analysis of sets through Venn diagrams. BMC Bioinformatics 16:169. 10.1186/s12859-015-0611-3 - DOI - PMC - PubMed
    1. Jiao X. L., Sherman B. T., Huang D. W., Stephens R., Baseler M. W., Lane H. C., et al. . (2012). DAVID-WS: a stateful web service to facilitate gene/protein list analysis. Bioinformatics 28, 1805–1806. 10.1093/bioinformatics/bts251, PMID: - DOI - PMC - PubMed