. 2019 Jan;1(1):47-57.
doi: 10.1038/s42255-018-0009-4. Epub 2019 Jan 7.

Slc12a8 is a nicotinamide mononucleotide transporter

Affiliations

Slc12a8 is a nicotinamide mononucleotide transporter

Alessia Grozio et al. Nat Metab. 2019 Jan.

Erratum in

Abstract

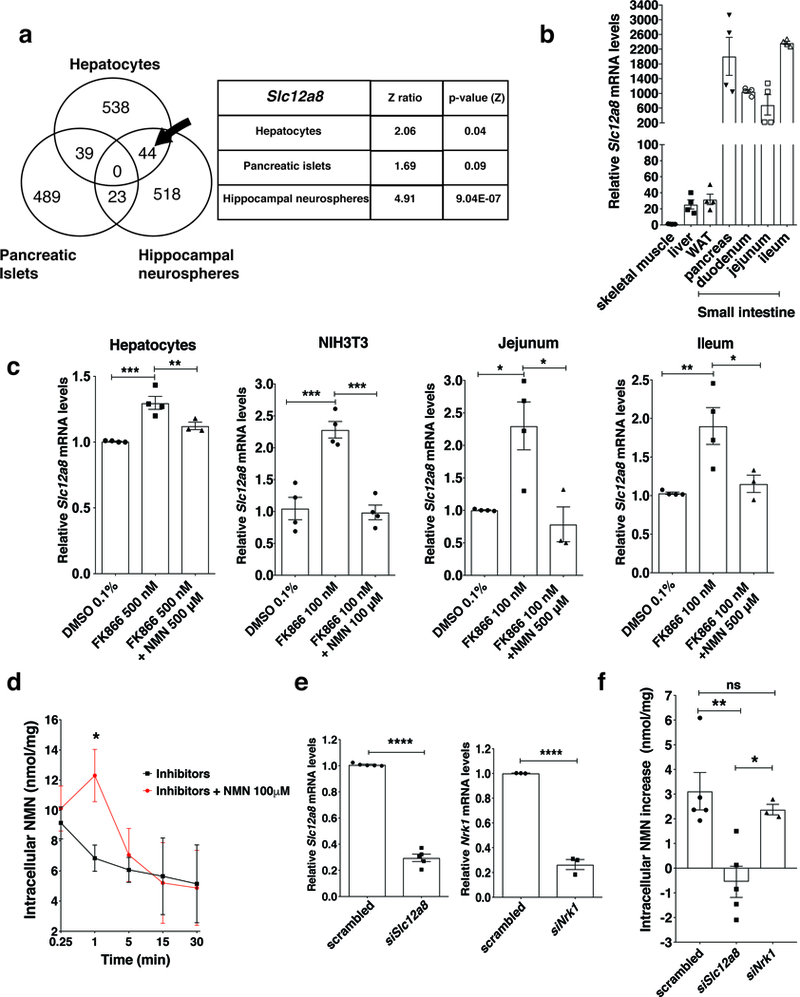
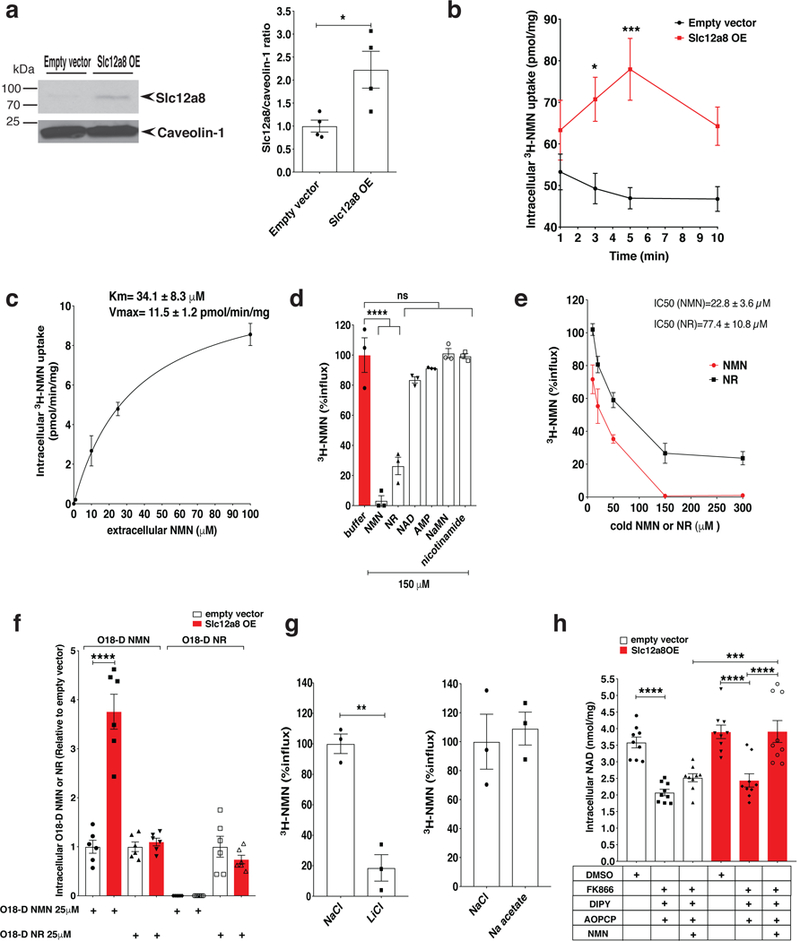
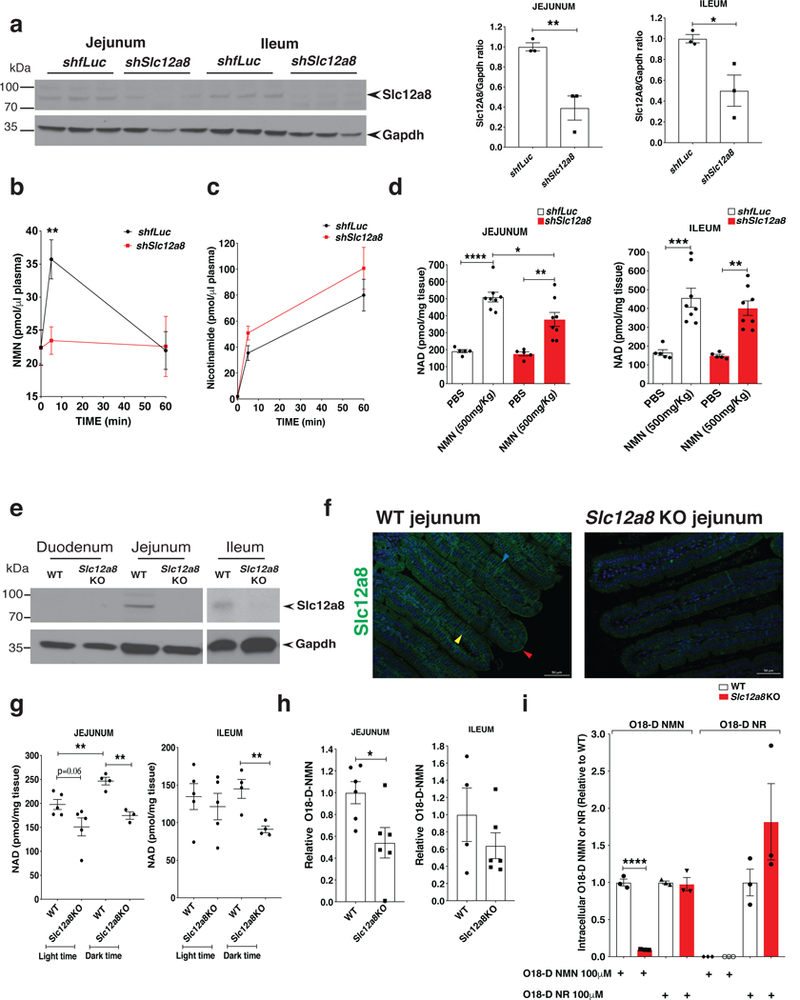
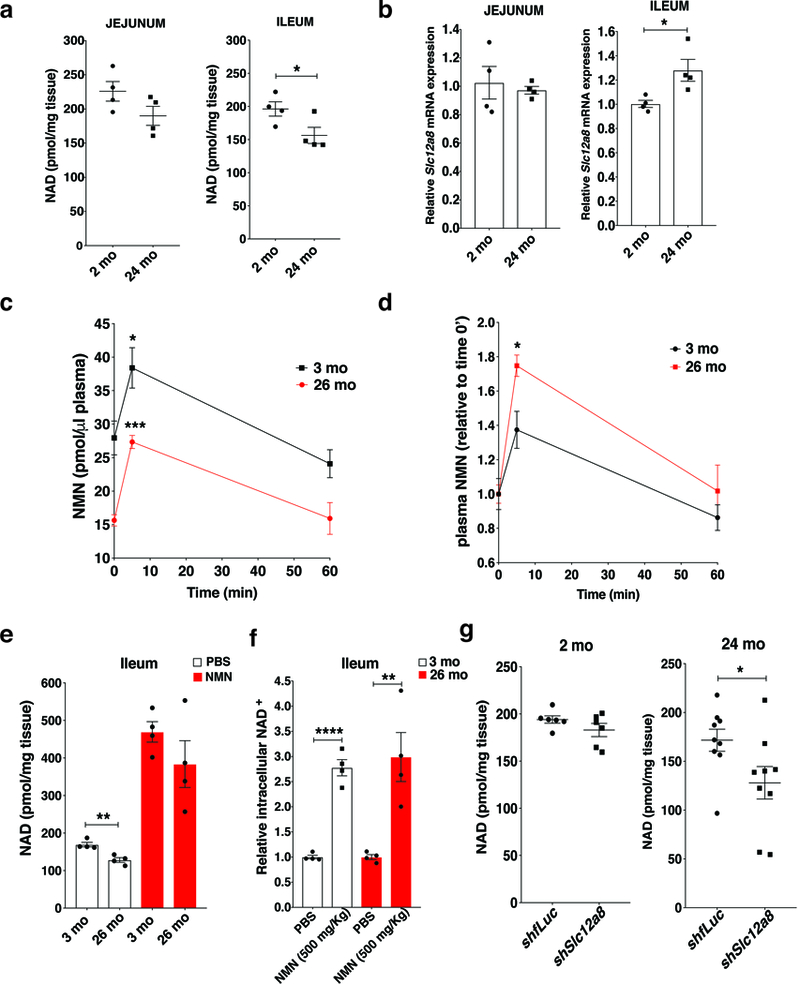
Nicotinamide mononucleotide (NMN) is a biosynthetic precursor of NAD+ known to promote cellular NAD+ production and counteract age-associated pathologies associated with a decline in tissue NAD+ levels. How NMN is taken up into cells has not been entirely clear. Here we show that the Slc12a8 gene encodes a specific NMN transporter. We find that Slc12a8 is highly expressed and regulated by NAD+ in the murine small intestine. Slc12a8 knockdown abrogates the uptake of NMN in vitro and in vivo. We further show that Slc12a8 specifically transports NMN, but not nicotinamide riboside, and that NMN transport depends on the presence of sodium ion. Slc12a8 deficiency significantly decreases NAD+ levels in the jejunum and ileum, which is associated with reduced NMN uptake as traced by doubly labeled isotopic NMN. Finally, we observe that Slc12a8 expression is upregulated in the aged murine ileum, which contributes to the maintenance of ileal NAD+ levels. Our work identifies the first NMN transporter and demonstrates that Slc12a8 has a critical role in regulating intestinal NAD+ metabolism.


Figures

Figure 1.
Figure 1.
Identification and characterization of the Slc12a8 gene. a, Venn diagram of genes commonly upregulated in primary hepatocytes, pancreatic islets, and hippocampal neurospheres treated with FK866. Slc12a8 was identified in the section indicated by an arrow. Z ratios and two-sided p values for Slc12a8 in each cell type were calculated as described in the Methods section (n=4 biologically independent samples). b, Relative Slc12a8 mRNA levels in different tissues from B6 male mice at 3 months of age (n=4 mice). WAT, white adipose tissue. c, Relative Slc12a8 mRNA levels in primary mouse hepatocytes (n=4 mice, ** p=0.0191, ***p=0.0006), NIH3T3 fibroblasts (n=4 biologically independent samples, DMSO vs. FK866 ***p=0.0004, FK866 vs. FK866 plus NMN ***p=0.0003), and ex vivo explants of the jejunum and ileum (n=4 mice for DMSO and FK866 alone; n=3 mice for FK866 plus NMN; Jejunum, DMSO vs. FK866 *p=0.0168, FK866 vs. FK866+NMN *p=0.0111; Ileum, DMSO vs. FK866 **p=0.009, FK866 vs. FK866+NMN *p=0.0313) treated with 0.1% DMSO, FK866 alone or FK866 plus NMN (24h for cells, and 4 h for explants; analyzed using ANOVA with Tukey’s test). d, Time course of NMN uptake in mouse primary hepatocytes. Hepatocytes were pretreated with 500 nM FK866 for 24 h and then incubated with a cocktail of 20 μM dipyridamole, 500 μM AOPCP, and 500 nM FK866, with or without 100 μM NMN. NMN was measured by HPLC (n=4 mice, except for 3 data sets for 15 and 30 time points for inhibitors only; analyzed using ANOVA with Sidak’s test, *p=0.0262). e, Knockdown efficiencies of Slc12a8 and Nrk1 mRNA in mouse primary hepatocytes (n=5 mice for Slc12a8 silencing and n=3 for Nrk1 silencing; analyzed by unpaired two-sided t-test, siSlc12a8 ****p<0.0001, siNrk1 ****p<0.0001). f, Increases in intracellular NMN content measured by HPLC in primary hepatocytes treated with scrambled, Slc12a8, and Nrk1 siRNA at 1 min after addition of 100 μM NMN. Culture conditions were the same as described in d (n=5 mice for Slc12a8 silencing and n=3 for Nrk1 silencing; analyzed by ANOVA with Tukey’s test, **p=0.0052, *p=0.0413). All values are presented as mean ± SEM.
Figure 2.
Figure 2.
The kinetic features of the Slc12a8 NMN transporter and its specificity, sodium dependency, and effects on NAD+ biosynthesis. a, Slc12a8 protein expression in plasma membrane fractions from control and Slc12a8-OE NIH3T3 cells (left panel). Slc12a8 protein levels normalized to caveolin-1 protein levels are shown for each cell line (right panel; n=4 independent experiments; analyzed by unpaired two-sided t-test, *p=0.0271). b, Uptake of 3H-labeled NMN (3H-NMN; 25 μM, 37°C) in control and Slc12a8-OE NIH3T3 cells (n=12 biologically independent samples; analyzed by ANOVA with Sidak’s test, *p=0.0136, ***p=0.0001). c, Km and Vmax of Slc12a8 for NMN transport. Those values were determined by non-linear regression analysis by subtracting the backgrounds of control cells (n=5 biologically independent samples for 1 and 10 μM, and n=4 biologically independent samples for 25 and 100 μM). d, Substrate specificity of Slc12a8. Transport of 3H-NMN (150 nM, 25°C) into proteoliposomes derived from Slc12a8-OE cells was measured at 2 min in the presence of competing cold compounds (n=3 biologically independent samples, analyzed by ANOVA with Dunnett’s test, ****p=0.0001; ns, not significant). e, The half maximal inhibitory concentrations (IC50) of NMN and NR. Data are shown as percentages of 3H-NMN uptake (n=3 biologically independent samples; IC50 was calculated by non-linear regression analysis). f, Intracellular levels of doubly labeled, isotopic NMN (O18-D-NMN) and NR (O18-D-NR) were measured by mass spectrometry in control and Slc12a8-OE NIH3T3 cells incubated with 25 μM O18-D-NMN or O18-D-NR for 5 min (n=6 biologically independent samples; analyzed by unpaired two-sided t-test, ****p<0.0001). Values are expressed relative to O18-D-NMN or O18-D-NR levels detected in control NIH3T3 cells. g, Ion dependency of NMN uptake by Slc12a8. Sodium ion (Na+) or chloride ion (Cl-) was replaced with an equimolar concentration of lithium (Li+) or acetate, respectively (n=3 biologically independent samples, analyzed by unpaired two-sided t-test, **p=0.0017). h, Intracellular NAD+ content was measured as described in the Methods section (n=9 biologically independent samples; analyzed by ANOVA with Tukey’s test; control, DMSO vs inhibitors ****p<0.0001; Slc12a8-OE, DMSO vs. inhibitors ****p<0.0001, inhibitors vs. inhibitors+NMN ****p<0.0001; control, inhibitors+NMN vs. Slc12a8-OE, inhibitors+NMN ***p=0.0002). All values are presented as mean ± SEM.
Figure 3.
Figure 3.
The in vivo knockdown (KD) of Slc12a8 in the small intestine. a, Slc12a8 protein levels in control and Slc12a8 KD jejunum and ileum samples. A representative Western blot is shown (left panel), and bar graphs show Slc12a8 protein levels normalized to Gapdh protein levels (right panel) (n=3 mice, repeated twice; B6 males at 3–4 months of age; analyzed by unpaired two-sided t-test, *p=0.0324, **p=0.0085). b, Plasma NMN levels after an oral gavage of NMN (500 mg/kg body weight) in control and Slc12a8 KD mice (n=6 mice; B6 males at 3–4 months of age; analyzed by ANOVA with Sidak’s test, **p=0.0080). c, Plasma nicotinamide levels in the same mice described in b (n=6 mice). d, Tissue NAD+ levels in the jejunum and ileum samples collected at 60 min time point after an oral gavage, as described in b (n=5 mice for PBS, and n=8 for NMN; B6 males at 3–4 months of age; analyzed by ANOVA with Tukey’s test; Jejunum, shfLuc PBS vs. NMN **** p<0.0001, shSlc12a8 PBS vs. NMN **p=0.0029, shfLuc NMN vs. shSlc12a8 NMN *p=0.0029; Ileum, shfLuc PBS vs. NMN ***p=0.0003, shSlc12a8 PBS vs. NMN **p=0.0030 ). e, Slc12a8 and Gapdh proteins in tissue lysates of the duodenum, jejunum, and ileum of Slc12a8KO mice and wild-type littermates (WT) (n=3 mice). f, Immunostaining of Slc12a8 (green) in the jejunum from 10 month-old Slc12a8KO female mice and WT littermates (n=3 mice). Red, blue, and yellow arrowheads indicate apical, lateral and basal membranes, respectively. Scale bars: 50 μm. g, Tissue NAD+ levels in the jejunum and ileum from Slc12a8KO mice and WT littermates, collected during light time (9–10 am) or during dark time (9–10 pm) (n=5 mice for the light time, and n=4 mice for the dark time, except for the 3 data points for the jejunum of Slc12a8KO mice; females at 8–10 months of age; analyzed by unpaired two-sided t-test; Jejunum, dark time WT vs. Slc12a8KO **p=0.0015, light time WT vs. dark time WT **p=0.0093; Ileum, dark time WT vs. Slc12a8KO **p=0.0069). h, Levels of doubly labeled, isotopic NMN (O18-D-NMN) in the jejunum and ileum by mass spectrometry at 10 min after orally administering 500 mg/kg of O18-D-NMN in Slc12a8KO mice and WT littermates (n=6 mice, 3 males and 3 females at 7–8 months of age, except for 2 males and 2 females for the wild-type ileum; analyzed by unpaired two-sided t-test, *p=0.0239). Values are expressed relative to O18-D-NMN levels detected in WT. i, Intracellular levels of O18-D-NMN and O18-D-NR by mass spectrometry in primary hepatocytes isolated from 5 month-old Slc12a8KO male mice and WT littermates and incubated with 100 μM O18-D-NMN or O18-D-NR for 5 min (n=3 mice; analyzed by unpaired two-sided t-test, ****p<0.0001). Values are expressed relative to O18-D-NMN or O18-D-NR levels detected in WT. All values are presented as mean ± SEM.
Figure 4.
Figure 4.
The age-associated upregulation of Slc12a8 in the ileum and its effect on NMN uptake and ileal NAD+ biosynthesis in aged mice. a, b, NAD+ levels (a) and relative Slc12a8 mRNA levels (b) in the jejuna and ilea from 2 month-old (2 mo) and 24-month-old (24 mo) B6 female mice. Tissue samples were collected during the dark time (9–10 pm) (n=4 mice for each age, analyzed by unpaired two-sided t-test; NAD+ levels, *p=0.0492; Slc12a8 mRNA levels, *p=0.0269). c, d, Plasma NMN levels (c) and their relative changes (d) after an oral gavage of NMN (500 mg/kg body weight) in 3 month-old (3 mo) and 26 month-old (26 mo) B6 female mice (n=4 mice; analyzed by ANOVA with Sidak’s test; c, *p= 0.0328, ***p=0.0010; d, *p= 0.0257). e, f, Ileal NAD+ levels (e) and their relative comparisons (f) in the ileal samples collected at 60 min time point after an oral gavage in 3 month-old (3 mo) and 26 month-old (26 mo) B6 female mice (n=4 mice each for PBS and NMN, analyzed by unpaired two-sided t-test; e, **p=0.0033; f, **p=0.0066 **** p<0.0001). g, NAD+ levels in the ilea of 2 and 24 month-old control and intestinal Slc12a8 KD B6 female mice (n=6 mice each for 2 month-old control and intestinal Slc12a8-KD B6 female mice, and n=9 mice each for 24 month-old control and intestinal Slc12a8 KD B6 female mice; analyzed by unpaired two-sided t-test, *p=0.0496). All values are presented as mean ± SEM.

Comment in

References

    1. Canto C, Menzies KJ & Auwerx J NAD(+) Metabolism and the Control of Energy Homeostasis: A Balancing Act between Mitochondria and the Nucleus. Cell Metab. 22, 31–53, doi:10.1016/j.cmet.2015.05.023 (2015). - DOI - PMC - PubMed
    1. Rajman L, Chwalek K & Sinclair DA Therapeutic Potential of NAD-Boosting Molecules: The In Vivo Evidence. Cell Metab 27, 529–547, doi:10.1016/j.cmet.2018.02.011 (2018). - DOI - PMC - PubMed
    1. Verdin E NAD(+) in aging, metabolism, and neurodegeneration. Science 350, 1208–1213, doi:10.1126/science.aac4854 (2015). - DOI - PubMed
    1. Yoshino J, Baur JA & Imai SI NAD(+) Intermediates: The Biology and Therapeutic Potential of NMN and NR. Cell Metab 27, 513–528, doi:10.1016/j.cmet.2017.11.002 (2018). - DOI - PMC - PubMed
    1. Yoshino J, Mills KF, Yoon MJ & Imai S Nicotinamide mononucleotide, a key NAD(+) intermediate, treats the pathophysiology of diet- and age-induced diabetes in mice. Cell Metab. 14, 528–536, doi:S1550-4131(11)00346-9[pii]10.1016/j.cmet.2011.08.014 (2011). - PMC - PubMed

Publication types