

Structures and mechanism of transcription initiation by bacterial ECF factors
- PMID: 31131408
- PMCID: PMC6648896
- DOI: 10.1093/nar/gkz470
Structures and mechanism of transcription initiation by bacterial ECF factors
Abstract
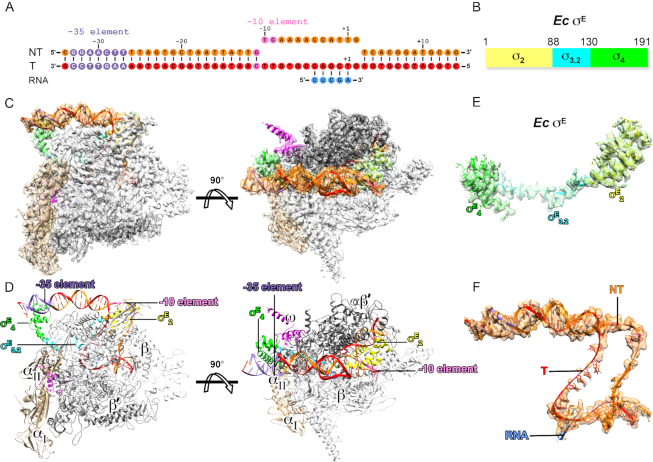
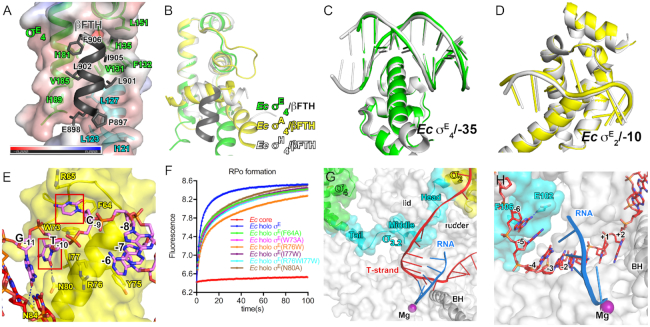
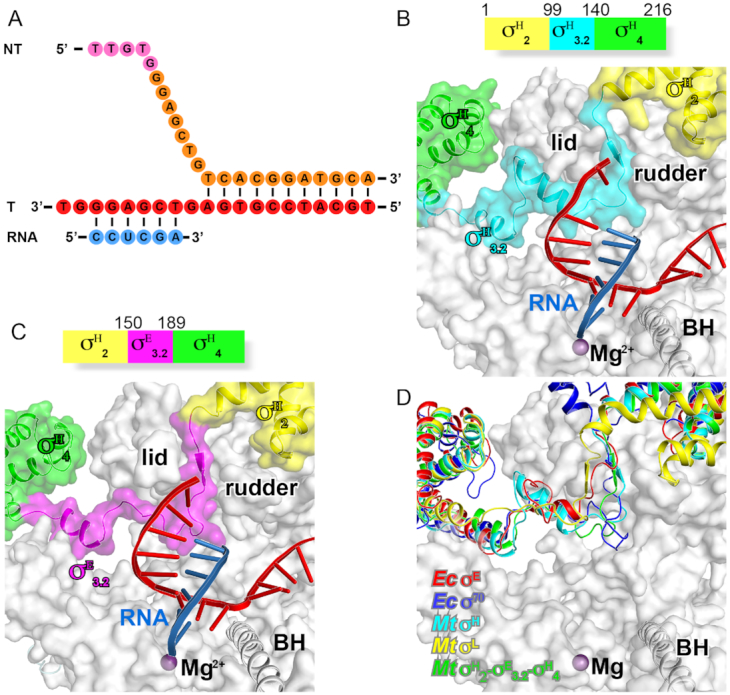
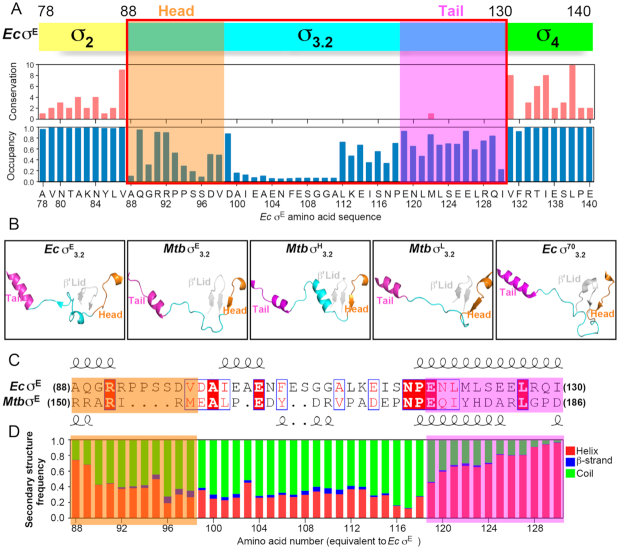
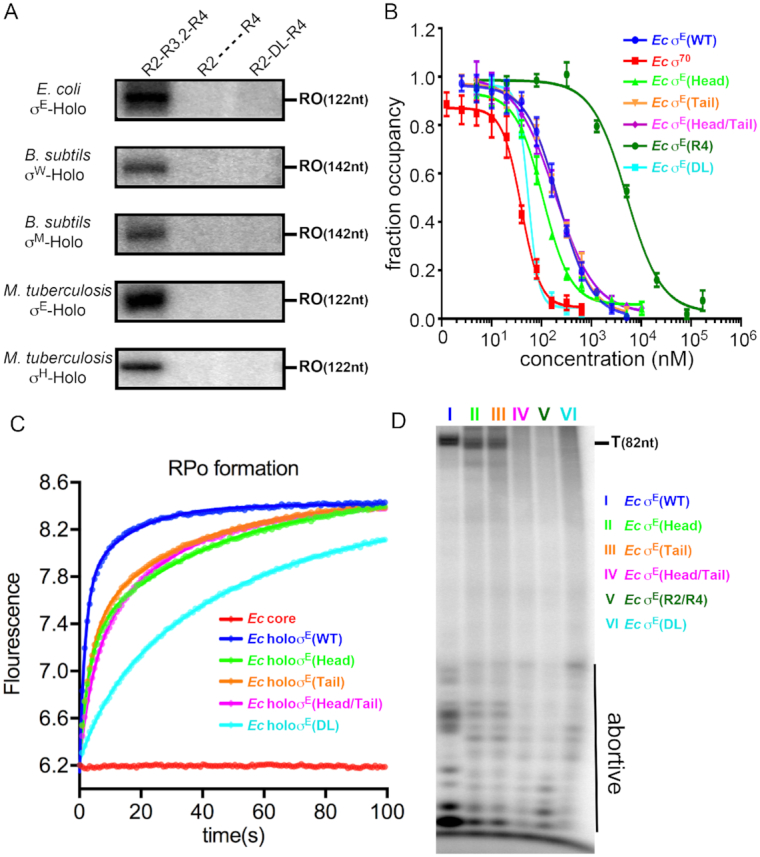
Bacterial RNA polymerase (RNAP) forms distinct holoenzymes with extra-cytoplasmic function (ECF) σ factors to initiate specific gene expression programs. In this study, we report a cryo-EM structure at 4.0 Å of Escherichia coli transcription initiation complex comprising σE-the most-studied bacterial ECF σ factor (Ec σE-RPo), and a crystal structure at 3.1 Å of Mycobacterium tuberculosis transcription initiation complex with a chimeric σH/E (Mtb σH/E-RPo). The structure of Ec σE-RPo reveals key interactions essential for assembly of E. coli σE-RNAP holoenzyme and for promoter recognition and unwinding by E. coli σE. Moreover, both structures show that the non-conserved linkers (σ2/σ4 linker) of the two ECF σ factors are inserted into the active-center cleft and exit through the RNA-exit channel. We performed secondary-structure prediction of 27,670 ECF σ factors and find that their non-conserved linkers probably reach into and exit from RNAP active-center cleft in a similar manner. Further biochemical results suggest that such σ2/σ4 linker plays an important role in RPo formation, abortive production and promoter escape during ECF σ factors-mediated transcription initiation.
© The Author(s) 2019. Published by Oxford University Press on behalf of Nucleic Acids Research.
Figures
Similar articles
-
Structural basis for transcription initiation by bacterial ECF σ factors.Nat Commun. 2019 Mar 11;10(1):1153. doi: 10.1038/s41467-019-09096-y. Nat Commun. 2019. PMID: 30858373 Free PMC article.
-
Cryo-EM structure of Escherichia coli σ70 RNA polymerase and promoter DNA complex revealed a role of σ non-conserved region during the open complex formation.J Biol Chem. 2018 May 11;293(19):7367-7375. doi: 10.1074/jbc.RA118.002161. Epub 2018 Mar 26. J Biol Chem. 2018. PMID: 29581236 Free PMC article.
-
Structural Insight into the Mechanism of σ32-Mediated Transcription Initiation of Bacterial RNA Polymerase.Biomolecules. 2023 Apr 25;13(5):738. doi: 10.3390/biom13050738. Biomolecules. 2023. PMID: 37238608 Free PMC article.
-
Extra Cytoplasmic Function sigma factors, recent structural insights into promoter recognition and regulation.Curr Opin Struct Biol. 2015 Feb;30:71-78. doi: 10.1016/j.sbi.2015.01.006. Epub 2015 Feb 9. Curr Opin Struct Biol. 2015. PMID: 25678040 Review.
-
Recent advances in the characterization of Crl, the unconventional activator of the stress sigma factor σS/RpoS.Biomol Concepts. 2016 Jun 1;7(3):197-204. doi: 10.1515/bmc-2016-0006. Biomol Concepts. 2016. PMID: 27180360 Review.
Cited by
-
An Overview of Genetic Information of Latent Mycobacterium tuberculosis.Tuberc Respir Dis (Seoul). 2021 Jan;84(1):1-12. doi: 10.4046/trd.2020.0116. Epub 2020 Oct 30. Tuberc Respir Dis (Seoul). 2021. PMID: 33121230 Free PMC article.
-
Type III-B CRISPR-Cas cascade of proteolytic cleavages.Science. 2024 Feb 2;383(6682):512-519. doi: 10.1126/science.adk0378. Epub 2024 Feb 1. Science. 2024. PMID: 38301007 Free PMC article.
-
A new twist on PIFE: photoisomerisation-related fluorescence enhancement.Methods Appl Fluoresc. 2023 Oct 12;12(1):012001. doi: 10.1088/2050-6120/acfb58. Methods Appl Fluoresc. 2023. PMID: 37726007 Free PMC article. Review.
-
Structural basis for regulation of a CBASS-CRISPR-Cas defense island by a transmembrane anti-σ factor and its ECF σ partner.Sci Adv. 2024 Oct 25;10(43):eadp1053. doi: 10.1126/sciadv.adp1053. Epub 2024 Oct 25. Sci Adv. 2024. PMID: 39454004 Free PMC article.
-
Bacterial MerR family transcription regulators: activationby distortion.Acta Biochim Biophys Sin (Shanghai). 2022 Jan 25;54(1):25-36. doi: 10.3724/abbs.2021003. Acta Biochim Biophys Sin (Shanghai). 2022. PMID: 35130613 Free PMC article. Review.
References
-
- Feklistov A., Sharon B.D., Darst S.A., Gross C.A.. Bacterial sigma factors: a historical, structural, and genomic perspective. Annu. Rev. Microbiol. 2014; 68:357–376. - PubMed
-
- Gruber T.M., Gross C.A.. Multiple sigma subunits and the partitioning of bacterial transcription space. Annu. Rev. Microbiol. 2003; 57:441–466. - PubMed
Publication types
MeSH terms
Substances
LinkOut - more resources
Full Text Sources
Other Literature Sources
Molecular Biology Databases
